行政院國家科學委員會專題研究計畫 成果報告
運用固定站監測都市街道熱環境之研究
研究成果報告(精簡版)
計 畫 類 別 : 個別型 計 畫 編 號 : NSC 99-2221-E-004-006- 執 行 期 間 : 99 年 08 月 01 日至 100 年 09 月 30 日 執 行 單 位 : 國立政治大學地政學系 計 畫 主 持 人 : 孫振義 計畫參與人員: 碩士班研究生-兼任助理人員:林文喻 大專生-兼任助理人員:連昱棋 博士班研究生-兼任助理人員:巴禎妮 報 告 附 件 : 出席國際會議研究心得報告及發表論文 公 開 資 訊 : 本計畫涉及專利或其他智慧財產權,2 年後可公開查詢中 華 民 國 100 年 12 月 31 日
中 文 摘 要 : 人體熱舒適性會受到很多面向因素的影響,例如:人體生理 機能、熱感受度、衣著量、溫度、濕度、風速…等。本研究 為釐清都市街道環境對於熱舒適性之影響,將實測站設立在 相同街道之五處不同環境條件之測點,測量各項熱舒適相關 數據自上午 11 時到深夜 22 時之連續變化情形,並且計算其 「綜合溫度熱指數(The Wet Bulb Globe Temperature, WGBT)」及「平均輻射溫度(Mean Radiant Temperature, MRT)」,希望藉此對未來人們活動的地方做出實質改善建 議。 根據本研究數據發現,三個實測日測點最大溫差分別是 2.961 oC、3.140 oC 及 3.093 oC,顯示有良好環境的街道將 產生約 3 oC 的溫度差異。另一方面,輻射溫度為影響熱舒適 性指標 WBGT 與 MRT 最關鍵的因素。根據本實驗的結論分析, 在陰影下的測點(建築陰影、園道陰影)普遍幅射溫度較低, 因此本研究建議都市街道應該積極增加陰影面積,以利降低 都市街道高溫化與都市熱島效應之現象。此外根據本研究結 果顯示,鄰近綠園道之實測站雖然氣溫與輻射溫度相對較 低,但亦因為其無建築陰影遮蔽,故反應在環境熱舒適性之 數據並沒有另一個幾乎被建築陰影遮蔽的測站好。由此可 知,在街道熱舒適性中,影響最大的因子應為陰影,其次才 是綠化等因素。 都市熱島效應已有許多的專家學者對此提出許多的看法與進 行研究,根據陳麒文於 2004 年研究結果顯示:「氣溫超過 26℃時,每上升 1 度,尖峰負擔約增加 65 萬千瓦」。因此, 若是可以透過本研究建議之街道環境控制方法,不但可以改 善街道熱舒適性,更可以降低空調能源消耗與碳排放量,達 到節能減碳的目標。 中文關鍵詞: 熱島效應 舒適性指標 微氣候 英 文 摘 要 :
英文關鍵詞: heat island effect, thermal comfort index, microclimate
1 一、前言 台灣是一個人口密集度極高的地區,有高達 77%以上的人口居住於都市之中(林憲德等,2005), 高密度的居住型態導致的都市街道高熱環境將嚴重的影響多數居民的生活舒適度。此外,據台電估 計,台灣地區夏季尖峰室外氣溫每上升 1℃,空調耗電量約上升 6%,以台灣大都會區夏季市中心與 市郊的最高氣溫差 3 -4℃估算,夏季市中心的空調射設備耗電量比郊區高出四分之一﹙林憲德,2000﹚, 顯示都市街道高溫化將會增加周圍居民的空調系統耗電量,惡化台灣日益嚴重的能源問題,對目前 政府極力推廣的「節能減碳」有相當程度的衝突。因此,研究都市街道型態、街道元素與氣溫間的 關係,進而提出改善都市高溫化現象的方針,著實成為都市環境研究者的重要工作之一。 二、研究目的與文獻探討 為釐清都市中街道環境與熱環境的相互關係,在現有的研究文獻中,Johansson 於摩洛哥(乾熱氣 候區)比較了不同街道高寬比的街道環境(Johansson,2006),研究中顯示白天時街道高寬比大的區域 氣溫較低,且其夏季平均溫度較街道高寬比小的區域低 6K,舒適性也是街道高寬比大的區域明顯較 佳。此外,Pearlmutter 等人於以色列(乾燥地區)數個街道實測數據中得出街道高溫化是沙漠氣候夜間 普遍的現象,然而緊密街道峽谷(compact canyon)的型態卻因為能提供較多陰影及降低輻射熱得等因 素,成為了都市冷島(都市較低溫區域),並且在冬季夜間因為可以有效阻擋強風而能夠提供較溫暖的 環境(Pearlmutter 等,1999)。此外,一篇即將在 2010 發表的最新論文(Memon 等,2010)指出:透過 模擬結果,街道高寬比為 8~0.5 的不同街道,在夜間的溫度最大差異可達 7.5K,但日間的差異較小(甚 至為負);並且提到當街道風速從 4m/sec 降低至 0.5m/sec 時,氣溫將會上升 1.3K,顯示出風速與街 道高寬比對於街道峽谷熱環境的重要性。 另外,在一篇探討綠化對於都市街道夏季降溫效果的研究中提到:絕大部分的街道綠化對於降低 溫度都顯著的效果,因此在林蔭大道上所測得的氣溫相較於周圍地區約低了-0.5K(Shashua-Bar 與 Hoffman,2000),不過由於繁忙的交通量所帶來的增溫效果約為 2K(Swaid,1993),相對於另一研究 結論:綠化對於都市周圍環境的降溫效果約 2 (Jonsson℃ ,2004),也造成了此研究中某一林蔭大道量 測結果出現高於周圍 0.75K 的情況(Shashua-Bar 與 Hoffman,2000),也再次彰顯出人工發散熱對於都 市氣候的影響。此外,一篇於 2008 發表的論文中提到運用數值模型模擬倫敦、北京、莫斯科…等九 個世界主要城市,結果證實屋頂綠化與牆面綠化可有效降低都市峽谷之溫度(Alexandri 與 Jones, 2008)。 在一個關於都市氣候與熱島效應的研究中,Taha 指出增加地表反射率與綠覆率將有助於降低熱島 效應(Taha,1997),顯示都市地表的材料與街道高溫化相關性極高。另外,一份運用衛星遙測技術於 北京市的研究中顯示,都市地表不透水率與表面溫度存在著顯著的相關性,並且可以基於地表不透 水率來進行地表溫度的推估(Xiao 等,2007)。此外,在劉翕劼與劉克旺對於株洲城市街區夏日溫度分 佈與街道特徵關係的研究中提出夏季街道溫度受到綠化程度、街道高寬比、街道走向所影響,其中 綠化高的區域溫度約可降溫 0.4-0.8℃,且東西向的街道比南北向的街道溫度平均高 0.6-0.7℃(劉翕劼
2
與劉克旺,2005)。此外,一份在研究建築簇群與陰影的論文(Bourbia 與 Awbi,2004)中也提到:街道 的表面溫度與天空可視因子(sky view factor)有關,另外,在夏季時東西向的街道溫度上升情況也較南 北向的街道明顯,
根據上述研究結論顯示,都市街道元素(地表反射率、不透水率)、尺度(高寬比)、植栽綠化等因 素與氣溫間存在著密不可分的關係。本計畫之前期研究於 2009 年 3 月至 12 月期間承蒙國家科學委 員會專題研究計畫補助「都市街道熱環境之分析」計畫,並且於 2009 年六月至日本 Seventh International Conference on Urban Climate (ICUC-7)研討會發表初期研究成果論文「 An thermal environment investigation of the urban street canyon in a hot and humid region city, Taichung City, Taiwan.」
(Sun et al, 2009),並且獲得許多各國專家學者的迴響與寶貴經驗。此論文係運用移動觀測法之數據與 街道周圍環境因子(綠覆率、街道高寬比、建築比率)進行分析,結果顯示夜間的街道溫度與綠覆率、 街道高寬比及建築密度有顯著的相關性,因此成為本計畫提案的重要基礎數據。 本研究於兩條不同街道中設置 8 處的固定監測站,以全年 8760 小時量測的方式,蒐集街道熱環 境中之溫度、濕度資料,並且比較各測點之間的溫度數據與其街道因素,試圖釐清對於都市街道熱 環境的重要影響因子,並藉由分析條街道周圍環境調查與熱環境量測數據,以具體提出有效降低都 市街道熱環境的方針。 三、研究內容與重要研究成果 (一)研究區域 本研究以台中市五權一街為研究對象,該路段有民居建築、綠園道綠化改善,經過一段實測前的 前期施測,發現對於該路段取得之數據對於本實驗所要研究之對象非常具有參考的價值,故在本街區 選取了五個測點(建築陰影、園道、園道陰影、街道 1、街道 2)作為本次實測的地點。 (樹蔭下) (建築陰影下) 街道 C 街道 B 園道 B 園道 A 街道 A 圖 1 測點位置圖 (二)研究方法 本研究採用「固定氣象站觀測法」,係將溫度感測器(乾球溫、濕球溫、黑球輻射溫等)架設於固定
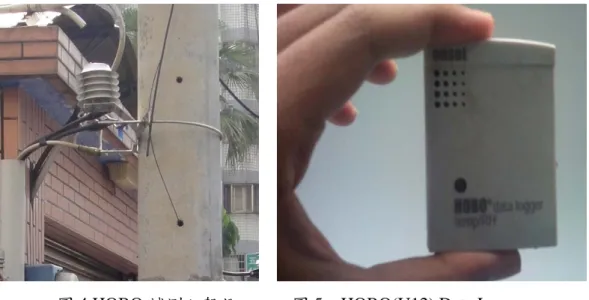
3 支架,置放於固定定點以進行實測,此法具有量測時間同步性的優點,不需要進行時間同步化校正與 標準化,可以避免掉因時間差距帶來的誤差。 圖 2 實測儀器示意圖 圖 3 資料擷取器 CR200 本研究於研究區域內架設五個固定氣象站進行實測,其選定過程係透過以下程序:首先,為確立 固定氣象站設立位置適當與否,本研究於此次實測前先進行了試測(圖 4),採用的是「HOBO U12 DATA LOGGER」(如圖 5),可以記錄溫濕度資料達 8000 筆。
風速計
黑球
濕球溫度計
4
圖 4 HOBO 試測之架設 圖 5 HOBO(U12) Data Logger
1.街道 A 測點(建築陰影下): 固定氣象站架設於南面建築,因太陽由南邊照射關係(太陽直射最北只達北迴歸線),此測點幾乎多 數時間處在陰影之下。 圖 6 街道 A 測點實景 2.園道 A 測點: 此測點周邊具有園道的行道樹綠化,但儀器不架設在樹蔭之下,做為園道陰影下的對照組。測點 西邊約 15 米處有一棟 22 層樓高的建築。 測點位置
5 圖 7 園道 A 測點實景 3.園道 B 測點(樹蔭下): 此測點周邊園道樹冠茂密、通風良好,儀器架設位在陰影之下,難以受到陽光直接照射。 圖 8 園道 B 測點實景 4.街道 B 測點 本測點北面臨街為尚未開發之空地,南面臨有一堵約一米高的圍牆,圍牆邊有一些植栽及椰子樹, 但其陰影並不會遮蔽住儀器。 測點位置 測點位置
6 圖 9 街道 B 測點實景 5.街道 C 測點 本測點北面臨街為尚未開發之空地,南面是民居,但其建築線臨門口尚有一段距離,故此測點受 建築陰影遮蔽的影響較小。 測點位置 測點位置
7 圖 10 街道 C 測點實景 (三) 研究過程與結果 根據本研究設置之固定氣象站實測資料,可釐清在同一街區於夏季在有無建築陰影遮蔽、綠化陰 影遮蔽、通風條件差異...等各種不同的情形之下,由早上 11 時升溫後達到高峰,再逐漸降溫,終至 日落後收斂的連續變化情形,以此實驗結果,來對人們生活環境作出建議,使得人們的熱舒適感受更 加舒服。 而本研究發現,最直接影響 WGBT 及 MRT 指數的因素,就是輻射溫度的高低變化。根據本實驗 的結論分析,在陰影下的測點(建築陰影、園道陰影)可以有比較好的降低幅射溫度效果,因此本研究 建議未來不管是公共空間或是私人區域都應該增加遮蔽,尤其是以綠化(植栽、綠屋頂等)的手法,因 為植栽間的縫隙可以增加空氣流動性,產生的風對熱舒適性的評估也有一定的影響,運用綠化手法不 僅合乎本研究的結論,更不像建築物一樣,可能發生都市微氣候的改變,產生「都市熱島效應」。 都市熱島效應已有許多的專家學者對此提出許多的看法與進行研究,根據林憲德等人於 1999 年的 研究,台灣四大都會區之夏季午夜都市熱島效應強度約為 2.7℃-4.5℃;陳麒文於 2004 年研究結果顯 示:「氣溫超過 26℃時,每上升 1 度,尖峰負擔約增加 65 萬千瓦」。若是可以透過本研究建議之綠美 化改造手法,不但可以減低消耗多餘的建材,更可以節省能源與碳排放量,從更加根本性的地方下手 來維護人體的熱舒適性。 而在本研究中也發現,太陽照射角度因時序的變化,與周遭環境(地形、建築、植栽)形成不同角度 的照射情形,也會造成輻射溫度的改變,然而本研究並無足夠的時間與方法針對此問題做更詳細的研 究,因此建議後續研究能針對太陽對測點照射角度的變化做出記錄,以作為影響輻射溫度變化的量化 數據之一。 本計畫原提案之設備費因僅能補助一半,導致部分研究範圍限縮(熱環境與氣象因子分析),尤甚 可惜。本研究將會繼續爭取經費,並延續進行本研究。 表 1 實測期間各測點最大溫差表 Date 09/03 09/04 09/05 數值 時間 測點 數值 時間 測點 數值 時間 測點 測點間 最大溫差 2.961 13:01 街道 B 街道 A 3.140 12:01 街道 B 街道 A 3.093 12:26 街道 C 街道 A 14:20- 14:40 測點間 最大溫差 數值 時間 測點 數值 時間 測點 數值 時間 測點 2.891 14:24 街道 B 園道 B 2.607 14:40 街道 B 街道 A 2.528 14:24 街道 B 街道 A 表 2 實測期間各點平均溫差表 Date 09/03 09/04 09/05 測點間最大溫差 平均(全日) 1.680 1.569 1.447 測點間最大溫差 平均(日落前) 2.134 2.129 1.930 測點間最大溫差 0.815 0.497 0.519
8 平均(日落後) 圖 11 實測日 2011/9/3 各測點乾球溫度 圖 12 實測日 2011/9/3 各測點濕球溫度 27 28 29 30 31 32 33 34 35 36 time 11:2 0 11 :4 0 12 :0 0 12 :2 0 12 :4 0 13 :0 0 13 :2 0 13 :4 0 14 :0 0 14 :2 0 14 :4 0 15 :0 0 15 :2 0 15 :4 0 16 :0 0 16 :2 0 16 :4 0 17 :0 0 17 :2 0 17 :4 0 18 :0 0 18 :2 0 18 :4 0 19 :0 0 19 :2 0 19 :4 0 20 :0 0 20 :2 0 20 :4 0 21 :0 0 21 :2 0 21 :4 0 22 :0 0 街道A (建築陰影下) 園道A 園道B (樹蔭下) 街道B 街道C 22 22.5 23 23.5 24 24.5 25 25.5 26 26.5 27 time 11:2 0 11 :4 0 12 :0 0 12 :2 0 12 :4 0 13 :0 0 13 :2 0 13 :4 0 14 :0 0 14 :2 0 14 :4 0 15 :0 0 15 :2 0 15 :4 0 16 :0 0 16 :2 0 16 :4 0 17 :0 0 17 :2 0 17 :4 0 18 :0 0 18 :2 0 18 :4 0 19 :0 0 19 :2 0 19 :4 0 20 :0 0 20 :2 0 20 :4 0 21 :0 0 21 :2 0 21 :4 0 22 :0 0 街道A (建築陰影下) 園道A 園道B (樹蔭下) 街道B 街道C 25 30 35 40 45 50 time 11:2 0 11 :4 0 12 :0 0 12 :2 0 12 :4 0 13 :0 0 13 :2 0 13 :4 0 14 :0 0 14 :2 0 14 :4 0 15 :0 0 15 :2 0 15 :4 0 16 :0 0 16 :2 0 16 :4 0 17 :0 0 17 :2 0 17 :4 0 18 :0 0 18 :2 0 18 :4 0 19 :0 0 19 :2 0 19 :4 0 20 :0 0 20 :2 0 20 :4 0 21 :0 0 21 :2 0 21 :4 0 22 :0 0 街道A (建築陰影下) 園道A 園道B (樹蔭下) 街道B 街道C (℃) (℃) (℃)
9 圖 13 實測日 2011/9/3 各測點黑球溫度 圖 14 實測日 2011/9/3 各測點 WGBT 指數 圖 15 實測日 2011/9/3 各測點 MRT 指數 參考文獻 林憲德. 綠建築設計技術彙編. 內政部建築研究所 2000. 林 憲 德 , 孫 振 義 , 郭 曉 青 , 李 魁 鵬 . 台 南 地 區 都 市 規 模 與 都 市 熱 島 強 度 之 研 究 . 都 市 與 計 劃 2005;32(1):83-97. 劉翕劼,劉克旺. 株洲城市街區夏日溫度分佈與街道特徵關係的研究.湖南林業科技 2005;32(2):11-13. Alexandri, Eleftheria and Phil Jones. Temperature decreases in an urban canyon due to green walls and
green roofs in diverse climates. Building and Environment 43(2008): 480-493.
Bourbia, F. and H.B. Awbi. Building cluster and shading in urban canyon for hot dry climate Part 1: Air and surface temperature measurements. Renewable Energy 29(2004): 249-262.
Johansson Erik. Influence of urban geometry on outdoor thermal comfort in a hot dry climate: A study in
Fez, Morocco. Building and Environment 2006;41:1326-1338.
Jonsson P. Vegetation as an urban climate control in the subtropical city of Gaborone, Botswana. 22 24 26 28 30 32 time 11:2 0 11 :4 0 12 :0 0 12 :2 0 12 :4 0 13 :0 0 13 :2 0 13 :4 0 14 :0 0 14 :2 0 14 :4 0 15 :0 0 15 :2 0 15 :4 0 16 :0 0 16 :2 0 16 :4 0 17 :0 0 17 :2 0 17 :4 0 18 :0 0 18 :2 0 18 :4 0 19 :0 0 19 :2 0 19 :4 0 20 :0 0 20 :2 0 20 :4 0 21 :0 0 21 :2 0 21 :4 0 街道A (建築陰影下) 園道A 園道B (樹蔭下) 街道B 街道C 25 30 35 40 45 50 time 11:2 0 11 :4 0 12 :0 0 12 :2 0 12 :4 0 13 :0 0 13 :2 0 13 :4 0 14 :0 0 14 :2 0 14 :4 0 15 :0 0 15 :2 0 15 :4 0 16 :0 0 16 :2 0 16 :4 0 17 :0 0 17 :2 0 17 :4 0 18 :0 0 18 :2 0 18 :4 0 19 :0 0 19 :2 0 19 :4 0 20 :0 0 20 :2 0 20 :4 0 21 :0 0 21 :2 0 21 :4 0 22 :0 0 街道A (建築陰影下) 園道A 園道B (樹蔭下) 街道B 街道C (℃) (℃)
10
International Journal of Climatology 2004;24:1307-1322.
Memon, Rizwan Ahmed, Dennis Y.C. Leung, Chun-Ho Liu. Effects of building aspect ratio and win speed on air temperatures in urban-like street canyons. Building and Environment 45(2010): 176-188.
Pearlmutter D., Bitan A., and Berliner P. Microclimatic analysis of “compact” urban canyons in an arid zone. Atmospheric Environment 1999;33:4143-4150.
Shashua-Bar L. and Hoffman M.E. Vegetation as a climatic component in the design of an urban street.
Energy and Buildings 2000;31:221-235.
Sun, Chen-Yi, Soushi Kato, Wen-Pei Sung, Hsien-Te Lin, Fu-Jen Wang, Wen-Sheng Ou. An thermal
environment investigation of the urban street canyon in a hot and humid region city, Taichung City, Taiwan., Seventh International Conference on Urban Climate (ICUC-7), Yokohama, Japan, 2009.
Swaid H. Urban climate effects of artificial heat sources and ground shadowing by buildings. International
Journal of Climatology 1993;13:797-812.
Taha H. Urban climates and heat islands: albedo, evapotranspiration, and anthropogenic heat. Energy and
Buildings 1997;25(2):99-103.
Xiao R., Ouyang Z., Zheng H., LI W., Schienke E.W., and Wang X. Spatial pattern of impervious surfaces and their impacts on land surface temperature in Beijing, China. Journal of Environmental Sciences
1
國科會補助專題研究計畫項下出席國際學術會議心得報告
日期:100 年 9 月 9 日 一、參加會議經過 在「中華民國都市計劃學會」安排投稿與參訪團策劃下,一行人十多位台灣都市計劃相關領 域 之 專 家 學 者 一 同 前 往 南 韓 慶 州 參 與 「 2011 台日韓國際都市計劃研討會(2011 International Symposium on City Planning)」,會中共分為 11 個主題(Planning theory and history, Planning strategies, Tourism, Transportation and urban infrastructure, Urban and regional analysis, Land and housing, Regional planning, Sustainable development, Disaster prevention, Landscape planning and design, Landuse planning),共計台日韓三國學者共計發表了 83 篇論文。本人發表的論文為「台中街道熱環境
觀測與分析(The observation and analysis of street thermal environment in Taichung)」,被歸類在「都市 與區域分析(Urban and regional analysis)」這一場次中。
計畫編號 NSC 99- 2221 -E - 004 - 006 -
計畫名稱
運用固定站監測都市街道熱環境之研究
出國人員
姓名
孫振義
服務機構
及職稱
國立政治大學地政學系
會議時間
100 年 8 月 27 日至 100 年 8 月 27 日會議地點
韓國慶州
會議名稱
(中文)2011 台日韓國際都市計劃研討會
(英文)
2011 International Symposium on City Planning發表論文
題目
(中文)台中街道熱環境觀測與分析
(英文)The observation and analysis of street thermal environment in
Taichung.
2 參與會議開幕式照片 會中與日本學者合影 二、與會心得 本次會議除了台灣過去的專家學者外,也有許多來自日本與韓國本地的學者,在大會安排下 每一場次的發表都有很充分的時間進行問題討論。因此,在這次的論文發表中,本人也有幸能夠 與幾位國外學者建立初步的研究討論關係。此外,由於部分議題領域差異,雖有機會能夠初探都 市計劃其他領域的研究成果,但無法廣泛認識個人多年從事之「都市環境」領域之專家學者,是 本次與會唯一遺憾。
3 會議中專家學者討論交流情況照片 三、考察參觀活動(無是項活動者略) 本次會議後半段,在主辦單位的安排下有機會參訪了慶州著名的「天馬塚」、「觀星台」與「佛 國寺」,也算是對於慶州當地的文化有若干程度的初步瞭解。 慶州當地文化參訪照片 四、建議 參與國際會議相當有益於本國學者與他國學者間的交流,並且可以即時建立跨國研究伙伴關 係,因此,建議「國家科學委員會」可以考慮將補助提升至每一年度兩次(定額上限)的方式。 此外,在國際學術會議上,本國學者應踴躍提出問題與發言,並儘可能打破國界與語言的屏 障,讓學術研究更具國際化視野與觀點。
4 五、攜回資料名稱及內容
會議論文集與論文集光碟 六、其他
敬愛的孫教授,您好:
2011 台日韓國際都市計劃研討會承蒙各方人士踴躍寄來論文摘要
冀望參與,敬表謝忱。
經本學會慎重審查後,茲將其結果與撰稿格式公佈如下:
閣下之論文摘要
「
The observation and analysis of street thermal
environment in Taichung
」
已被接受。
1. 請於
2011 年 6 月 17 日
前將完整論文以 E-mail 寄至學會信箱,以
便彙整轉寄審查者,審查後再決定是否接受於研討會發表。
屆時未見完整論文,將不予考慮在本屆研討會中安排發表,投稿人
必須親自參與研討會。
2. 隨函附上論文撰寫格式,請依照撰寫格式寫作。
中華民國都市計劃學會
秘書處敬啟
2011 年 04 月 19 日
1
The observation and analysis of street thermal environment
in Taichung
Chen-Yi Sun1 Soushi Kato2
Abstract
To estimate the impact of street characteristics on the thermal environment in an urban street canyon in a hot and humid region, transect data were used to analyze the relation between three factors (urban green ratio, building ratio and height to width ratio) and air temperature in two streets in Taichung City, Taiwan. In this study, air temperature data were collected by transects at four different level heights (1, 2, 3 and 4 meter height) in two streets; meanwhile, the use of three street characteristics data calculated by GIS data which can represent the environment conditions of 34 measured locations. The Analysis results shows that the air temperature significant correlated with height to width Ratio (r=0.481), green ratio (r=0.729) and building ratio (r=0.654), respectively at night. In conclusion, this study demonstrates that increasing the green ratio and decreasing the building density are important strategies to mitigate urban warming and to create a comfortable thermal environment.
Keywords: heat island, urban canyon, energy consumption, green city
1. Introduction
As urbanization progresses, the “urban warming” problem is mainly aggravated because of the reduced density of green vegetation and increased building in the urban environment. Therefore, how to diminish the heat island effect and to keep the urban area cool could be a very important issue for urban environment researchers. Rosenfeld et al.’s study in alleviating the urban warming problem and the heat island effect, believes in a three-pronged strategy that looks beyond the microclimate and below trees focusing on: cool roofs, cool pavements, and vegetation for evapotranspiration (Rosenfeld et al., 1995). According to the result of a previous study, vegetation surfaces show lower radiative temperatures around 20 K than other inanimate ones of the same color (Wilmers, 1988). The study by Shashua-Bar and Hoffman also indicated that the vegetation cooling effect in all study sites was 2.8 K, ranging from as low as 1 K in a street with heavy traffic to as high as 4 K in the smallest garden (Shashua-Bar and Hoffman, 2000). It also demonstrated that
1 Dept. of Land Economics, National Chengchi University (Taiwan) 2 National Institute for Environmental Studies (Japan)
2
vegetation and traffic condition have a strong influence on the temperature in the street. Besides, a previous study also found that vegetation enables a sensitive decrease of the study area of thermal discomfort (Ali-Toudert and Mayer 2007a). On the other hand, urban geometry and thermal properties of urban surfaces have been found to be the two main parameters influencing urban climate (Oke, 1987; Oke et al., 1991). The ratio between the height of buildings (H) and the distance between them (W) influences the amount of both incoming and outgoing radiation. The nocturnal heat island effect has been shown to increase with height to width ratio (H/W %) since the net outgoing long-wave radiation decreases due to reduced sky view factor. In a previous study it was also shown that the trees cooling effect is related to the streets geometry (Shashua-Bar et al., 2010).
Furthermore, there are several previous studies referring to the thermal environment and characteristic in urban street canyons (Niachou et al., 2008; Johansson, 2006; Shashua-Bar and Hoffman, 2003; Pearlmutter et al., 1999; Priyadarsini et al., 2008). The paper found that the air temperature in the centre of the urban street canyon at a height of 3.5 meter was higher than it was at a height of 15.5 meter. Johansson conducted a study that investigated the influence of urban geometry on outdoor thermal comfort by comparing an extremely deep and a shallow street canyon in Fez, Morocco (Johansson, 2006), and found that in the summer, the maximum difference was on average 6K and as great as 10K during the hottest days.
According to the results of some previous studies, they indicated that tree plantings along the roadside have the impact in reducing the sky view factor; therefore, H/W ratio could be the much independent factor of urban street geometry. Besides, green ratio has been selected as an environmental factor because trees can provide shadow and vegetation may influence ambient thermal environment by evaporation. Moreover, building density can represent the heat effects by thermal capacity of building material and anthropogenic heat; hence building ratio was considered an important factor in this study. Furthermore, green ratio (G %), building ratio (B %) and H/W ratio (H/W %) were selected as variables of street thermal environment not only because urban green density, building density, and H/W ratio have a strong influence on the microclimate around buildings in the urban street but also these three factors can be restrained by Urban Design Act.
The aim of this paper is to investigate the influence of these three parameters, G %, B % and H/W %, on the microclimate at the street level in a hot and humid city. This is done by comparing urban canyons in two streets in Taichung City, Taiwan in summer, 2009. The study is based on field measurements of air temperature and GIS data. The results of this experiment can be very useful for understanding the impact of street characteristics on the thermal environment in an urban street canyon.
3
2. The study area, observations and methodology
2.1 Study area
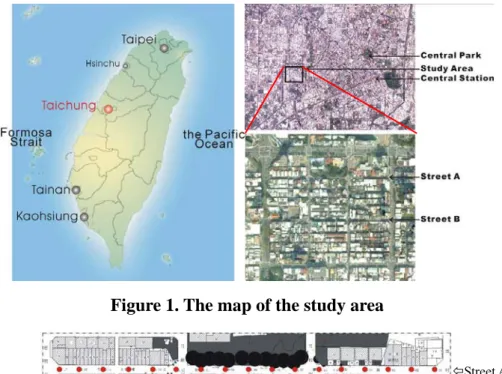
Taichung city (24o 08’ N, 120o 41’ E) is the major city located in the middle of Taiwan surrounding by mountains (Fig. 1). The climate is characterized by hot and humid summers and cold winters. The annual average temperature is 23oC and the annual rainfall is about 1700 mm. Taichung city was chosen for this study because its weather condition and street characteristics can represent a prototype of cities in Taiwan.
In the present study, a number of experimental procedures were carried out in two urban street canyons, which are oriented with their long-axis in an E-W direction, located in a typical residential area, near the centre of Taichung city. The study’s streets having a range of H/W ratio from 0% to 250%, a range of green ratio from 0% to 48%, and a range of building ratio from 0% to 39%, and they can represent a wide range of urban street canyon characteristics in Taiwan. In every street, 17 measurement sites were chosen with the intention to investigate the thermal characteristics during hot weather condition (Fig. 2). The centre of the streets is comprised of an asphalt road and the building façades are made of concrete and generally covered with plaster or tiles (Fig. 3).
Figure 1. The map of the study area
Figure2. Measurement point location of two streets (measuring points)
Street A
4
Figure 3. Two examples of measuring points in two study streets
Table 1. Weather condition of 5 mobile transect surveys
Date Temperature (oC) Dew point (oC) RH (%) Wind Speed (m/sec) Max Wind Speed (m/sec) Sunshine duration (hr.) Cloud cover (0~10) Global radiation (MJ/m2) Jun. 7 26.9 20.6 69.2 1.2 1.8 6.9 3.7 19.9 Jul. 30 29.9 23.5 68.9 1.8 2.3 4.8 5.1 15.5 Aug. 19 28.9 23.0 71.4 1.2 1.8 4.7 5.3 14.5 Aug. 27 29.8 23.4 69.1 1.2 1.8 7.9 3.4 19.4 Sep. 7 29.6 22.4 66.3 1.4 2.2 9.7 2.8 22.7
2.2 Mobile transect survey
Mobile transects were conducted three times throughout the 24 hour period of a day in order to measure the thermal environment during the day and at night. The data of this study consisted of 15 mobile transects in June to September, 2009. The experiments were performed three times every 24 hours during the periods of 14:00, 18:00 and 22:00 in summer, 2009 and over a prescribed route (Fig 2). The route began from east side of Street A and ended in east side of Street B.
The mobile transect instruments which were used in this study were the TR-72U Thermo Recorder which can measure and record temperature (in a range of -60 to 155 oC with 0.1 oC resolution and ±0.3 oC accuracy). Four TR-72U sensors were attached to a metal pole at the heights of 1-, 2-, 3-, and 4-m. As these sensors were not aspirated, it was also important that measurements occurred when the air was not completely stagnant during the study to minimize lags in sensor response. Each TR-72U sensor was synchronized and programmed to sample temperatures and geographical coordinates at 2-s intervals. The TR-72U sensors were subject to pre- and post-fieldwork calibration to ensure that the measurements were within the manufacturer’s specifications. All temperature data have accurate temporal adjustment of temperature change rates over the study area based off the weather station data. All transects had been completed within two hours in similar traffic condition and by the same route.
5
2.3 Street characteristics
This present study measured air temperature and street characteristics of 17 measurement points on each street canyon using field experiments and surveys, respectively. Green ratio (G %) and building ratio (B %) data of every measurement point were evaluated using GIS data (Fig. 4). Each measurement point represents an area of 314 m2—approximately a 10 meter radius around the points. The tree or shrub cover indicated in this study is the visually projected foliage area of tree or shrub cover on a horizontal floor and expressed as a percentage of 314 m2 of floor area with respect to the measurement points. Meanwhile, the building ratio data of every measurement point was also calculated by the same method.
Furthermore, the H/W % data were calculated by equation (1) which was defined by author (Fig. 5). The aim is to present the detailed street characteristics data of two urban street canyons in the study area. The G %, B%, and H/W % data of each measurement point is presented in Table 2 and 3.
H/W % =Σ [Hi×(10-Di)/10] / 2W (1)
Where H is the height of buildings beside street, W is the width of streets and D is the distance from every building to street edge.
Fig.4. The calculation samples of building ratio (B%) (left) and green ratio (G%) (right) with 10 meter radius
Fig.5. The calculation method of H/W ratio
6
Table 2 H/W ratio (H/W %), green ratio (G %) and building ratio (B %) data in 17 measured points in street A (unit: %)
A01 A02 A03 A04 A05 A06 A07 A08 A09 A10 A11 A12 A13 A14 A15 A16 A17
H/W% 118 143 89 73 32 6 0 26 7 48 17 61 81 94 100 95 57
G% 0 0 0 12 31 16 48 34 24 44 27 2 3 4 0 0 0
B% 27 27 38 23 6 0 0 6 2 3 9 8 30 33 36 39 27
Table 3 H/W ratio (H/W %), green ratio (G %) and building ratio (B %) data in 17 measured points in street B (unit: %)
B01 B02 B03 B04 B05 B06 B07 B08 B09 B10 B11 B12 B13 B14 B15 B16 B17
H/W% 250 48 18 167 186 138 22 45 94 64 150 3 67 178 34 175 191
G% 0 0 1 0 2 0 0 16 32 3 0 16 1 0 0 0 0
B% 23 21 20 27 31 24 26 25 25 22 37 0 0 16 19 4 26
3.Results and analysis
3.1 Temperature distribution at four different heights
Since it is important to understand the thermal influence from the ground surface to adjacent air, air temperature thermometers were placed in the centre of the urban street canyon at four different heights to study the vertical distribution of air temperatures in the urban street canyons during the periods of 14:00, 18:00 and 22:00. Road and building surfaces receive solar radiation as a function of their absorptivity and exposure to sun, they receive and emit long wave radiation as a function of their temperature, emissivity and view factor, and they transfer heat to or from the ambient air and exchange heat via conduction procedures with the lower material layers (Georgakis, 2006). Therefore, the optical and thermal characteristics of materials used in urban canyons have a very important impact on the canyon energy balance.
Comparing the temperature data at four different heights, the highest temperatures occurred at 1-meter height due to heat transfer phenomena from the asphalt heating both during the daytime and nighttime measured period. Nevertheless, the temperature profiles of four different heights have a same trend (Fig 6-8). During the whole experiment, higher temperatures are measured at the ground level (1-meter height), and the temperature is found to decrease as a function of height. This is in agreement with the distribution of the surface temperature in the canyon during the night period and is related to the radiative balance of the canyon surfaces. This result agrees as well with two previous studies conducted in Greece (Santamouris et al. 1999; Niachou et al., 2008). The profiles of 2- and 3-m height temperature data especially correspond with the other three profiles; leading to the conclusion that setting up a thermometer at either 2 or 3 meters above the ground could be the appropriate height for an urban street canyon experimental study.
7
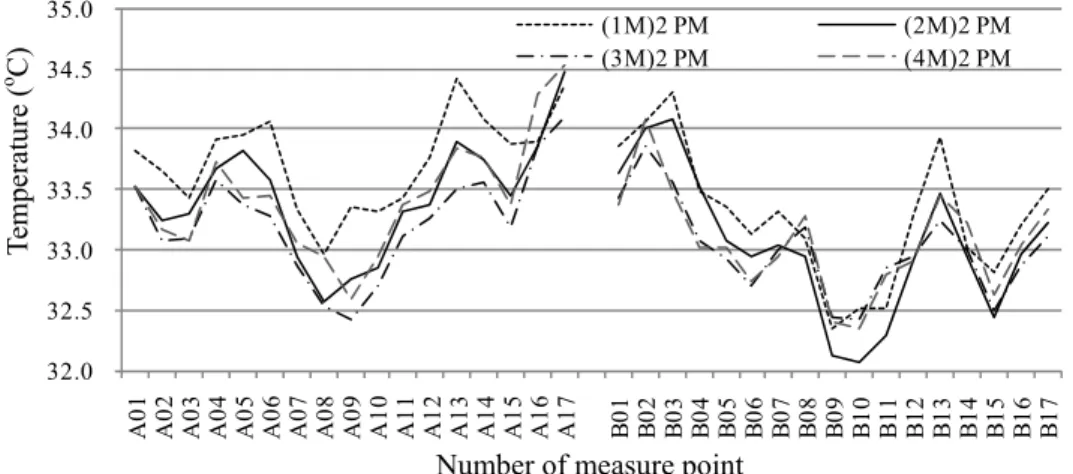
Generally, the maximum temperatures approximately reached 34.5 oC at 14:00, 31.5 oC at 18:00, and 30.1 oC at 22:00. The temperature difference between the maximum and minimum values across the canyon at 14:00 reached 2.5 oC, as a function of the optical and physical properties of the street materials and the variability of solar radiation. Also, the corresponding maximum temperature differences ranged 1.5 oC at 18:00 and 22:00 in the same study area. The results indicated that the thermal environment situations could be different even though the data were collected within same study area due to the difference street characteristics of every measurement point. 32.0 32.5 33.0 33.5 34.0 34.5 35.0 A0 1 A0 2 A0 3 A0 4 A0 5 A0 6 A0 7 A0 8 A0 9 A1 0 A1 1 A1 2 A1 3 A1 4 A1 5 A1 6 A1 7 B0 1 B0 2 B0 3 B0 4 B0 5 B0 6 B0 7 B0 8 B0 9 B1 0 B1 1 B1 2 B1 3 B1 4 B1 5 B1 6 B1 7 (1M)2 PM (2M)2 PM (3M)2 PM (4M)2 PM
Fig. 6 Average temperature distribution in two streets at the heights of 1-, 2-, 3- and 4-m at 2 p.m. 29.0 29.5 30.0 30.5 31.0 31.5 32.0 A0 1 A0 2 A0 3 A0 4 A0 5 A0 6 A0 7 A0 8 A0 9 A1 0 A1 1 A1 2 A1 3 A1 4 A1 5 A1 6 A1 7 B0 1 B0 2 B0 3 B0 4 B0 5 B0 6 B0 7 B0 8 B0 9 B1 0 B1 1 B1 2 B1 3 B1 4 B1 5 B1 6 B1 7 (1M)6 PM (2M)6 PM (3M)6 PM (4M)6 PM
Fig. 7 Average temperature distribution in two streets at the heights of 1-, 2-, 3- and 4-m at 6 p.m. Te mperat ure ( o C)
Number of measure point
Te
mperat
ure
(
o C)
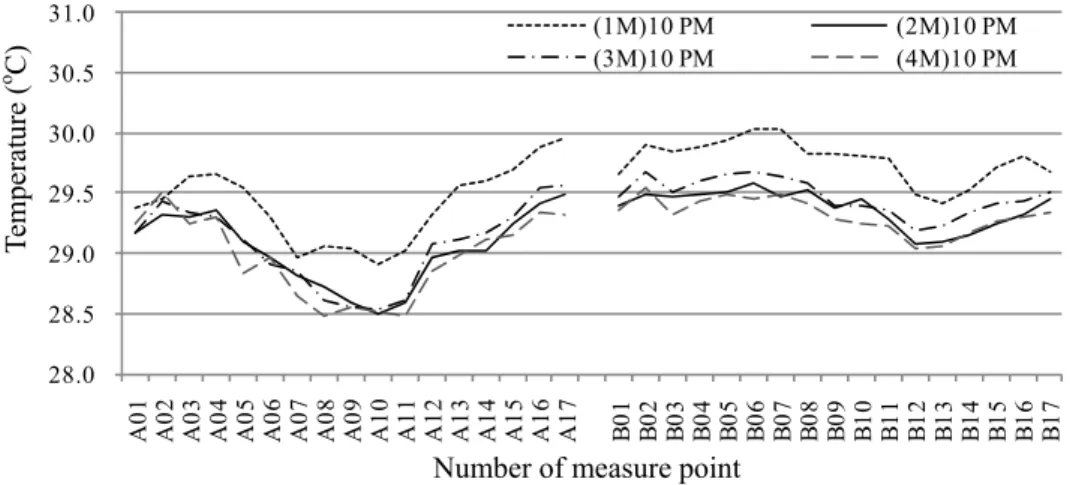
8 28.0 28.5 29.0 29.5 30.0 30.5 31.0 A0 1 A0 2 A0 3 A0 4 A0 5 A0 6 A0 7 A0 8 A0 9 A1 0 A1 1 A1 2 A1 3 A1 4 A1 5 A1 6 A1 7 B0 1 B0 2 B0 3 B0 4 B0 5 B0 6 B0 7 B0 8 B0 9 B1 0 B1 1 B1 2 B1 3 B1 4 B1 5 B1 6 B1 7 (1M)10 PM (2M)10 PM (3M)10 PM (4M)10 PM
Fig. 8 Average temperature distribution in two streets at the heights of 1-, 2-, 3- and 4-m at 10 p.m.
3.2 The relationship between temperature and street characteristics
Figure 9 shows the distribution of nocturnal average temperature, H/W ratio, Green ratio, and Building ratio in the study’s observed streets. It indicates that the higher nocturnal average temperature occurred in some measured points which have a high H/W ratio and Building ratio based on the fact that a high building density environment will release more heat from the surface material and facilities of buildings. Since vegetation can provide a great cool effect by evaporation, the area, which has a high green density, will reveal a lower nocturnal average temperature. According to the results of this study shown in Figure 9, the profiles reveal the significant reverse trend between the green ratio and nocturnal average temperature, especially in the measured points A10 and B12.
0% 50% 100% 150% 200% 250% 300% 28.0 28.2 28.4 28.6 28.8 29.0 29.2 29.4 29.6 29.8 A0 1 A0 2 A0 3 A0 4 A0 5 A0 6 A0 7 A0 8 A0 9 A1 0 A1 1 A1 2 A1 3 A1 4 A1 5 A1 6 A1 7 B0 1 B0 2 B0 3 B0 4 B0 5 B0 6 B0 7 B0 8 B0 9 B1 0 B1 1 B1 2 B1 3 B1 4 B1 5 B1 6 B1 7
Nocturnal average air temperature H/W ratio
G ratio B ratio
Fig. 9 Nocturnal average temperature, H/W %, G % and B % distribution
Te
mperat
ure
(
o C)
Number of measure point
Noct
urnal a
verage air tempe
rature
(
o C)
Number of measure point
H /W % , G % an d B %( % )
9
3.3 The relationship between temperature and H/W ratio
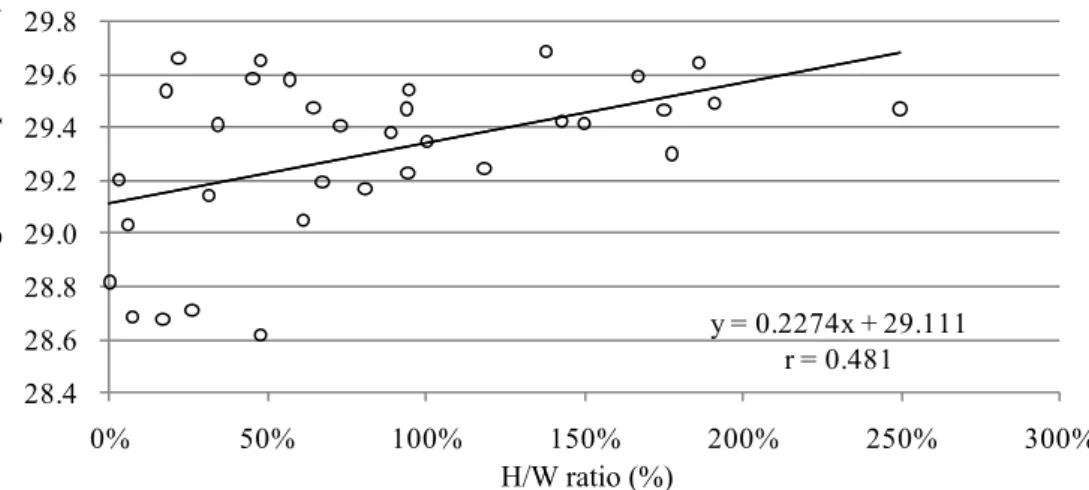
In this paper the nocturnal temperature distribution is analyzed in relation to the H/W ratio (Fig 9). The positive correlation coefficients between air temperature and height to width ratio showed that H/W % can influence the thermal environment of an urban street canyon after sunset, because the higher H/W ratio situation can provide more heat from building surfaces and decrease the wind flow which can release the heat from streets especially in summer. However, according to the results of this study and a previous study by Eliasson (Eliasson, 1996), the weak connection between geometry and air temperature in an urban street canyon suggests that the role of geometry should not be overestimated, at least not during the night.
y = 0.2274x + 29.111 r = 0.481 28.4 28.6 28.8 29.0 29.2 29.4 29.6 29.8 0% 50% 100% 150% 200% 250% 300%
Fig. 10 The relationship between nocturnal average temperature and H/W ratio at 10 p.m.
3.4 The relationship between temperature and green ratio
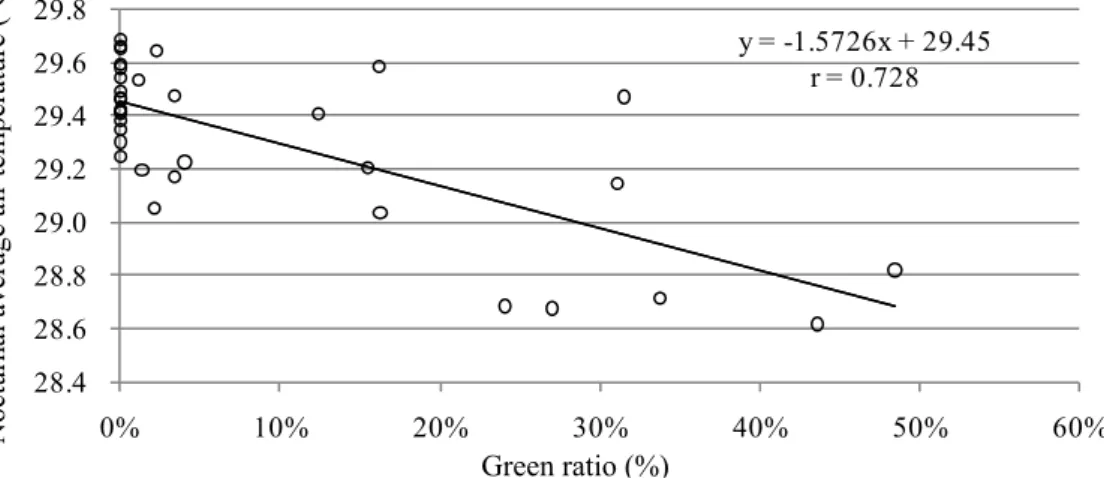
The vegetation can provide shade and the cool effect by evapotranspiration; therefore, planting shade trees or increasing the green ratio in an urban street canyon can mitigate the heat island effect and drop the ambient air temperature. By day, the relationship between air temperature and vegetation density was not significant in this study, because the air temperature was strongly influenced by the asphalt, sunlight, shadow, and traffic. It means that even the vegetation does not provide much evaporation to cool the ambient environment during the night; the use of a vegetation cover is still cooler than other kinds of land-covers such as concrete and asphalt. Figure 11 indicates the relation between the nocturnal average air temperature and the H/W ratio, which was found to be significant with a correlation coefficient of 0.729. This result indicates that the green ratio has a negative relationship with temperature during the night.
Noct
urnal a
verage air tempe
rature
(
o C)
10 y = -1.5726x + 29.45 r = 0.728 28.4 28.6 28.8 29.0 29.2 29.4 29.6 29.8 0% 10% 20% 30% 40% 50% 60%
Fig. 11 The relationship between nocturnal average temperature and green ratio at 10 p.m.
3.5 The relationship between temperature and building ratio
In urban areas, the high volumes of traffic and anthropogenic heat play important roles in the warming of surrounding air in urban areas. A high building ratio area will have more anthropogenic heat releasing from the buildings and less spaces for vegetation. Therefore, high nocturnal average air temperature will occur frequently in some high building ratio areas. In this study, after sunset, the significant correlation coefficients between average air temperature and building ratio were found at four different height levels in the summer (Fig. 12). It means that buildings retained heat to release later from the surfaces and facilities and caused a high ambient air temperature at night. y = 1.6051x + 28.99 r = 0.654 28.4 28.6 28.8 29.0 29.2 29.4 29.6 29.8 0% 5% 10% 15% 20% 25% 30% 35% 40% 45%
Fig. 12 The relationship between nocturnal average temperature and building ratio at 10 p.m.
4. Discussion and Conclusion
In this paper, mobile transect data and GIS data were used to analyze the relationship between urban street canyon characteristics and the thermal environment in the Taichung metropolitan area, Taiwan. First, the results indicated that the thermal
Noct
urnal a
verage air tempe
rature ( o C) Green ratio (%) Noct urnal a
verage air tempe
rature
(
o C)
11
environment situations could be different even though the data were collected within same observation area due to differing street characteristics of every measured point. Nevertheless, the profiles of 2- and 3-m height temperature data are correspond with the other three profiles; meaning that setting up a thermometer at either 2 or 3 meters above the ground could be the appropriate height for urban street canyon experimental study. All of the mobile transect in this study observed temperature differences that occurred at noon (2.5 oC), night (1.5 oC), and midnight (1.5 oC), no matter what kind of sky conditions and what level of wind speed.
The above results indicate that the average nocturnal temperature distribution inside urban street canyons is a function of street geometry and characteristics, as well as, the urban green ratio, the building ratio, and the height to width ratio. Furthermore, the understanding of specific thermal characteristics is essential for studies of the heat island effect and sustainable cities. According to the results of this study and a previous article (Emmanuel R, 2009) and the significant correlation coefficients between air temperature and the height to width ratio (r = 0.481), green ratio (r = 0.729) and building ratio (r = 0.654), increased vegetation and decreased building density in an urban street canyon could be an effective policy for mitigating urban warming, improving the street thermal environment during summer and creating a sustainable urbanity. In addition, a judicious combination of appropriate aspect ratios and orientation, arranging galleries, planting trees, greening the façades or using other shading devices on the walls are a few possible solutions for solving the same problems as suggested in a previous study (Ali-Toudert and Mayer, 2007b). Furthermore, base on the analysis result, regulating the G % above 35% of urban street could mitigate urban warming about 0.55 oC and create more comfortable thermal environment.
5. Acknowledgments
The support of National Science Council (project NSC 98-2218-E-004 -001), Republic of China (Taiwan), is gratefully acknowledged.
6. References
Ali-Toudert F, Mayer H (2007a) Effects of asymmetry, galleries, overhanging façades and vegetation on thermal comfort in urban street canyons. Solar Energy 81: 742-754
Ali-Toudert F, Mayer H (2007b) Thermal comfort in an east–west oriented street canyon in Freiburg (Germany) under hot summer conditions. Theoretical and Applied Climatology 87: 223-237 Chow WTL, Pope RL, Martin CA, Brazel AJ (2011) Observing and modeling the nocturnal park cool
island of an arid city: horizontal and vertical impacts. Theoretical and Applied Climatology 103: 197-211
Eliasson I (1996) Urban nocturnal temperature, street geometry and land use. Atmospheric Environment 30(3): 379-392
12
Emmanuel R (2009) Sustainable urbanity and urban climate change: Amelioration of UHI’s as a quality-of-life agenda for tropical Mega-cities. Proceeding of The seven International Conference on Urban Climate, Yokohama, Japan
Georgakis C, Santamouris M (2006) Experimental investigation of air flow and temperature distribution in deep urban canyons for natural ventilation purposes. Energy and Buildings 38: 367-376
Johansson E (2006) Influence of urban geometry on outdoor thermal comfort in a hot dry climate: A study in Fez, Morocco. Building and Environment 41: 1326-1338
Oke TR (1987) Boundary Layer Climates (2nd Edition). Methuen, London.
Oke TR, Johnson GT, Steyn DG, Watson ID (1991) Simulation of surface urban heat islands under ideal conditions at night. Part 2. Diagnosis of causation. Boundary-Layer Meteorology 56: 258-339 Rosenfeld AH, Akbari H, Bretz S, Fishman BL, Kurn DM, Sailor D, Taha H (1995) Mitigation of urban
heat islands: materials, utility programs, updates. Journal of Energy and Buildings 22: 255-265 Santamouris M, Papanikolaou N, Koronakis I, Livada I, Asimakopoulos D (1999) Thermal and air flow
characteristics in a deep pedestrian canyon under hot weather conditions. Atmospheric Environment 33: 4503-4521
Shashua-Bar L, Hoffman ME (2000) Vegetation as a climatic component in the design of an urban street. Energy and Buildings 31: 221-235
Shashua-Bar L, Tsiros IX, Hoffman ME (2010) A modeling study for evaluating passive cooling scenarios in urban streets with trees. Case study: Athens, Greece. Building and Environment 45: 2798-2807
Sun CY, Brazel AJ, Chow WTL, Hedquist BC, Prashad L (2009) Desert heat island study in winter by mobile transect and remote sensing techniques. Theoretical and Applied Climatology 98: 323-335 Wilmers F (1991) Effect of vegetation on urban climate and buildings. Energy and Buildings 15(3-4):
國科會補助計畫衍生研發成果推廣資料表
日期:2011/12/31國科會補助計畫
計畫名稱: 運用固定站監測都市街道熱環境之研究 計畫主持人: 孫振義 計畫編號: 99-2221-E-004-006- 學門領域: 建築都巿無研發成果推廣資料
99 年度專題研究計畫研究成果彙整表
計畫主持人:孫振義 計畫編號: 99-2221-E-004-006-計畫名稱:運用固定站監測都市街道熱環境之研究 量化 成果項目 實際已達成 數(被接受 或已發表) 預期總達成 數(含實際已 達成數) 本計畫實 際貢獻百 分比 單位 備 註 ( 質 化 說 明:如 數 個 計 畫 共 同 成 果、成 果 列 為 該 期 刊 之 封 面 故 事 ... 等) 期刊論文 1 0 100% 本 計 畫 部 分 成 果 論 文 「 The observation and analysis of street thermal environment in Taichung」已獲推 薦 刊 登 於 Asian Pacific Planning Review (APPR) 2011 中。 研究報告/技術報告 0 0 100% 研討會論文 2 2 100% 篇 1. 孫振義、李鎨 翰 (2011/05/28) 台 中 街 道 熱 環 境 之觀測解析,中華 民 國 建 築 學 會 第 二 十 三 屆 第 一 次 建 築 研 究 成 果 發 表會,中華民國建 築 學 會 , 中 華 大 學,新竹。 2. 第二篇相關研 究成果論文「街道 環 境 對 於 熱 舒 適 性之影響」,已經 投稿於「2012 年國 土 規 劃 論 壇 研 討 會」中。 論文著作 專書 0 0 100% 申請中件數 0 0 100% 專利 已獲得件數 0 0 100% 件 件數 0 0 100% 件 技術移轉 權利金 0 0 100% 千元 碩士生 1 0 100% 博士生 1 0 100% 國內 參與計畫人力 (本國籍) 博士後研究員 0 0 100% 人次專任助理 0 0 100% 期刊論文 0 0 100% 研究報告/技術報告 0 0 100% 研討會論文 0 0 100% 篇 論文著作 專書 0 0 100% 章/本 申請中件數 0 0 100% 專利 已獲得件數 0 0 100% 件 件數 0 0 100% 件 技術移轉 權利金 0 0 100% 千元 碩士生 0 0 100% 博士生 0 0 100% 博士後研究員 0 0 100% 國外 參與計畫人力 (外國籍) 專任助理 0 0 100% 人次 其他成果
(
無法以量化表達之成 果如辦理學術活動、獲 得獎項、重要國際合 作、研究成果國際影響 力及其他協助產業技 術發展之具體效益事 項等,請以文字敘述填 列。) 另外邀請大學生「連昱棋」共同參與研究。 成果項目 量化 名稱或內容性質簡述 測驗工具(含質性與量性) 0 課程/模組 0 電腦及網路系統或工具 0 教材 0 舉辦之活動/競賽 0 研討會/工作坊 0 電子報、網站 0 科 教 處 計 畫 加 填 項 目 計畫成果推廣之參與(閱聽)人數 0國科會補助專題研究計畫成果報告自評表
請就研究內容與原計畫相符程度、達成預期目標情況、研究成果之學術或應用價
值(簡要敘述成果所代表之意義、價值、影響或進一步發展之可能性)
、是否適
合在學術期刊發表或申請專利、主要發現或其他有關價值等,作一綜合評估。
1. 請就研究內容與原計畫相符程度、達成預期目標情況作一綜合評估
■達成目標
□未達成目標(請說明,以 100 字為限)
□實驗失敗
□因故實驗中斷
□其他原因
說明:
2. 研究成果在學術期刊發表或申請專利等情形:
論文:□已發表 □未發表之文稿 ■撰寫中 □無
專利:□已獲得 □申請中 ■無
技轉:□已技轉 □洽談中 ■無
其他:(以 100 字為限)
本研究成果論文「The observation and analysis of street thermal environment in Taichung」已獲推薦刊登於「Asian Pacific Planning Review (APPR) 2011」期刊中。
3. 請依學術成就、技術創新、社會影響等方面,評估研究成果之學術或應用價
值(簡要敘述成果所代表之意義、價值、影響或進一步發展之可能性)(以
500 字為限)
學術成就 1.據本研究之都市街道溫度觀測數據與環境條件因子之分析,將可在複雜的都市街道峽谷 微氣候條件下釐清影響街道熱環境之關鍵因子。在這初步研究成果之後,更有助於後續深 入研究不同街道寬度、形式、氣候條件之參考,最終尋求最適合台灣本土的街道型態。 2.台灣都市中街道熱環境嚴重的影響者「都市耗電量」與居民的生活「熱舒適度」,因此, 「都市街道熱環境」是一項值得長期研究的課題。本計畫在 1 年的實測與研究中,建立台 灣街道熱環境之基礎數據,以供作為後續街道熱環境研究者之參考依據。 技術創新 為都市街道高溫化的全年逐時情況,本研究於研究區域內將設置若干固定監測站進行氣 溫、濕度實測,並將實測氣溫數據與環境條件進行比對,最終釐清都市街道溫度全年之變 遷及其與氣象因子間之關係。 社會影響 1.提供都市耗能評估相關研究之參考 長久以來都市耗能量解析一直是一件非常重要的研究課題與工作,然而在進行都市耗能量 評估時,若有本研究針對都市街道環境特性所衍生出的耗能量差異數據,有助於更精確的預估都市街廓用電量,並對於電力配置及能源政策有正面的幫助。 2. 提升街道熱舒適性
街道的熱舒適性若可以透過改善或設計手法提升,能夠有效增加居民至戶外活動、步行、 交流之機會。透過本計畫之初步研究成果,提出改善街道熱舒適性的初步建議事項,俾使 都市街道更適合都市居民活動、提升社區意識。