國 立 交 通 大 學
理學院 應用化學系
碩 士 論 文
Department of Applied Chemistry, College of Science
National Chiao Tung University
Master of science degree thesis
Towards the Analysis of Small Molecules
with High Spatial and Temporal Resolution
使用高空間及高時間解析方法應用於
小分子之分析
研 究 生: 李柏翰
Student: Po-Han Li
指導教授: 帕偉鄂本 博士
Advisors: Dr Pawel L. Urban
陳月枝 博士
Dr Yu-Chie Chen
Towards the Analysis of Small Molecules
with High Spatial and Temporal Resolution
使用高空間及高時間解析方法應用於小分子之分析
研 究 生: 李柏翰
Student: Po-Han Li
指導教授: 帕偉鄂本 博士
Advisors: Dr Pawel L. Urban
陳月枝 博士
Dr Yu-Chie Chen
國 立 交 通 大 學 理學院 應用化學系 碩士班
碩 士 論 文
A thesis Submitted to the M.S. progress, Department of Applied Chemistry, College of Science,
National Chiao Tung University, in partial fulfillment of the requirements
for the Degree of Master of Science in Applied Chemistry
July 2012
Hsinchu, Taiwan, Republic of China
使用高空間及高時間解析方法應用於小分子之分析
研 究 生: 李柏翰
指導教授: 帕偉鄂本 博士
陳月枝 博士
國立交通大學應用化學系 碩士班
摘要
在分析化學領域中,發展出具高空間及高時間解析分析方法已成為日益重要的課題, 例如在基質輔助雷射脫附游離質譜影像分析中,提升空間解析有助於將質譜影像到達微 米等級的解析度;而提高時間解析也有利於各種化學動力學之即時偵測與探討。 在本論文中,首先我們發展出一種能應用在基質輔助雷射脫附游離質譜影像分析的 有機無機混合材料奈米粒子。此奈米粒子為含有基質輔助雷射脫附游離質譜基質的矽球, 其表面帶有正電荷,能藉由靜電吸引力吸附在帶有負電荷的生物樣品(藻類)上,接著在 使用氨水蒸汽將奈米粒子中基質輔助雷射脫附游離質譜的基質釋放出來。使用本論文開 發出的奈米粒子配合光徑 10 μm 的紫外光雷射對樣品進行脫附游離,在基質輔助雷射脫 附游離質譜影像分析能達到15 μm 左右的高空間解析度質譜影像結果。 在本論文的第二部份,我們自行組裝出一種能同時進行多點和多探測光源偵測的光學 儀器;利用此光學儀器結合間隔式和連續式進樣法,我們成功達成監控分析物在溶液中 對流情形的線上即時偵測。此外,本論文開發的光學儀器可與電噴灑游離法離子阱質譜 儀進行串聯,接著配合連續式進樣法進樣來監測分析物對流情形,我們也成功的同時利 用本論文所裝設的系統得到吸收光譜和質量分析的線上即時偵測結果。相信本論文開發 出的實驗方法在未來能對自然界很多物理現象的討探會有很好的貢獻。
Towards the Analysis of Small Molecules
with High Spatial and Temporal Resolution
Student: Po-Han Li Advisors: Dr Pawel L. Urban Dr Yu-Chie Chen M. S. progress, Department of Applied Chemistry, National Chiao Tung University
Abstract
Development of analytical methods with high spatial resolution and high temporal resolution has become an important goal in analytical chemistry. For example, matrix-assisted laser desorption/ionization (MALDI) mass spectrometry (MS) enables mapping chemical molecules in two-dimensional samples with a micrometer-range spatial resolution. On the other hand, fast detection techniques are introduced to accommodate the analysis of dynamic chemical systems. In this work, we demonstrate hybrid nanoparticles which can facilitate mass spectrometric imaging at high spatial resolution. The nanoparticles attach to biological specimens (algal cells) due to electrostatic interactions, which is further followed by a controlled release of an organic MALDI matrix in the presence of alkaline vapors of ammonia. Using this method – in conjunction with a MALDI-MS instrument equipped with a 10-µm ultraviolet laser beam – we achieved the spatial resolution of approximately 15 μm. In the second part – in order to preserve temporal resolution – we implemented an on-line sampling system which takes advantage of segmented or continuous flow. The system was used in conjunction with a home-made multi-point multi-wavelength optical detector. The device enabled real-time monitoring of convection currents. The continuous flow sampling, and the optical detector, were readily hyphenated with an electrospray ion-trap mass spectrometer. This enabled online analysis of the low-volume liquid samples collected from the convection vessel – simultaneously – by light absorption and mass spectrometry. We believe that the developments presented here will contribute to new discoveries in natural and physical sciences.
Table of contents
List of tables... V List of figures... VI Acknowledgements... XV Chapter 1. Introduction... 1 1.1. Foreword... 11.2. Matrix-assisted laser desorption/ionization mass spectrometry... 2
1.2.1. Principles of matrix-assisted laser desorption/ionization... 2
1.2.2. MALDI matrix... 3
1.2.3. Time-of-flight mass analyzer... 3
1.2.4. MALDI imaging... 4
1.3. Electrospray ionization mass spectrometry... 4
1.3.1. Principles of electrospray ionization... 4
1.3.2. Ion-trap mass analyzer... 6
1.4. Optical absorption detection... 7
1.5. Segmented flow... 9
1.6. Goals of the work... 11
Chapter 2. Hybrid nanoparticles for mass spectrometric imaging of single cells. 13 2.1. Introduction... 13
2.2. Materials and methods... 14
2.2.1. Materials………...………....….... 14
2.2.2. Synthesis SiO2/9-AA and SiO2 nanoparticles... 14
2.2.3. The controlled release of 9-AA from SiO2/9-AA nanoparticles by alkali. 15 2.2.4. Preparation of algal cells for analysis... 16
2.2.6. MALDI-MS and MALDI imaging... 18
2.3. Results and discussion... 19
2.3.1. Synthesis and initial testing of the hybrid nanoparticles... 19
2.3.2. Evaluation of the controlled matrix release process... 20
2.3.3. Application in the imaging of single cells... 22
2.4. Concluding remarks... 32
Chapter 3. Recording temporal characteristics of convection currents by continuous and segmented-flow sampling... 34
3.1. Introduction... 34
3.2. Materials and methods... 36
3.2.1. Materials... 36
3.2.2. Construction of the flow-through optical detector... 36
3.2.3. Assembly of the three-port Y-junction for generating segmented flow.... 38
3.2.4. Measurements using the system coupled with a mass spectrometer... 38
3.2.5. Measurement of the flow rate in the ESI emitter... 40
3.3. Results and Discussion... 41
3.3.1. Monitoring convection-driven currents by optical detector... 41
3.3.2. Monitoring convection-driven currents by optical detector and mass spectrometer... 47
3.4. Concluding remarks... 50
Chapter 4. Conclusions... 53
List of tables
Table 1.1 Matching the observed and the predicted m/z values after the analysis of
Closterium acerosum cells by negative-ion MALDI-TOF-MS using
9-aminoacridine as matrix, and in the presence of internal calibrants. The internal calibrant mixture contained adenosine triphosphate, guanosine triphosphate, uridine diphosphate glucose, acetyl coenzyme A and bradykinin acetate (each at the concentration of 8.33 × 10⁻⁶ M)... 30
Table 2.1 Measurement of flow rate in the system depicted in Figure 2.1 by weighing aliquots of water eluted from the flow line (Tygon tubing ID 0.13 mm). Preset flow rate: 30 μL min-1
List of figures
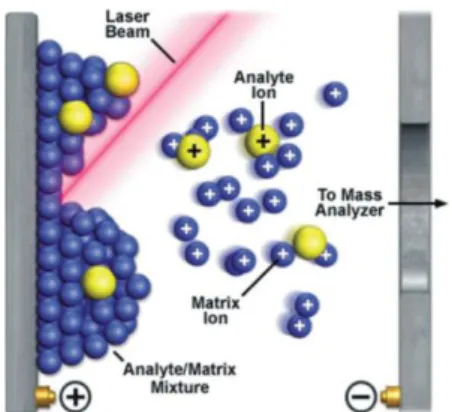
Figure 1.1 The process of desorption/ionization in MALDI. Figure reproduced from from reference 3... 2
Figure 1.2 The principle of MALDI imaging. (A) A sample containing bradykinin acetate ([M+H]+ at m/z 1058.5) is used to write ―Leebo‖ on a MALDI sample plate. (B) Matrix is coated on top of the sample plate. (C) UV laser beam is raster-scanner over the sample. The sampling sites are indicated with red circles. If a site illuminated by the laser beam contains bradykinin acetate, a signal at the m/z 1058.5 (in the positive-ion mode) will be recorded. (D) The spectra collected in (C) are converted to a molecular map depicting the distribution of bradykinin on the plate surface... 5
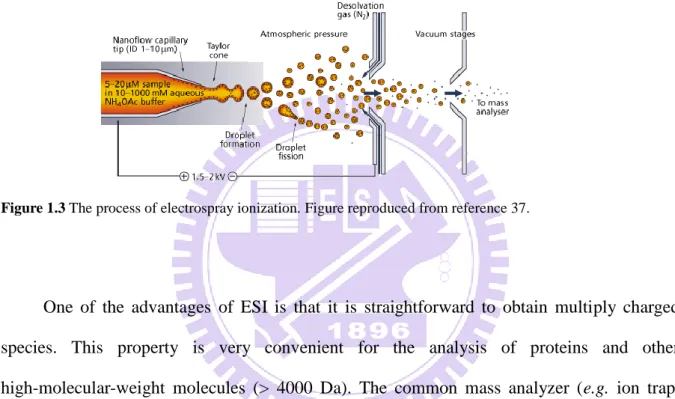
Figure 1.3 The process of electrospray ionization. Figure reproduced from reference 37... 6
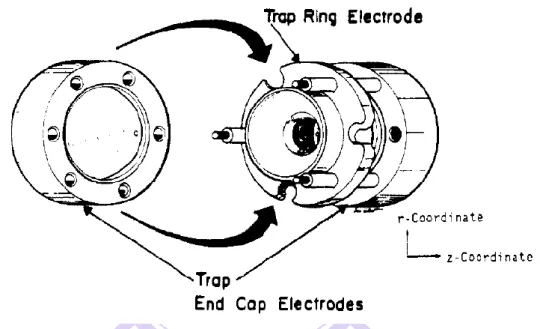
Figure 1.4 The structure in an ion trap. Figure reproduced from reference 41... 7
Figure 1.5 The incident light (P0) passes through a sample; the light beam intensity
after the optical cell is lower than that of the incident light beam (P1 < P0)
which shows that the sample is not completely transparent to light at the wavelength used. The length b is the optical pathlength. The point SP is a sampling point described in section 1.4... 9
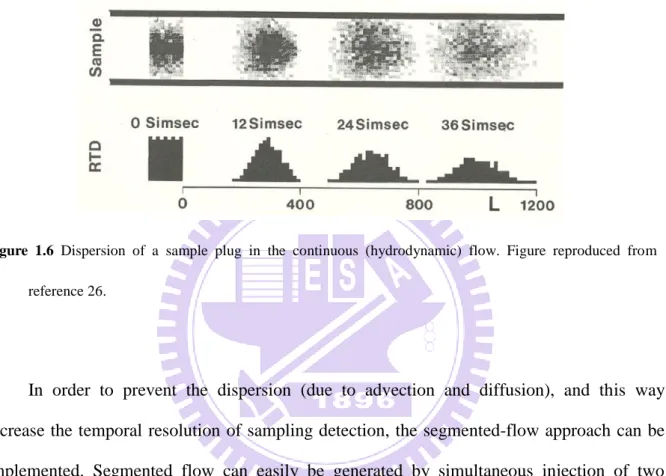
Figure 1.6 Dispersion of a sample plug in the continuous (hydrodynamic) flow. Figure reproduced from reference 26... 10
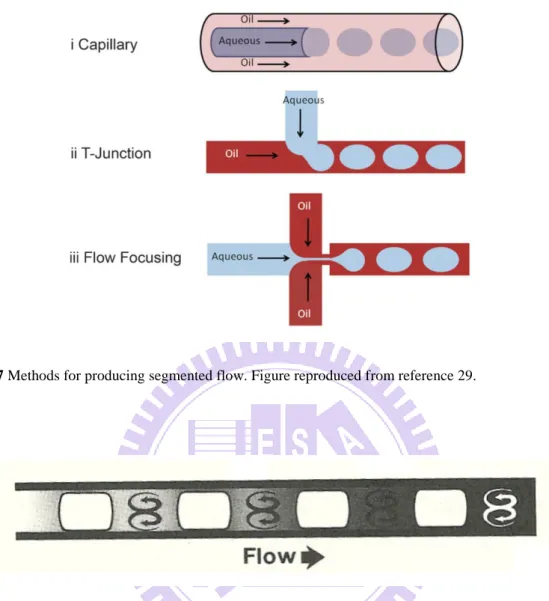
Figure 1.7 Methods for producing segmented flow. Figure reproduced f rom reference 29... 11
Figure 1.8 Separation of individual segments of samples (grey to black) with air bubbles (white) along the flow line; mixing of the transported liquid witin the segments (arrows). Figure reproduced from reference 30... 11
Figure 2.1 Synthesis of the hybrid SiO2/9-AAnanoparticles... 15
Figure 2.2 Preparation of cells for mass spectrometric imaging... 17
Figure 2.3 Setup for the controlled release of 9-AA in the presence of gaseous ammonia... 18
Figure 2.4 Scanning electron micrographs of the hybrid SiO2/9-AA nanoparticles (A
and B) as well as single-component SiO2 nanoparticles (C and D). (A)
SiO2/9-AA nanoparticles (as synthesized). (B) SiO2 nanoparticles
(without 9-AA) synthesized using 3 mL 33% NH3(aq). (C) SiO2
nanoparticles (without 9-AA) synthesized using 4 mL 33% NH3(aq)... 20
Figure 2.5 The effect of ammonia vapors (NH3(g)) on signal intensity and
signal-to-noise (S/N) ratio in MALDI-MS analysis of a chemical standard solution (1 µL) containing adenosine triphosphate (ATP), guanosine triphosphate (GTP), uridine diphosphate glucose (UDP-Glc) and 1,2-dipalmitoyl-sn-glycero-3-[phospho-rac-α-glycerol] (PG) using SiO2/9-AA nanoparticles as matrix. The sample/nanoparticle deposits in
(A) and (C) were not incubated with NH3(g) while the sample/nanoparticle
deposits in (B) and (D) were incubated with NH3(g). Analyte
concentrations in (A and B): ATP, GTP, and UDP-Glc – each 2.5 × 10⁻⁵ M; PG – 3.6 × 10⁻⁵ M. Analyte concentrations in (C and D): ATP, GTP, and UDP-Glc – each 2.5 × 10⁻⁶ M; PG – 3.6 × 10⁻⁶ M. Peak identities: ATP, m/z 506.0; GTP m/z 522; UDP-Glc, m/z 565; PG, m/z 721.5... 21
Figure 2.6 Optical micrographs of dry deposits of different samples on an aluminum plate used as MALDI target: (A) 2 µ L of 1:1 (v/v) mixture of 9 mg mL-1 9-AA solution in acetone and 10-5 M adenosine triphosphate in water; (B) 2 µ L 10-5 M solution of adenosine triphosphate was allowed to dry, followed by deposition of 0.5 µ L suspension of the SiO2/9-AA
nanoparticles (5 mg mL-1). (C) Micrograph showing the edge of the SiO2/9-AA nanoparticle deposit on the aluminum plate (same as in (B)).
Hybrid SiO2/9-AA nanoparticles provide unprecedented homogeneity of
the matrix deposit on the microscopic level (B and C), as compared with the heterogeneous crystalline deposit of 9-AA (A). Scale bars: 200 µm... 22
Figure 2.7 Controlled release of 9-AA in the liquid phase. (A and B) Fluorescence spectra (ex = 400 nm) of supernatants collected from the SiO2/9-AA
nanoparticle suspensions. (A) Leaching 9-AA from the SiO2/9-AA
nanoparticles by addition of 10 µL of 33% NH3(aq) to 200 µL of the 0.5
mg mL-1 nanoparticle suspension in 50% ethanol. The pH of the resulting suspension was 14. (B) Leaching 9-AA from the SiO2/9-AA
nanoparticles with 10 µL of pure water. The black lines in (A) and (B) correspond to the supernatant from the 1st washing step, and the red and blue lines correspond to the supernatants obtained after the 2nd and the 3rd washing step, respectively. (C) Photographs of 0.6-mL microcentrifuge tubes containing SiO2/9-AA nanoparticles – after washing with
NH3(aq)/water, and centrifugation (10000 rpm, 10 min). Note that the
pellets became pale after the treatment with NH3(aq) (C), which indicates
Figure 2.8 Scanning electron micrographs of SiO2/9-AA nanoparticles following
incubation in NH3(aq) solution for 30 min... 24
Figure 2.9 Putative mechanism of the adsorption of SiO2/9-AA nanoparticles on algal
cells, followed by the controlled release of 9-AA... 25
Figure 2.10 Optical and fluorescence micrographs of individual Closterium acerosum
cells with/without SiO2/9-AAnanoparticles. Scale bars: 200 µm... 25
Figure 2.11 Optical and fluorescence micrographs of Anabaena sp. with/without
SiO2/9-AA nanoparticles (0.5 µL, 5 mg mL-1). The fluorescence
micrographs were obtained using two different excitation wavelengths (λex = 510-560 and 330-380 nm – middle and right, respectively). Blue
arrows indicate heterocysts. Scale bars: 50 µm... 26
Figure 2.12 Single-cell MS imaging with SiO2/9-AAnanoparticles used as matrix. (A)
Optical and fluorescence micrographs of a single Closterium acerosum cell with the attached SiO2/9-AA nanoparticles. (B) MALDI mass spectrum of
a single cell of Closterium acerosum – following the occlusion with SiO2/9-AAnanoparticles, and the release of 9-AA induced by gaseous
ammonia. The blank spectrum of SiO2/9-AA nanoparticles shows no peaks
overlapping with the three sample-related peaks (Figure 2.13). (C) Mass spectrometric images of a single cell of Closterium acerosum (same as in (A)). The MS images were obtained in the negative-ion mode by MALDI-time-of-flight (TOF)-MS. Laser beam wavelength: 355 nm; frequency: 50 Hz; diameter: 10 μm; raster spacing: 15 μm. The red-color dashed line in (A) approximately delimits the MS imaging area in (C). Scale bars: 200 µm... 27
Figure 2.13 MALDI mass spectrum of SiO2/9-AA nanoparticles deposited on an
aluminum plate, and incubated with gaseous ammonia (blank). Note that the signal at the m/z: 814.9 – in this blank spectrum – does not completely overlap with the signal at the m/z: 815.5 – recorded when analyzing the sample of Closterium acerosum cells (cf. Figure 2.12)... 28
Figure 2.14 MALDI-MS/MS spectra of the three ions corresponding to the MALDI
images depicted in Figures 2.12 and 2.15: (A) m/z 709.4, (B) m/z 779.5, (C) m/z 815.5. Precursor ions are marked with asterisks (*). The traces in the left-side column represent full m/z-range spectra whereas the traces in the right-side column display the low-m/z range (within the same spectra). The tandem mass spectra were obtained from the samples of Closterium
acerosum (co-crystallized with 9-AA) in the negative-ion mode, using the
laser-induced fragmentation technology (LIFT)... 29
Figure 2.15 Optical and fluorescence micrographs (top) as well as mass spectrometric
images of a single cell of Closterium acerosum (bottom). The fluorescence micrograph (ex = 330-380 nm) shows the presence of
SiO2/9-AA nanoparticles (yellow color) on the cell surface (before the
exposure to gaseous ammonia). MS images were obtained in the negative-ion mode by MALDI-TOF-MS. Laser beam wavelength: 355 nm; frequency: 50 Hz; diameter: 10 μm; raster spacing: 10 μm. Scale bars: 200 µm... 31
Figure 2.16 MALDI-MS imaging of small cell ensembles using Anabaena sp. as a
model. Optical and fluorescence micrographs (top) obtained using two different excitation wavelengths (λex = 510-560 and 330-380 nm – middle
and right, respectively) and MALDI-MS images of Anabaena sp. (bottom) after the treatment with SiO2/9-AA nanoparticles and ammonia
vapors. The MS images were obtained in the negative-ion mode by MALDI-TOF-MS. Laser beam wavelength: 355 nm; frequency: 50 Hz; diameter: 10 μm; raster spacing: 10 μm. The red-color dashed line in approximately delimits the MS imaging area. Scale bars: 100 μm... 32
Figure 3.1 Multi-point multi-wavelength flow-through optical detector. (A) Assembly of the device. (B) Absorbance measurement in an individual channel. Note that only up to 3 channels were used in this study... 37
Figure 3.2 The design of the Y-junction used to generate segmented flow... 39
Figure 3.3 Measurement of the effective flow rate in the fused silica capillary used as ESI emitter. (A) The ESI emitter is installed in the flow line, and the MS is on. (B) The ESI emitter is taken away, and adhesive tape is used to prevent leakage of the liquid medium through the small hole made in the wall of the Tygon tubing... 41
Figure 3.4 Recording convection with segmented and continuous flow. (A) Experimental setup used in the real-time sampling with/without segmented flow prior to detection by the flow-through optical detector (cf.
Figure 3.1). The segmented flow was generated by pushing n-octanol
towards the Y-junction while the bulk of the liquid was withdrawn by a syringe pump at the outlet of the flow line... 42
Figure 3.5 Photograph of the vial (nominal volume: 20 mL) during the convective mixing of 100 μL ferroin with 15 mL water (aided by heating). The ID of capillary used for on-line sampling was 320 µm... 43
Figure 3.6 Convective mixing of ferroin with water followed by segmented flow and flow-through optical detector (cf. Figure 3.1; wavelength: 518 nm). The red line represents the original data while the blue line shows the final data extracted by the custom software. The two traces were shifted vertically for clarity... 44
Figure 3.7 Recording convection with segmented and continuous flow. (A) The output data (red line) obtained with the segmented flow sampli ng (2 replicates). The blue dashed lines correspond to the exponential functions fitted to t he experiment al dat a (after removal of
n-octanol-related features from the trace): a: f(t) = 31 × (1 – e(-0.003t)); b:
f(t) = 52 × (1 – e(-0.003t)). The features marked with asterisks (*) are due to air bubbles. (B) The output data (red line) obtained with the continuous flow sampling (2 replicates). The blue dashed lines correspond to the exponential functions fitted to the raw data: a: f(t) = 27 × (1 – e(-0.003t)); b:
f(t) = 43 × (1 – e(-0.003t))... 45
Figure 3.8 An alternative representation of the data sets displayed in Figure 3.7A and 3.7B (upper graphs). The experimental data points were subtracted with the fitted exponential functions (A: f1(t) = 31 × (1 – e(-0.003x));
B: f2(t) = 27 × (1 – e(-0.003x))). Fluctuations of absorbance due to
Figure 3.9 Sequential convection of two substances with different visible light absorption maxima. (A) Photographs of the vial (nominal volume: 20 mL) filled with 15 mL of water after injection of blue link (three pictures to the left), and ferroin (three pictures to the right). (B,C) Sampling and detection of the vial content by segmented-flow used in conjunction with the home-made optical detector (cf. Figure 3.1). (B) Measurement started after the injection of 100 μL of blue ink (50× diluted original sample). (C) Measurement started after subsequent addition of 100 μL of ferroin sample. The delay time between red/green and green/blue channels is ~ 2.5 s. The raw data have been treated with a custom software in order to eliminate the peaks due to the n-octanol plugs. Traces were shifted vertically for clarity... 48
Figure 3.10 UV/Vis absorption spectra of (A) ferroin (2.8 × 10⁻⁵ M), and (B) blue ink (1000× diluted original solution)... 49
Figure 3.11 Application of the hyphenated system – incorporating the home-made
optical detector (cf. Figure 3.1) and mass spectrometer – in the monitoring of the chemical current due to convection. Nominal volume of the vial volume of the vial is 20 mL. The vial was completely filled with
Figure 3.12 (A,B) Measurement of the relative changes in the concentration of ferroin
in the course of convection. (A) Optical detection; the raw data (red line) were fitted with an exponential function (f(t) = 31 × (1 – e(-0.0035t)), blue line). (B) MS detection; the smoothed data were fitted with an exponential function (f(t) =7.5 × (1 – e(-0.0030t)), blue line). The data acquisition with MS started 132 s after the start of the data acquisition with the optical detector in order to compensate for the dead-volume delay... 51
Acknowledgements
真的好不敢相信!被苦其心智了兩年,終於輪到我畢業了!每每次經過新竹北上交 流道的入口,真的好想衝上去、給他回家算了,但因為火侯不夠,只能就此作罷;現在 被敖出頭,終於拿到衝上北上交流道且一去不復返的資格,準備迎接我的人生第七春。 這一路辛苦下來,要感謝的人真的比我的頭髮還多(我對我頭髮數量相當自豪);首先是 要謝謝我的指導教授帕偉鄂本老師,他跟馬可波羅一樣橫跨了歐亞大陸來台當我的恩師, 對我的實驗、英文和生活方面上真的給我不少的幫助;也感謝陳月枝老師提供我實驗上 的各種幫忙,能讓我的名字出現在數篇 paper 的作者欄上面。接者感謝實驗室同屆的壯 士們(以下照筆畫順序排列):辛苦扛了一年大總管的大包、研所最後日子的好室友肉圓、 同樣被調職的金桔和很愛遊戲王的 Rota。再來也要感謝(以下順序隨機排列):四位訓練 我的啟蒙學長姊大叔、采蓉、喳喳和韓三,能把我實驗技能的底子帶上來;也謝謝曾經 一人扛起實驗室的巴斯還有張大哥、在細胞室幫我上課的家樺學長、在我碩一下加入愛 跳舞的小禿、一樣在我碩一下進來且同樣被調職的傑筆,還有實驗室之後的新血們:翁 小姐的好麻吉書玄、GSH 真的辛苦了的煒茹、同樣來自埔里的丁煦、以後激戰 2 的戰友 凱達、白癡白癡的英鈞、交大地主膝哥、食量超大的量承、頭髮超酷的學長和斯里蘭卡 來的馬蒂,就因為有這群實驗室的好伙伴,我才能被置之死地然後順利後生!當然也要 感謝我的家人們,放家能回家跟爸媽你們聊天真的很開心,還有買了 PS3 的大哥,我回 家後就要跟你搶電動了!再來是快不新鮮的大學新鮮人妹子和內心比外表「成熟」的柏 頡,有了你們我才能好好享受放假回家的愉快生活;而遠從高雄趕來參加我畢業點禮的 奕坦,真的太謝謝妳大老遠來找我和幫我拍碩士服照!也要感謝大學以來的好友們:富 為(在研所孽緣斷不了又當了兩年室友)、登山一哥紅芭樂、愛死橋牌的興遠、愈來愈宋 慧喬的美人、頭髮比我捲的老二、王牌業務阿碩、打仗要靠你了的黑人和小吳的新員工 鴨子,放假能跟你們吃飯聊天真的是我碩所最開心的日子之一。一定要感謝聽我抱怨很 多研所的慘事的小綠,也祝賀妳最後成功達到目標。接著還有發福很多的玄維、順利催 毀魔戒並回到夏爾的小潘、當初帶我入門二胡的色長旻傑、在中研院奮鬥的妙妙、在原 分所辛苦做實驗的大雯、國中同學跟研所同校的國峯、高中同學研所也同校的偉振,感 謝你們在我這兩年生活的陪伴;還有感謝系辦幫忙我很多的明君、淑芬和小阿姨小姐們; 最後也要感謝這兩年很照顧的我長輩們:中央 TEM 第一把腳椅翁小姐、清夜的果汁阿 姨和蔥抓餅阿姨、博愛校區那的饅頭肉排蛋老闆娘、看到我會自動拿大餅和水煎包的素 食老闆還有前交大素食部的老闆等等等。沒事再順便感謝一下陪我渡過口試前一天的蝙 蝠俠、吸血鬼和狼人們。我能順利念完研所,要感謝的人真的是太多了,沒有你們我真 的不知能不能撐下去,總之,謝謝謝謝謝謝謝謝謝大家!!感謝國科會提供實驗經費和 國立交通大學幫助添購 ESI-MS 讓我能順利完成研究。Chapter 1
Introduction
1.1...Foreword
In many studies related to chemistry, biology, or medicine, it is necessary to investigate chemical composition of complex samples. For this reason, it is not surprising that hundreds of analytical instruments and methods have been developed over the past two centuries; they are based on various concepts, including chromatography, optical spectroscopy, electrochemistry, as well as mass spectrometry (MS). Using these analytical platforms, one can nowadays identify and quantify a large variety of analytes.
During the last decade, spatial and temporal resolutions have become increasingly important features of analytical techniques. For example, using matrix-assisted laser desorption/ionization (MALDI)-MS imaging, one can study distributions of chemical molecules on sample surfaces. Such analyses can provide high-quality molecular images. Nowadays efforts are made to increase the spatial resolution in molecular imaging, and thus provide the possibility of mapping chemical compositions of biological samples on the microscopic level.
Chemical analysis performed in real time is also an important topic in modern chemistry. High temporal resolution is a significant ―added value‖ in the analytical measurements. One way to preserve temporal resolution is to digitize bulk samples collected from the environment by aliquoting them into micro- or sub-micro-liter volume segments. This can prevent longitudinal diffusion and dispersion of the digitized solutions along the flow line. In
fact, segmented-flow systems have widely been used in analytical chemistry, and this approach is very promising for coupling dynamic chemical systems with various detection techniques.
1.2...Matrix-assisted laser desorption/ionization mass spectrometry
1.2.1...Principles of matrix-assisted laser desorption/ionization
The matrix-assisted laser desorption/ionization is a technique which enables desorption of analytes adsorbed on flat conductive targets, and simultaneous ionization in the gas phase prior to separation in the mass analyzer.1 The original concept of MALDI was demonstrated by Dr Franz Hillenkamp.2 In the course of sample preparation for MALDI-MS, samples are typically mixed and co-crystallized with a chemical matrix, which can absorb the ultraviolet (UV) laser light (Figure 1.1). The most common wavelengths used for this purpose are 337 nm (nitrogen laser) and 355 nm (Nd-YAG laser). When the UV laser light impinges onto the crystalline deposit of the MALDI matrix with the sample, the ionization (e.g. protonation, deprotonation) of analyte molecules may occur. The gas-phase ions are then injected to the mass analyzer in order to determine their mass-to-charge (m/z) ratios. MALDI-MS has widely been used in the analysis of small organic molecules, peptides, proteins and synthetic polymers.1
1.2.2...MALDI matrix
There are numerous kinds of MALDI matrices. Different matrices are suitable for the ionization of different analyte molecules: for example, in the positive-ion mode, 2,5-dihydroxy benzoic acid (2,5-DHB) is often used in the analysis of peptides4,5 while 3,5-dimethoxy-4-hydroxycinnamic acid (sinapinic acid, SA) is used in the analysis of proteins.6,7,8 In the negative-ion mode, 9-aminoacridine (9-AA) is often used in the analysis of nucleotides and lipids9,10,11 When the solvent of the matrix/sample mixture evaporates, a crystalline deposit remains on the sample plate. The crystallization pattern is usually far from homogeneous. This contributes to the so-called ―sweet-spot effect‖;12 due to the heterogeneous/chaotic crystallization of the matrix and the analytes, some locations of the MALDI spots give rise to high signals while the other locations mostly contribute to the spectral noise. In the conventional qualitative use of MALDI-MS, the ―sweet-spot effect‖ does not affect the results to a great extent because one can still record high-quality spectra, and identify the molecules producing peaks with satisfactory signal-to-noise (S/N) ratios. However, in the case of MALDI imaging, the ―sweet-spot effect‖ may significantly deteriorate the quality of the MS images, decrease the spatial (lateral) resolution, and contribute to artifacts. When using inorganic particles or surfaces as matrices in the so-called ―surface-assisted laser desorption/ionization mass spectrometry (SALDI-MS)‖,13
the problem of heterogeneous crystallization is mitigated.14
1.2.3...Time-of-flight mass analyzer
Time-of-flight (TOF) is the most common mass analyzer used in MALDI-MS.15 The gas-phase ions are accelerated in an electric field, and shifted to the TOF tube. As the ions move in the TOF tube, all of the them have the same kinetic energy but different velocities. The analyte ions with smaller m/z will move faster and reach the detector first, while the ions with higher m/z will reach the detector later. Finally, the m/z values can be calculated based
on the time elapsed during the migration of the ions from the source to the detector.
1.2.4...MALDI imaging
One of the important applications of MALDI-MS is MALDI imaging. In fact, MALDI imaging has widely been used to investigate chemical distributions of lipids, proteins, and small molecules, within biological specimens.16-20 In order to obtain a MALDI image, the UV laser beam needs to be raster-scanned over the sample surface (pre-coated with a MALDI matrix), spectra recorded at each of the sampling positions and then converted to molecular images of the sample surface (for an example, see Figure 1.2). Usually this is done by plotting the intensities of the selected peaks (often following a normalization step) as two-dimensional maps, in which the saturation level corresponds to the signal intensity.
As pointed out above, sample preparation is crucial for achieving high spatial resolution in MALDI imaging. In particular, it is very important that the whole sample surface is evenly coated with the MALDI matrix. Several methods have been proposed for coating specimens with MALDI matrices, and some of them can provide relatively high spatial resolutions; they include coating with a pneumatic spray, electrospray deposition (for reviews, see refs 16, 17, 21),and matrix sublimation/recrystallization method.22-24 In this work, we demonstrate a new type of matrix coating method, which takes advantage of hybrid nanoparticles (used as a matrix carrier) in order to record MALDI images of single cells.
1.3...Electrospray ionization mass spectrometry
1.3.1...Principles of electrospray ionization
The electrospray ionization (ESI) is an atmospheric pressure ionization method, used to produce gas-phase ions, which are subsequently analyzed by mass spectrometry. This ingenious approach was developed by Dr. John Fenn. In this technique,35 the samples are delivered in liquid phase, typically dissolved in water or organic solvents (e.g. acetonitrile or
Figure 1.2 The principle of MALDI imaging. (A) A sample containing bradykinin acetate ([M+H]+ at m/z 1058.5) is used to write ―Leebo‖ on a MALDI sample plate. (B) Matrix is coated on top of the sample plate. (C) UV laser beam is raster-scanner over the sample. The sampling sites are indicated with red circles. If a site illuminated by the laser beam contains bradykinin acetate, a signal at the m/z 1058.5 (in the positive-ion mode) will be recorded. (D) The spectra collected in (C) are converted to a molecular map depicting the distribution of bradykinin on the plate surface.
methanol). A common way to apply samples is by using syringe pump connected to a capillary emitter mounted at the outlet of the flow line. For the electrospray process, it is also necessary to apply a potential difference between the electrospray emitter and a counterelectrode (typically the orifice of the mass spectrometer, Figure 1.3). The Taylor cone and jets are then formed at the outlet of the emitter, which is followed by the detachment of charged microdroplets.36 Desolvation of the microdroplets takes place as they advance towards the inlet of the mass spectrometer. When the so-called ―Rayleigh limit‖ is reached,
the Coulombic repulsion force is higher than the surface tension within a droplet, and the droplet splits into smaller ones.36 Combined with continuous evaporation of the solvent, this process will eventually lead to the formation of singly or multiply charged analyte species in the gas phase. The mass-to-charge ratios (m/z) are subsequently determined in the mass analyzer.
Figure 1.3 The process of electrospray ionization. Figure reproduced from reference 37.
One of the advantages of ESI is that it is straightforward to obtain multiply charged species. This property is very convenient for the analysis of proteins and other high-molecular-weight molecules (> 4000 Da). The common mass analyzer (e.g. ion trap, quadrupole) have a relatively low m/z limit 4000 Da; however, the multiply charged biomolecules with high molecular weight may still fall within the operational m/z range of the mass spectrometer.38 It is also very convenient to couple the ESI-MS instruments with different types of separation systems. For example, it is quite common to hyphenate liquid chromatography (LC)39 or capillary electrophoresis (CE)40 with ESI-MS in order to perform on-line analysis.
1.3.2...Ion-trap mass analyzer
The ion trap is a mass analyzer which can trap the ions within a three-dimensional space. It commonly incorporates a ring electrode and two metal end-cap electrodes (Figure 1.4).
When the analyte ions enter the ion trap, a radio-frequency (RF) and direct current (DC) voltage applied to the electrode, contribute to trapping the ions with specific m/z, which at certain conditions will move along a stable orbit. After gas-phase ions are trapped in the analyzer, they be can ejected to the detector by increasing the amplitude of RF voltage applied to the ring electrode (stability limit ejection method), or end caps (resonant ejection method). It will cause the ions with a specific m/z leave the trapping region from the z direction (Figure
1.4), and move towards the detector.42
Figure 1.4 The design of an ion trap. Figure reproduced from reference 41.
1.4...Optical absorption detection
When a light beam impinges on a semi-transparent sample, some of the light is absorbed. For example, if a solution has red color, it absorbs light in the wavelength range ~ 380-560 nm, while red light (~ 590-740 nm) will be transmitted or reflected from such sample. This simple example gives a reason why many liquid solutions in our surrounding have a color. The phenomenon of the absorption of light is described by the absorption laws outlined below.
When a light beam with the intensity P0 is shone onto a liquid sample, a fraction of
photons will be absorbed but some light will be transmitted (Figure 1.5). If we denote the intensity of the transmitted light as P1, we can then define the value of transmittance (T) as the
ratio:
T = P1/P0 (1)
The transmittance can readily be converted to absorbance (A) by using the logarithmic expression:
A = -log T = log (P0/P1) (2)
The higher the absorbance, the less light has been transmitted through the sample. Since the measured absorbance is affected by the optical pathlength, and the concentration of the analyte, the following expression is valid:
A = ε b c (3)
where b is the optical pathlength, c is the concentration of the analyte solution and ε is the molar absorptivity. The equation 3 is referred to as the Beer-Lambert law (or Beer’s law).25 From the equation 3 it is clear that an increase of the optical pathlength (b), as well as the concentration of the analyte (c), will be accompanied by an increase of the absorption of light within the sample of the solution under analysis. The Beer-Lambert law has widely been used in quantitative analysis. Since the absorption of light is directly related to the concentration of an analyte, we can fix the optical pathlength (i.e. use the same vial/cuvette), and measure absorbances of samples with different concentrations of this analyte.
Figure 1.5 The incident light (P0) passes through a sample; the light beam intensity after the optical cell is lower than that of the incident light beam (P1 < P0) which shows that the sample is not completely transparent to light at the wavelength used. The length b is the optical pathlength. The point SP is a ―sampling point‖ (see section 1.5)
1.5...Segmented flow
It should be pointed out that the optical absorption spectroscopy, characterized by equations 1-3 is generally applied to homogeneous solutions. If a solution is not homogeneous, applying the detection strategy depicted in Figure 1.5 will give us information on the average absorbance of the sample along the illumination axis. If one wants to measure the absorbance at one location of a three-dimensional vessel (for example, point SP in Figure 1.5), an alternative detection strategy has to be implemented.
A very simple way to obtain such information — which is further elaborated in chapter 3 — would be to probe the contents of the sample vessel into a thin tubing (e.g. capillary), and subsquently transfer the collected samples to a detector. This method allows one to collect samples at a given point of the three-dimensional space (e.g. point SP in Figure 1.5), and measure the absorbance of the medium in the corresponding microenvironment. However,
transferring samples along capillaries (from the inlet towards the detector) by hydrodynamic flow can contribute to significant dispersion (Figure 1.6), and this way decrease the temporal resolution and sensitivity of the measurement.
Figure 1.6 Dispersion of a sample plug in the continuous (hydrodynamic) flow. Figure reproduced from
reference 26.
In order to prevent the dispersion (due to advection and diffusion), and this way increase the temporal resolution of sampling detection, the segmented-flow approach can be implemented. Segmented flow can easily be generated by simultaneous injection of two immiscible fluids (two liquids or liquid/gas) into a capillary or a microfluidic channel (Figure
1.7).27-29 Mixing occurs mainly within the samples encapsulated in each droplet (Figure 1.8), while the longitudinal dispersion/diffusion and carry-over effect are reduced.30,31
After the sampling, the plugs can readily be transported towards the optical absorption detector, and the Beer-Lambert law can be used to determine the absorbance of each droplet collected at point SP (cf. Figure 1.5). This sampling method may potentially enhance the temporal resolution of analysis conducted by optical absorption detection, and other platforms.32-34
Figure 1.7 Methods for producing segmented flow. Figure reproduced from reference 29.
Figure 1.8 Separation of individual segments of samples (grey to black) with air bubbles (white) along the flow
line; mixing of the transported liquid witin the segments (arrows). Figure reproduced from reference 30.
1.6...Goals of the work
In this work, we were aiming to develop two analytical methods, one preserving spatial resolution, and the other one preserving temporal resolution.
The goal of the first study was to develop a new type of MALDI matrix, based on hybrid nanopatricles, which would enable performing MALDI imaging of single cells at a high spatial resolution.
The goal of the second study was to develop a method useful in the monitoring of heterogeneous dynamic chemical systems while preserving temporal resolution. The method should accommodate optical as well as mass spectrometric detection.
Chapter 2
Hybrid nanoparticles for mass spectrometric imaging
of single cells
2.1...Introduction
As outlined in section 1.2, Matrix-assisted laser desorption/ionization (MALDI) is an analytical technique in which laser light is used to desorb and ionize molecules – previously co-crystallized with a chemical matrix – to enable mass spectrometric (MS) detection of the resulting gas-phase ions.1,2 One of the interesting features of this technique is the possibility of mapping chemical distributions of analytes in biological specimens. In fact, MALDI-MS has widely been used for mapping lipids,43-45 proteins,46-48 and small molecules49-51 in the samples such as tissues or single cells.17,20,23,52-54 Examples of powerful chemical matrices used in MALDI include α-cyano-4-hydroxycinnamic acid (CHCA), 2,5-dihydroxybenzoic acid (2,5-DHB), and 9-aminoacridine (9-AA). Before analysis, concentrated solution of a selected chemical matrix is applied onto the surface of the biological sample. The biggest nuisance in MALDI imaging is the heterogeneous crystallization of MALDI matrices on the sample surface, which considerably decreases lateral resolution of the resulting images, and often disables the possibility of performing single-cell studies. Homogeneous and reproducible application of MALDI matrices is critical for obtaining high-quality results using this technique.
Here we demonstrate a new type of hybrid inorganic-organic nanomaterial which enables in-situ delivery of a chemical matrix for mass spectrometric imaging with high lateral
resolution. Application of the hybrid matrix to biological specimens poses less threat to the experimenters and the environment since the toxic matrix compound does not need to be sprayed by using a gas-powered sprayer, which could lead to the contamination of the laboratory environment with toxic aerosols. The hybrid nanomaterial binds to the surface of the cells while still in the liquid phase, which is followed by a controlled release of the organic matrix molecules trigerred by alkaline vapors delivered to the specimen in a closed chamber.
2.2...Materials and methods
2.2.1...Materials
Acetyl coenzyme A, adenosine triphosphate, 9-aminoacridine (9-AA), ammonium hydroxide (33% solution), bradykinin acetate, guanosine triphosphate, tetraethoxysilane (TEOS), and uridine diphosphate glucose were purchased from Sigma-Aldrich (St. Louis, USA). 1,2-Dipalmitoyl-sn-glycero-3-[phospho-rac-1-glycerol] was purchased from Avanti Polar Lipids (Alabaster, USA). Ethanol was purchased from Echo Chemical (Miaoli, Taiwan). Water (18.2 MΩ·cm at 25 °C) was obtained from a Milli-Q water purification system (Merck Millipore, Billerica, USA). Indium tin oxide (ITO) glass slides were purchased from Bruker Daltonics (Part No. 237001; Bremen, Germany). Aluminum plate (thickness: 200 μm) was obtained from a local supplier and cut into small pieces in house.
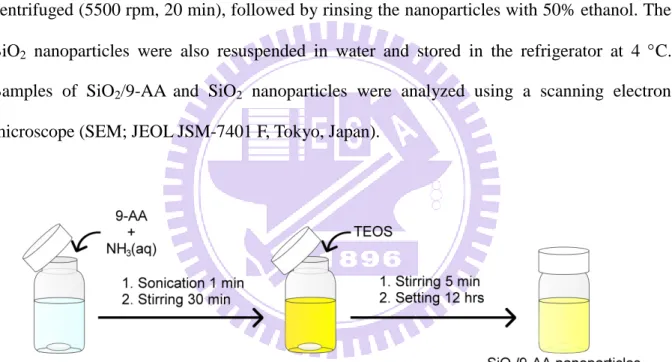
2.2.2...Synthesis of SiO
2/9-AA and SiO
2nanoparticles
In order to synthesize SiO2/9-AAnanoparticles, 54.4 mg of 9-AA and 97 µL of 33%
NH3(aq) solution were mixed with 15.25 mL 50% ethanol solution (Figure 2.1). The mixture
was sonicated until almost all 9-AA crystals were dissolved, and saturation of the solution with 9-AA was reached. The mixture was further stirred for 30 min, and 117.3 µL of TEOS were subsequently added. Stirring continued for 5 min, and the suspension was then left to
settle for 12 h. The color of the resulting suspension was bright-yellow. The as-prepared SiO2/9-AA nanoparticle suspension was centrifuged (5500 rpm, 20 min). The SiO2/9-AA
nanoparticles were recovered from the pellet, and they were rinsed with 50% ethanol. After that, they were resuspended in water and stored in the refrigerator at 4 C.
To synthesize SiO2 nanoparticles (without 9-AA), 3 mL of 30% ammonia solution were
mixed with 7.63 mL 99.5% ethanol and 6.13 mL water. The mixture was further stirred for 30 min, and 117.3 µL of TEOS were added. Stirring continued for 5 min, and the product suspension was left to settle for 12 h. The as-prepared SiO2 nanoparticle suspension was
centrifuged (5500 rpm, 20 min), followed by rinsing the nanoparticles with 50% ethanol. The SiO2 nanoparticles were also resuspended in water and stored in the refrigerator at 4 C.
Samples of SiO2/9-AA and SiO2 nanoparticles were analyzed using a scanning electron
microscope (SEM; JEOL JSM-7401 F, Tokyo, Japan).
Figure 2.1 Synthesis of the hybrid SiO2/9-AAnanoparticles.
2.2.3...The controlled release of 9-AA from SiO
2/9-AA nanoparticles by
alkali
In order to demonstrate the feasibility of the controlled release of the 9-AA MALDI matrix from the SiO2/9-AA nanoparticles, 200 µL (an equivalent of 0.5 mg mL-1) of
SiO2/9-AA nanoparticle suspension in 50% ethanol solution was prepared. Subsequently, an
centrifuged at 10000 rpm for 10 min. The supernatant was diluted 100× with 50% ethanol, and used as a sample to obtain the fluorescence spectra by FluoroMax-3 spectrofluorometer (Horiba Jobin Yvon, Edison, USA). The excitation wavelength was set to 400 nm, and the emission spectrum was recorded in the wavelength range of 410-600 nm.
In another experiment – which was designed to demonstrate the controlled release of MALDI matrix – an aliquot of 200 µL 33% NH3(aq)) was mixed with 200 µL (an equivalent
of 5 mg mL-1) SiO2/9-AA suspension, and stirred for 30 min. An aliquot of 200 µL of 95.5%
ethanol was subsequently added to solubilize the 9-AA matrix released from the SiO2/9-AA
nanoparticles. The suspension of the residue nanoparticles was then centrifuged at 10000 rpm for 10 min, and the pellet fraction containing nanoparticles (after 9-AA release) was re-suspended in 100 µL of pure water. The suspension was then spotted onto an SEM target, and imaged by SEM.
2.2.4...Preparation of algal cells for analysis
The protocol used to prepare single cells of Closterium acerosum (Carolina Biological Supply Company, Burlington, USA) for analysis is outlined in Figure 2.2. Initially, 0.5 mL of the cell suspension was mixed with 1.5 mL of water, and the resulting suspension was centrifuged at 2000 rpm for 5 min. The supernatant was removed, and the pellet was resuspended in 100 µL of water. A droplet of the resulting dilute suspension of cells was placed in a Petri dish, and several (~ 5) cells were picked up using a micropipette. Cells were washed several times by subsequent transfers into 2-µL droplets of fresh water. A small amount of the suspension of SiO2/9-AA nanoparticles(2 µL, 5 mg mL-1) was pipetted onto the
cells, and the excess suspension of the nanoparticles was quickly removed by pipetting. The unbonded SiO2/9-AA nanoparticles were subsequently washed away with water. Finally, 2 µL
of water were used to re-suspend the cells, and transfer them onto an aluminum plate. The optical and fluorescence images were captured using an upright fluorescence microscope
(Eclipse 80i; Nikon, Yokohama, Japan) fitted with a digital camera (DS-Ril; Nikon, Tokyo, Japan). Fluorescence images were obtained using the excitation filters: UV-2A (ex = 330-380
nm) and G-2A (ex = 510-560 nm)
Figure 2.2 Preparation of cells for mass spectrometric imaging.
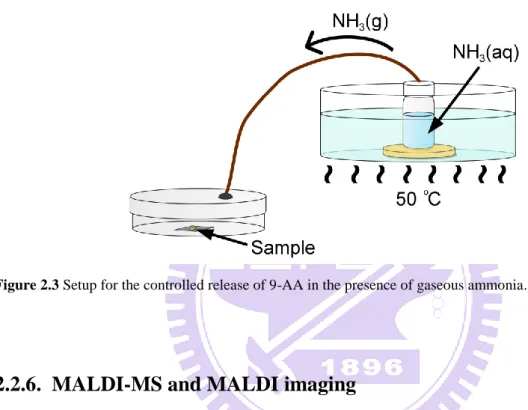
2.2.5...Controlled release of 9-AA by exposure to ammonia vapors
In order to induce the controlled release of 9-AA from the SiO2/9-AA nanoparticles by
exposure to ammonia vapors, a simple incubation system was constructed (Figure 2.3). A hole was drilled in the lid of a plastic Petri dish; one side of a silicon tube (length, 40 cm; ID, 2 mm, OD, 4 mm) was slid through that hole, and epoxy glue was used to seal the junction. The other side of the silicon tube was passed through the rubber septum mounted on the top of a 20-mL glass vial acting as the ammonia-vapor generator. The vial was filled with ~15 mL 33% NH3(aq) solution and placed in a water bath set to 50 C. The release of ammonia vapors
the incubation chamber. An aluminum target with the sample (algal cells pre-coated with the SiO2/9-AA nanoparticles) was incubated inside the Petri dish containing ammonia vapors for
30 min. Parafilm was used to seal the slit in between the top and bottom parts of the Petri dish, thus to prevent possible escape of gaseous ammonia from the system.
Figure 2.3 Setup for the controlled release of 9-AA in the presence of gaseous ammonia.
2.2.6...MALDI-MS and MALDI imaging
For MALDI-MS detection and MALDI imaging experiments, we used the Autoflex III Smartbeam instrument (Bruker Daltonics) fitted with a solid-state laser (λ = 355 nm). The settings of this instrument were as follows: negative ion mode, ion source 1, -19 kV; ion source 2, -16.7 kV; lens, -9 kV; delay time, 0 ns. During the MALDI imaging routine, the laser beam was focused to 10 μm, the scan raster was set to 10-15 µm (in different experiments), and 35 laser shots were fired at every raster point at a frequency of 50 Hz. The mass range was set to 300-1100 Da, and a cut-off limit of 300 Da was applied. Data were acquired using the flexControl software (version 3.0; Bruker Daltonics). The MALDI imaging data were collected and viewed using the flexImaging software (version 2.0; Bruker Daltonics).
2.3...Results and discussion
2.3.1...Synthesis and initial testing of the hybrid nanoparticles
It is known that hybrid inorganic-organic materials can be synthesized using the sol-gel reaction system.55,56 For example, Laperriere et al.57 doped 9-AA into glass produced in the course of a sol-gel process. In the present work, we have made an attempt to synthesize SiO2/9-AA nanoparticles with the prospect of using them as a matrix suitable for
high-spatial-resolution MALDI imaging (Figure 2.1). To achieve this goal, we substituted a fraction of the alkaline component (NH3(aq)) of the sol-gel synthesis process with 9-AA. This
yielded a suspension of hybrid nanoparticles with the inorganic framework of SiO2, and the
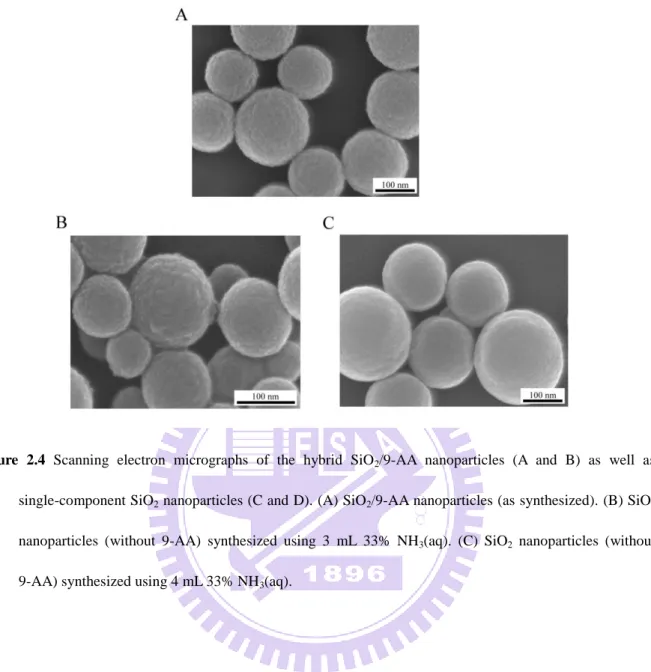
organic filling of 9-AA. Figure 2.4 presents scanning electron micrographs of the resulting hybrid SiO2/9-AA nanoparticles as well as SiO2 nanoparticles (without 9-AA). On the
nanoscopic level, the nanoparticles loaded with 9-AA resemble those without 9-AA, however the hybrid nanomaterial has yellow color due to the presence of the 9-AA ―cargo‖. Since the active MALDI matrix compound (9-AA) is embedded within the inorganic structure of SiO2,
at this stage, the as-prepared hybrid nanomaterial does not yet fulfill the function of MALDI matrix: MALDI-MS detection of four standard compounds mixed with this nanomaterial gave poor results (Figures 2.5A and 2.5C). However, following the release of 9-AA in a chamber saturated with gaseous ammonia (Figure 2.3), the recorded MS signals were very high (Figures 2.5B and 2.5D). We have also noticed that – unlike most conventional MALDI matrices – the SiO2/9-AA nanoparticles form an extremely homogeneous layer on the MALDI
target, without almost any signs of heterogeneous crystallization (Figure 2.6). This can facilitate application of the matrix by simple incubation of the hybrid nanoparticles suspended in an aqueous solution – compatible with biological specimens.
Figure 2.4 Scanning electron micrographs of the hybrid SiO2/9-AA nanoparticles (A and B) as well as single-component SiO2 nanoparticles (C and D). (A) SiO2/9-AA nanoparticles (as synthesized). (B) SiO2 nanoparticles (without 9-AA) synthesized using 3 mL 33% NH3(aq). (C) SiO2 nanoparticles (without 9-AA) synthesized using 4 mL 33% NH3(aq).
2.3.2...Evaluation of the controlled matrix release process
The controlled release process was further studied in a series of experiments: in one of them, we suspended the SiO2/9-AA nanoparticles in 50% ethanol, added 33% NH3(aq), and
stirred the resulting suspension for 5 min, centrifuged, and measured the fluorescence of the supernatant (Figure 2.7A). Fluorescence intensity of the supernatant decreased in the subsequent washing steps using NH3(aq) as the washing solvent. In another test, pure water
was used instead of NH3(aq) as the washing solvent; in this case, fluorescence intensity of the
supernatant did not decrease as much as when using NH3(aq) (Figure 2.7B). In addition, after
Figure 2.5 The effect of ammonia vapors (NH3(g)) on signal intensity and signal-to-noise (S/N) ratio in MALDI-MS analysis of a chemical standard solution (1 µL) containing adenosine triphosphate (ATP), guanosine triphosphate (GTP), uridine diphosphate glucose (UDP-Glc) and 1,2-dipalmitoyl-sn-glycero-3-[phospho-rac-α-glycerol] (PG) using SiO2/9-AA nanoparticles as matrix. The sample/nanoparticle deposits in (A) and (C) were not incubated with NH3(g) while the sample/nanoparticle deposits in (B) and (D) were incubated with NH3(g). Analyte concentrations in (A and B): ATP, GTP, and UDP-Glc – each 2.5 × 10⁻⁵ M; PG – 3.6 × 10⁻⁵ M. Analyte concentrations in (C and D): ATP, GTP, and UDP-Glc – each 2.5 × 10⁻⁶ M; PG – 3.6 × 10⁻⁶ M. Peak identities: ATP, m/z 506.0; GTP m/z 522; UDP-Glc, m/z 565; PG, m/z 721.5.
Figure 2.6 Optical micrographs of dry deposits of different samples on an aluminum plate used as MALDI
target: (A) 2 µL of 1:1 (v/v) mixture of 9 mg mL-1 9-AA solution in acetone and 10-5 M adenosine triphosphate in water; (B) 2 µL 10-5 M solution of adenosine triphosphate was allowed to dry, followed by deposition of 0.5 µL suspension of the SiO2/9-AA nanoparticles (5 mg mL-1 in water). (C) Micrograph showing the edge of the SiO2/9-AA nanoparticle deposit on the aluminum plate (same as in (B)). Hybrid SiO2/9-AA nanoparticles provide unprecedented homogeneity of the matrix deposit on the microscopic level (B and C), as compared with the heterogeneous crystalline deposit of 9-AA (A). Scale bars: 200 µm.
consecutive wash steps with NH3(aq), the supernatant was clear, and the amount of pellet was
less than in the control series without NH3(aq); this is due to the fact that some of the SiO2
material got dissolved in the alkaline solution (cf. scanning electron micrograph in Figure
2.8). These results prove that the structure of the hybrid SiO2/9-AA nanoparticles is degraded
in the alkaline environment (NH3(aq)), and this degradation process is accompanied by the
release of 9-AA.
2.3.3...Application in the imaging of single cells
Equipped with the controlled release hybrid SiO2/9-AA nanoparticles, we further aimed
to apply this material as a matrix in the mass spectrometric imaging of microscopic specimens such as single cells. As a model sample, we selected unicellular algae – Closterium acerosum.
Figure 2.7 Controlled release of 9-AA in the liquid phase. (A and B) Fluorescence spectra (ex = 400 nm) of supernatants collected from the SiO2/9-AA nanoparticle suspensions. (A) Leaching 9-AA from the SiO2/9-AA nanoparticles by addition of 10 µL of 33% NH3(aq) to 200 µL of the 0.5 mg mL-1 nanoparticle suspension in 50% ethanol. The pH of the resulting suspension was 14. (B) Leaching 9-AA from the SiO2/9-AA nanoparticles with 10 µL of pure water. The black lines in (A) and (B) correspond to the supernatant from the 1st washing step, and the red and blue lines correspond to the supernatants obtained after the 2nd and the 3rd washing step, respectively. (C) Photographs of 0.6-mL microcentrifuge tubes containing SiO2/9-AA nanoparticles – after washing with NH3(aq)/water, and centrifugation (10000 rpm, 10 min). Note that the pellets became pale after the treatment with NH3(aq) (C), which indicates the 9-AA had been leached from the SiO2/9-AA nanoparticles.
Figure 2.8 Scanning electron micrographs of SiO2/9-AA nanoparticles following incubation in NH3(aq) solution for 30 min.
This species has rod-shaped cells (~ 350 × 40 µm). Since cell wall in algal cells is rich in anion-forming biomolecules (e.g. galacturonic acid – a component of pectin),58 the SiO2/9-AA
nanoparticles can readily attach onto the outer surface of the cell due to electrostatic interactions (Figure 2.9). Figure 2.10 presents optical and fluorescence micrographs of individual C. acerosum cells with/without SiO2/9-AA nanoparticles. Red fluorescence
originates from the natural dyes present in the cell, while yellow fluorescence originates from SiO2/9-AA nanoparticles attached onto the cell surface. We also tested the new matrix with
another species of algae – Anabaena sp.: also in this case, the SiO2/9-AA nanoparticles
readily attached to the outer surface of the cells (Figure 2.11). We noted that, following the incubation with the SiO2/9-AA nanoparticles, heterocysts of Anabaena sp. – which normally
do not fluoresce at the ex = 330-380 nm – started to fluoresce with blue light. One can
speculate the cell wall in heterocysts contains more anionic components which can bind a greater amount of the SiO2/9-AA nanoparticles, as compared with the photosynthesizing cells.
Following the treatment of C. acerosum cells with SiO2/9-AA nanoparticles (Figures
Figure 2.9 Putative mechanism of the adsorption of SiO2/9-AA nanoparticles on algal cells followed by the controlled release of 9-AA.
Figure 2.10 Optical and fluorescence micrographs of individual Closterium acerosum cells with/without
Figure 2.11 Optical and fluorescence micrographs of Anabaena sp. with/without SiO2/9-AA nanoparticles (0.5 µL, 5 mg mL-1). The fluorescence micrographs were obtained using two different excitation wavelengths (λex = 510-560 and 330-380 nm – middle and right, respectively). Blue arrows indicate heterocysts. Scale bars: 50 µm.
MALDI-MS to obtain spectra of single cells. Figure 2.12B shows a mass spectrum of C.
acerosum with three high signals at the m/z 709.4, 779.5, and 815.5. We further conducted
MS/MS analysis of these three ions by analyzing their post-source decay products using the laser-induced fragmentation technology (LIFT) cell. The presence of three fragments – PO3
-(m/z 97), H2PO4- (m/z 97), and C3H6O5P- (m/z 153) – suggests that the three signals are related
to analytes from the group of phospholipids (Figure 2.14). We confirmed the identities of these peaks by performing MALDI-MS analysis with internal calibrants (Table 2.1). Matching the measured and the predicted m/z values led to a tentative identification of the three metabolites as phosphatidylglycerols.
Figure 2.12 Single-cell MS imaging with SiO2/9-AAnanoparticles used as matrix. (A) Optical and fluorescence micrographs of a single Closterium acerosum cell with the attached SiO2/9-AA nanoparticles. (B) MALDI mass spectrum of a single cell of Closterium acerosum – following the occlusion with SiO2/9-AA nanoparticles, and the release of 9-AA induced by gaseous ammonia. The blank spectrum of SiO2/9-AA nanoparticles shows no peaks overlapping with the three sample-related peaks (Figure 2.13). (C) Mass spectrometric images of a single cell of Closterium acerosum (same as in (A)). The MS images were obtained in the negative-ion mode by MALDI-time-of-flight (TOF)-MS. Laser beam wavelength: 355 nm; frequency: 50 Hz; diameter: 10 μm; raster spacing: 15 μm. The red-color dashed line in (A) approximately delimits the MS imaging area in (C). Scale bars: 200 µm.
Figure 2.13. MALDI mass spectrum of SiO2/9-AA nanoparticles deposited on an aluminum plate, and incubated with gaseous ammonia (blank). Note that the signal at the m/z: 814.9 – in this blank spectrum – does not completely overlap with the signal at the m/z: 815.5 – recorded when analyzing the sample of Closterium
acerosum cells (cf. Figure 2.12).
The three prominent MS signals (m/z 709.5, 779.5, and 815.5) were subsequently monitored in a MALDI imaging sequence (Figure 2.12) using a 10-µm UV laser beam, and a raster with 15-µm spacing. The MS signals follow the contours of single cells as observed in the optical and fluorescence images (Figure 2.12A). Although the coverage of the cell with MALDI matrix is highly homogeneous (Figures 2.12A, 2.10 and 2.14), the distribution of metabolites within the cell – as visualized by MALDI-MS – is seen to represent some heterogeneity (Figure 2.12C): this points out the advantage of performing MALDI-MS imaging with subcellular resolution. For example, the metabolite corresponding to the MS signal at the m/z 779.5 seems to be present in the whole cell, while the metabolites corresponding to the MS signals at the m/z 709.5 and 815.5 appear to be more concentrated in one of the two semicells of the C. acerosum cell under investigation (Figure 2.12C).
Figure 2.14 MALDI-MS/MS spectra of the three ions corresponding to the MALDI images depicted in Figures
2.12 and 2.15: (A) m/z 709.4, (B) m/z 779.5, (C) m/z 815.5. Precursor ions are marked with asterisks (*).
The traces in the left-side column represent full m/z-range spectra whereas the traces in the right-side column display the low-m/z range (within the same spectra). The tandem mass spectra were obtained from the samples of Closterium acerosum (co-crystallized with 9-AA) in the negative-ion mode, using the laser-induced fragmentation technology (LIFT).
Table 2.1 Matching the observed and the predicted m/z values after the analysis of Closterium acerosum cells by
negative-ion MALDI-TOF-MS using 9-aminoacridine as matrix, and in the presence of internal calibrants. The internal calibrant mixture contained adenosine triphosphate, guanosine triphosphate, uridine diphosphate glucose, acetyl coenzyme A and bradykinin acetate (each at the concentration of 8.33 × 10⁻⁶ M).
Observed m/z Predicted formula Predicted m/z [M-H]- |∆m| (Da)
709.379 C38H63O10P 709.40861 0.03
779.510 C43H73O10P 779.48686 0.02
815.500 C46H73O10P 815.48484 0.02
High-quality images of single C. acerosum cells were obtained using either 15 and 10-µm laser scan rasters (Figures 2.12C and 2.15, respectively). In the case of Anabaena sp., the method allowed imaging individual chains of cells (thickness < 10 µm; Figure 2.16). Further improvement in lateral resolution is expected after combining the sample preparation using the SiO2/9-AA nanoparticle matrix (proposed here) with state-of-the-art MALDI-MS
instruments which use laser beams with diameters smaller than 10 µm.
Coating specimens with chemical matrices is seen to be a big challenge in MALDI imaging. Common coating methods involve pneumatic spray and electrospray deposition [for reviews, see refs 16, 17, 21]. Since matrix compounds are normally dissolved in organic solvents, spray-based methods cause analyte to spread over the sample surface.17,21 Several alternative ways of applying matrix prior to MALDI-MS imaging have been proposed to date: for example, matrix can be deposited on the sample by using inkjet printing, which produces an array of matrix spots, the method which is mainly applicable for imaging at low lateral resolution.59 The matrix sublimation/recrystallization method ensures small crystal size, high
Figure 2.15 Optical and fluorescence micrographs (top) as well as mass spectrometric images of a single cell of
Closterium acerosum (bottom). The fluorescence micrograph (ex = 330-380 nm) shows the presence of
SiO2/9-AA nanoparticles (yellow color) on the cell surface (before the exposure to gaseous ammonia). MS images were obtained in the negative-ion mode by MALDI-TOF-MS. Laser beam wavelength: 355 nm; frequency: 50 Hz; diameter: 10 μm; raster spacing: 10 μm. Scale bars: 200 µm.
homogeneity, and minimum dispersion of analytes; however, this method is not suitable for all kinds of samples and matrices.22,23,25 Here we showed that high lateral resolution can be achieved after replacing conventional matrix application protocols with hybrid nanoparticles used as matrix carriers. Since the nanoparticles are dissolved in water – and the organic matrix release occurs in situ, when triggered by ammonia vapors – this way of preparing samples for MS does not blur the native distributions of the analytes, and the so-called ―sweet spot‖ effect may be reduced.
Figure 2.16 MALDI-MS imaging of small cell ensembles using Anabaena sp. as a model. Optical and
fluorescence micrographs (top) obtained using two different excitation wavelengths (λex = 510-560 and 330-380 nm – middle and right, respectively) and MALDI-MS images of Anabaena sp. (bottom) after the treatment with SiO2/9-AA nanoparticles and ammonia vapors. The MS images were obtained in the negative-ion mode by MALDI-TOF-MS. Laser beam wavelength: 355 nm; frequency: 50 Hz; diameter: 10 μm; raster spacing: 10 μm. The red-color dashed line in approximately delimits the MS imaging area. Scale bars: 100 μm.
2.4...Concluding remarks
To our knowledge, this is the first study demonstrating a hybrid inorganic-organic nanomaterial designed with the purpose of mapping metabolites in microscale biological specimens by mass spectrometry. This novel strategy brings about several key advantages: (i) application of the hybrid matrix can be conducted in liquid phase (native environment of the biological cells), (ii) the matrix targets the biological specimen by attaching to its surface due to electrostatic interactions, (iii) application of the organic MALDI matrix compound occurs

![Figure 1.2 The principle of MALDI imaging. (A) A sample containing bradykinin acetate ([M+H] + at m/z 1058.5) is used to write ―Leebo‖ on a MALDI sample plate](https://thumb-ap.123doks.com/thumbv2/9libinfo/8152888.167163/22.892.146.785.157.765/figure-principle-maldi-imaging-sample-containing-bradykinin-acetate.webp)