~ ) Pergamo~t
Copyright © 1996 Elsevier Science Ltd Printed in Great Britain. All rights reserved 0017-9310/97 $15.00+0.00PII:
S0017-9310(96)00169--XUnsteady vortex roll structures in a mixed
convective air flow through a horizontal
plane channel: a numerical study
C. H. YU, M. Y. CHANG, C. C. H U A N G and T. F. LINI"Department of Mechanical Engineering, National Chiao Tung University, Hsinchu, Taiwan, Republic of China
(Received 30 May 1995 and in final form 30 April 1996)
Abstract--A three-dimensional unsteady numerical simulation was conducted to investigate the buoyancy induced vortex flow structures in a forced air flow through a bottom heated horizontal plane channel. In particular, a third-order upwind finite difference scheme was chosen to solve the Navier-Stokes and energy equations, in the ranges of the Reynolds number Re from 20 to 50 and Rayleigh number Ra up to 31 000, several roll structures were predicted. In the steady flow at high Re and low Ra after the initial transient the longitudLinal rolls possess spanwise symmetry and grow regularly to a fully developed state as it proceeds downstream. While in the time periodic flow at low Re and high Ra the rolls may tilt towards the right side wall and the flow is asymmetric or they may tilt to both sides and are symmetric, depending on the particular case studied. This roll tilting causes the rolls to terminate as they encounter the side walls. Meanwhile, new space is provided in the region near the other side of the duct or near the central vertical plane for the generation of new cells. It is also noted that the rolls are wavy in axial direction. Moreover, the rolls change their sizes during moving downstream and no fully developed state can be discerned. Based on the present data, correlating equations for the onset of convection and Hopf bifurcation were proposed.
Copyright © 1996 Elsevier Science Ltd.
1, INTRODUCTION
Buoyancy induced vortex flow is known to be rather complicated and can significantly affect the flow and thermal characteristics in a forced flow through a bot- tom heated horizontal plane channel. The under- standing of this coaaplicated vortex flow is important in various technological processes such as chemical vapor deposition ir: growing single crystal film, energy transport in flat plate solar collectors, cooling of mic- roelectronic equipments, and many others. Due to the flow being three-dimensional, early studies in the literature mainly adopted experimental measurement to treat the problem. For instance, the critical Ray- leigh number Ra¢ fi)r the onset of vortex flow and the characteristics of steady longitudinal vortex rolls in a duct with the botto~aa at a higher uniform temperature than the top were measured by Mori and Uchida [1], Akiyama et al. [2], Ostrach and Kamotani [3], Kamotani and Ost:rach [4], Hwang and Liu [5], and Kamotani et al. [6]. A flow regime map of Reynolds number Re vs Rayleigh number Ra was proposed for nitrogen gas by Chi u and Rosenberger [7] and Chin et aL [8], to locate the boundaries between three different flow patterns, i.e., Lhe flow with no vortex roll, a flow with a steady longitudinal roll and a flow with an unsteady longitudinal roll. At very low Re Ouazzani et al. [9, 10] found that the vortex flow is in the form t Author to whom all correspondence should be addressed.
of transverse rolls. Similar investigations with the bot- tom plate heated by a uniform heat flux were con- ducted by Osborne and Incropera [11, 12], Incropera et al. [13, 14] and Maughan and Incropera [15, 16]. Four flow regimes with progressing complexity were identified along the channel, beginning with laminar forced convection near the inlet, followed by laminar mixed convection, transitional mixed convection and turbulent free convection. As for the theoretical study, only linear stability analyses were carried out to pre- dict Rac by Nakayama et al. [17], Hwang and Cheng [18] and Lee and Hwang [19]. A close examination of these studies reveals that some important vortex flow characteristics such as how the vortex flow is formed at the onset point Ra¢ and its subsequent development in time and space, the onset of Hopf bifurcation, the unsteady flow structure beyond the Hopf bifurcation are still not well understood. To complement these early studies, a direct 3-D unsteady numerical simu- lation for a mixed convective air flow in a horizontal plane channel is attempted here. Attention is focused on the effects of the Rayleigh and Reynolds numbers on the detailed flow characteristics.
2. MATHEMATICAL MODELLING
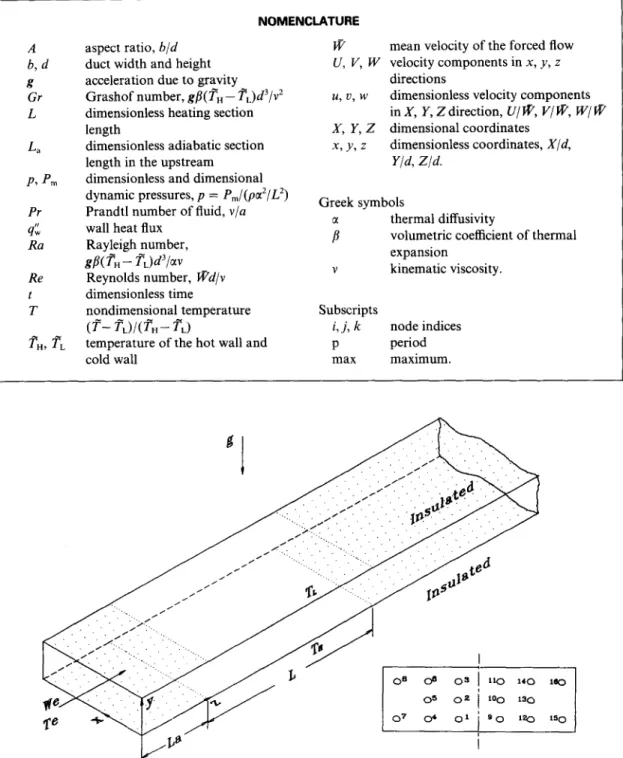
Under consideration is a forced flow of average velocity • in a differentially heated horizontal rec- tangular duct of large aspect ratio (.4 >/12), as sche- matically shown in Fig. 1 along with the chosen coor- 505
506 C.H. YU
et al.
A
b,d
g
Gr
L
La
P , e m P Fq~
Ra
Re
l
T
r~,r~
NOMENCLATUREaspect ratio,
b/d
if"
duct width and height U, V, W
acceleration due to gravity
G r a s h o f number, g f l ( T H - - ~ L ) d 3 / v 2 hi, V, W
dimensionless heating section
length X, Y, Z
dimensionless adiabatic section x, y, z length in the upstream
dimensionless a n d dimensional dynamic pressures, p =
Pm/(p~tZ/L 2)
Prandtl n u m b e r o f fluid,v/a
wall heat fluxRayleigh number,
gfl( T . - ~L)a3 /~v
Reynolds number,
Wd/v
dimensionless timenondimensional temperature Subscripts
( T - TL)/(Tu- TL)
i,j, k
temperature of the hot wall a n d p
cold wall max
mean velocity of the forced flow velocity components in x, y, z directions
dimensionless velocity components i n X , Y, Z direction,
U/W, VIIi, W / W
dimensional coordinatesdimensionless coordinates,
X/d,
Y/d, Z/d.
Greek symbols
ct thermal diffusivity
fl volumetric coefficient of thermal expansion v kinematic viscosity. node indices period maximum.
,re
~ / / t / / / / / "....•. / / / " . 5... / / • • • / / . . . . • 1 / . , . ~ ' . , . . .I
'1
. '. • •. ' / / ~ • • . • . ' / / / . . . . - . • . t t ~ / " >.¢ -- . • . . . 1 . ..?. Q . . . ~ ... . . . : . . • . . . --,.,.. • •J
od
b
0 e 0 s 0 ~ t ~ : 3 x 4 0 0 m 0 2 to O t,~ 0 0 7 ' CY ~ 0 x 9 0 1 2 0 l e O t 5 0Fig. 1. Schematic of the physical system and the detection points at a cross-section. The x and y coordinates at various points are as follows: 1--(6.60,0.08), 2--(6.60,0.5), 3--(6.60,0.92), 4~(9.07,0.08), 5-- (9.07,0.5), 6--(9.07,0.92), 7--(11.55,0.08), 8---(11.55,0.5), 9---(5.40,0.08), 10--(5.40,0.5), 11--
(5.40, 0.92), 12--(2.93, 0.08), 13--(2.93, 0.5), 14--(2.93, 0.92), 15--(0.45, 0.08), 16---(0.45, 0.5).
dinates. A choice of a large aspect ratio duct is made here so that the predicted results are closer to those in a parallel plane channel (A ~ 0o). Initially at time t < 0, the flow in the duct is fully developed a n d at the uniform temperature, 7~L. The b o u n d i n g wails are thermally well insulated. A t time t = 0 the b o t t o m plate temperature is suddenly raised to a higher value
TH a n d the top plate is kept at the initial temperature 7~L over a finite length La ~< z ~< L a -b L a n d both are maintained at these levels thereafter. In spite of this change, other b o u n d a r y conditions are assumed to be unaffected. W h e n the length, time, velocity, a n d temperature are scaled with the duct height d, resi- dence time of the flow
d/a,,
average velocity of theforced flow ~v and temperature difference (/~.-7~D, basic equations describing the temporal and spatial evolution of the buoyancy induced vortex flow of a Boussinesq fluid studied here are
~3u Ov (?w
(1)
Ou ~u Ou ~u
ot
+ Ty +wv
c~p
1 {O2u
OZu g2u\= -- O-x + R e e ~ x 2 + --Oy 2 + ~z 2) (2) Ov Ov Ov Ov Op 1 f~2v O2v ~32v\ Gr T ( 3 ) Ow Ow gw Ow
T;
+ Ty +W z
1 Io w
o w)
= -- Oz + R e e ~ x 2 + Oy 2 + Oz 2 j (4) OT OT S T S T- - + ~-z~ ).
(5)
=R-- r
+
Oy2Three governing parameters in the above formulation are the G r a s h o f n u m b e r Gr, Reynolds number Re and Prandtl number Pr. They are defined as
gfl(~. - ~L)d ~
Wd
G r - ,;2 R e = - - y P r = - . (6)
The Rayleigh number frequently appears in dealing with the mixed convective flow and is defined as Ra = Pr" Gr. The problem is subject to the following initial and boundary conditions :
t < 0 u = v = 0 , w = w r a , T = 0 t>~0 0T x = O & A u = v = w = O ~ x = 0 y = O La<~z'-~.L+La u = v = w = O T = I y = 0 O ~ z < L a , z > L + L a OT u = v = w = O ~ y = 0 y = l L ~ z ~ , ~ L + L ~ u = v = w = O T = 0 y = l 0 ~ z < L ~ , z > L + L ~ ST u = v = w = O ~ y y = 0 z ~ 0 u = v = 0 w = w f d T = 0 ~u Or c~w ~?T z - ~ oe dz - Oz Oz oz = O (7)
where the inlet velocity wrd is assumed as fully
developed with the values of the constants m and n depending on the aspect ratio A (Shah and London [20]), which is
= ( m + l ~ ( n + l ~
wfa \ m J k n J
)m I
To account for the upstream diffusion at low Reynolds number flow, an insulated section of length La was added to the heated section as shown in Fig. 1. The selection of proper La will be discussed in the next section. The local Nusselt number which signifies the heat transfer from the bottom heated plate to the channel flow is defined and evaluated ashd qw d OT (9)
where q~ is local convective heat flux and k is the thermal conductivity of the fluid.
3. NUMERICAL SOLUTION
In view of the nonlinearity in the inertia terms, the basic equations were solved numerically. In particular, the projection method (Peyret and Taylor [21]) was chosen to integrate the equations on a staggered grid system. This splitting (fractional step) method con- sists of two steps. First, a provisional velocity field was explicitly computed, ignoring the pressure gradient. Then, it was corrected by including the pressure effect and by enforcing the mass conservation law. The pres- sure distribution is obtained from solving the Poisson equation for pressure by the vectorized SOR method. To enhance the numerical accuracy and stability, all the spatial derivatives were discretized by the fourth- order central differences (Hirsch [22]), except for the convective terms which were approximated by the third-order upwind difference proposed by Kawa- mura et al. [23]. To allow for the possible presence of an asymmetric flow with respect to the central vertical plane at x = A/2 for the time dependent flow induced at high Gr/Re 2, the computation domain includes both the left-half and right-half of the channel. Although the downstream boundary conditions were exactly specified at z ~ 00, only a finite unheated section is added in the downstream to facilitate the numerical analysis. Both this unheated section and the upstream insulated section must be long enough so that the solution for the problem is independent of their sizes. Numerical tests indicated that the suitable length for the upstream and downstream unheated sections is respectively 0.07L and 0.46L. Time advancement may be done either implicitly or explicitly. The first-order Euler explicit scheme was employed here since it has much lower computational cost per time step and requires much less computer memory allocation than
508 C.H. YU et al.
any equivalent implicit implementation. To resolve the smallest physical time scale in time dependent flow, the time step must be small. Thus the implicit and semi-implicit methods are not favorable as far as the computation time is concerned. The stability of the scheme is limited by the requirement that the Courant number be less than unity (Anderson et al. [24]). To ensure numerical convergence, the Courant number is set below 0.05 in the computation, which leads to
At < 0.05 x m i n i m u m ( .Ax A y , A z ~ (10)
Umax ' Vmax Wrnax]"
The sequence of numerical operation is as follows : (1) Explicitly calculate the provisional velocity. (2) Solve the pressure equation by the vectorized Gauss-Seidel method with successive over-relaxation. Solution for the pressure is considered as convergent when the mean relative pressure difference between two consecutive iterations is below 10 -4 , that is
I / ( I x J x K ) < 10 -4 i (pin.j,~l)m+, . + l .
n + l m + l
,j,~
I~o,,j,~)
L
/
01)
where i, j, k are respectively the indices of the nodes in the x, y, z directions, m is the iteration number and L J, K are the total numbers of nodes in the x, y, z directions, respectively. This ensures the mass imbal- ance at each node is less than 10-* of the inlet mass flowrate.
(3) Explicitly calculate the desired velocity and temperature fields at the new time step.
Procedures (1)-(3) were repeatedly applied from the initiation of the transient to a final steady state or to a statistical state when the flow was no longer steady at long time.
F o r a low Reynolds number flow studied herein a uniform grid is placed in the computational domain with Ax = A f t , Ay = l / J and Az = 1.53L/K. I, J and K varied from 31 to 121 depending on the particular set of parameters to be investigated.
To verify the proposed numerical scheme, a series of program tests were conducted. First, the predicted spanwise average Nusselt number variations with the axial coordinate for the pure forced convection (Gr/Re 2 = 0) of air in a rectangular duct were found to be in excellent agreement with the numerical and experimental results of Incropera et al. [14]. Then, the steady mixed convection of nitrogen in a high aspect ratio rectangular duct was simulated. The comparison of the computed axial velocity profiles for a typical case with Pr = 0.7, Re = 44.8, Gr/Re 2 = 3.43 and A = 10 with the experimental data of Chiu et al. [8] shows good agreement. Further comparison was made in Fig. 2 to test the data of Ostrach and Kam- otani [3] for the spanwise temperature distributions. The agreement is also good. Finally, a grid test was performed. Sampled results from such a test were
compared for the local Nusselt number at selected axial stations at the steady state for a t y p i c a l case with Pr = 0.71, Re = 50, Ra = 9000. The differences in the results calculated from four different grids were all less than 2%. Furthermore, we compared the calculated frequency of the flow oscillation for a case with a high buoyancy at Ra = 20 000. Again, the differences in the results from using these grids were less than 4 0 . Through these program tests, the adopted solution procedures are considered to be suitable for the pre- sent study.
4. RESULTS AND DISCUSSION
Computations were specifically carried out for air flow (Pr = 0.71) in a duct of A fixed at 12 and L fixed at 15. The Reynolds number ranges from 20 to 50 and Rayleigh number Ra from 6000 to 31 000. Systematic calculation was conducted to capture the detailed flow characteristics. Results were first obtained for Re = 50 and Ra = 6000. Then, Re is fixed at 50 and Ra is raised to 7000, 8000 and 9000. The predicted flow is steady in the entire duct after the initial transient has died out for these cases. As Ra is raised to 10000, the time periodic flow eventually prevails in the down- stream end of the heated section. At an even higher Ra, time periodic flow exists in a larger region and is closer to the inlet. In the following only a small sample of the results will be presented to illustrate mainly the onset of vortex flow and the unique roll structures in the unsteady flow.
4. I. Onset o f vortex f l o w
To illustrate the buoyancy induced onset of the vortex flow, the predicted steady axial flow devel- opment for Re = 50 and Ra = 9000 are shown in Fig. 5 by plotting the cross-plane streamlines and iso- therms at eight selected cross sections. The results indicate that in the entry region two vortex rolls first appear near the side walls. Elsewhere, the flow is still unidirectional and is forced convection dominated. As the flow moves downstream, more rolls are induced. At z = 14.30 five pairs of longitudinal vortex rolls occupy the cross-section. Note that the vortex flow is symmetric with respect to the vertical central plane at x = A/2. The above results clearly indicate that the onset point depends on the spanwise location. If the onset point is taken as the location at which the span- wise average Nusselt number enhanced by the vortex flow, exceeds the forced convection value by 3%, our predicted results can be correlated as
(12)
The predicted onset point locates slightly downstream of the data from experimental measurement by Kam- otani et al. [6] and Chiu and Rosenberger [7] and from stability analysis by Lee and Hwang [19].
p r e s e n t data O s t r a c h & l [ a m o ~ n / ( 1 9 7 5 ) 509 T - T ~
AT
0 . 3 o.s 0.1 o . o - 0 . 1 - 0 . 2 - 0 . 3 R a = 1 0 8 0 0 , z = 1 5 . 5 4 ~ I X 8 . 0 T - T m~T
0 . 3 0 . 2 0.1 0-04, -0.1 -0.2 - 0 , 3 R a = 8 9 0 0 , z = 1 4 . 9 0 ! I I8.0 y
8.0
8 . 5 I X Ra = 8 9 0 0 , z = 1 3 . 9 9 0 . 3 0.1 T - ' I ' m 0.0 I ' ' X AT 4 - 0 . 1 o [] - 0 . 2 o - 0 . 3Fig. 2. Comparison of the spanwise temperature distributions at y = 1/2 with the data of Ostrach and Kamotani [21] for Pr = 0.71 and Re -- 38 with different Rayleigh numbers.
4.2. Structure o f w,rtex f l o w
Downstream of the onset point the buoyancy induced vortex flow is in the form of longitudinal rolls for all cases studied here. When the steady flow prevails for R e = 50 and R a <<, 9000, the rolls grow gradually with the downstream distance. Those near the side walls become fully developed before the flow leaves the heated section. These fully developed rolls are nearly the same size and the roll diameter is approximately eqtud to the duct height d. The axes of the fully developed rolls are parallel with the side walls. Moreover, the secondary flow intensity of the rolls increases very slightly with the axial distance.
This unique roll structure results in the special tem- perature field at selected cross-sections shown in Fig. 3 and is also clearly reflected in the air temperature distribution in the middle horizontal plane at y = 0.5 and the local Nusselt number distribution on the bot- tom plate given in Fig. 4.
At increasing Rayleigh numbers the flow becomes time dependent as mentioned above. Additionally, more rolls are induced in the channel. For instance, as R a is raised from 9000 to 10 000 with a fixed Reynolds number, the roll number at the cross section z = 12.62 varies with time from 12 to 14 or 16. The predicted vortex flow at this cross section at three time instants
510 C.H. YU et al.
(8)
(7)
(6)
(s)
(4)
(z)
(z)
T:O,Z(0.1)I.0 ,1,:-2.43(.48)2.43 T:O.I(O.I)t.O 9:-2.37(.46)2.37T:O.I(O.I)I.O
~I':-2.35(.46)2.35
T:O.O(O.I )t.O ~:-2.30(.46)2.30 T:0.0(0.1)1.0 ';':-2.31 (.46)2.31 T:O.O(O.I)I.O t,:-2.02(.40)2.02 T:O.O(Od)LO@,,:_,@
0 .'~ @ • :-1.74(.34)1.75@
T:0.0(0.1)I.0 't':-.83(. 16).84C1)
Fig. 3. Steady isotherms and streamlines at selected cross-sections for Pr = 0.71, Re = 50 and Ra = 9000 at z =(1) 2,52 (2) 4.21 (3) 5.89 (4) 7.57 (5) 9.26 (6) 10.94 (7) 12.62 and (8) 14.30. In the streamlines the solid lines represent the counter-clockwise recirculations, while the clockwise cells are indicated by the
dashed lines.
@
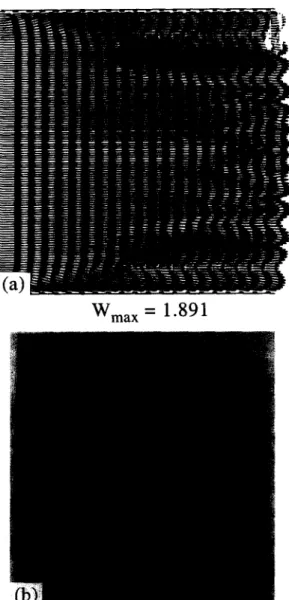
is c o m p a r e d with our experimental flow visualization (Chang, Y u and t i n [25]) in Fig. 5. The variation o f the roll number a m o n g 12, 14 and 16 is confirmed by the experiment although the details o f the roll structures exhibit some discrepancies, especially for the 12 rolls near the central plane at x = A/2. Further comparison is m a d e in Fig. 6 for the numerically pre- dicted planform of the velocity field and the top view of the flow field by our experiment [25] at time t = 300. G o o d agreement is noted in this comparison.
As the flow does not reach steady state at higher Rayleigh numbers, a close inspection of the detailed flow patterns reveals that very different roll structures were noted. The results of time periodic cross-plane
streamlines and isotherms for a representative case with Re = 50 and Ra = 20 000 are displayed in Fig. 7(a) and (b) at two selected time instants in a typical periodic cycle when the statistical state is prevalent. It is i m p o r t a n t to note f r o m these results that the rolls tilt to the right side as they m o v e downstream. Obvi- ously, the flow is no longer symmetric with respect to the vertical central plane at x = A/2. The spanwise symmetry of the flow is broken in this time periodic flow. The results for other cases at the same Reynolds number indicate that the degree of roll tilting is only slightly affected by the Rayleigh number. As the rolls hit the side wall, they terminate. A close inspection of the streamlines, however, reveals that the clockwise
:1,11 b.ll
0.11 O.O
Fig. 4. The steady local Nusselt number distribution on the bottom plate and the temperature distribution in the middle horizontal plane (y = 0.5) for Pr = 0.71, Re = 50 and Ra = 9000.
q~:-2.37(.46)2.38
t=
1725
~-~ "k " = : . . . .
511
if,:- 2.54(. 46)2.55
t = 1775
q,:- 2 . 5 7 ( . 4 9 ) 2 . 4 7
t= 147,5
Fig. 5. Comparison of the numerically predicted and experimentally visualized vortex cells at cross-sections z = 12.62 at three different time instants for Pr = 0.71, Re = 50 and Ra = 10000.
rotating rolls gradually shrink as they approach the side wall. They disappear on arriving at the side wall. Then the counterclockwise roll near the side wall merges with the adjacent roll to form a big elongated roll. On travelling downstream this roll again shrinks but does not disappear. Meanwhile, this roll tilting provides new space near the left side-wall and new rolls may be generated there. The axial location at which the new cells are induced changes significantly with time in a period. The new rolls grow in size as they proceed downstream. Moreover, roll splitting is noted in the entry region of the heated section. These complicated roll i~clination, termination, generation, merging, splitting, decay and growth cause the rolls to be very different in size, and no fully developed state is attained.
To further illustrate the roll structure, Fig. 8 shows the associated vector velocity maps in two selected vertical planes parallel with the side walls at two selec- ted time instants in a period. For clear illustration, the domain of the plots is not proportional to the
actual one. The results clearly manifest that the flow is wavy in the longitudinal direction. Each wavy roll has a different phase. The wavelength is about 6.7. These results together with those in Fig. 7 suggest that the longitudinal vortex rolls are inclined and wavy and oscillate periodically with time. In addition, the roll sizes vary significantly with space and time.
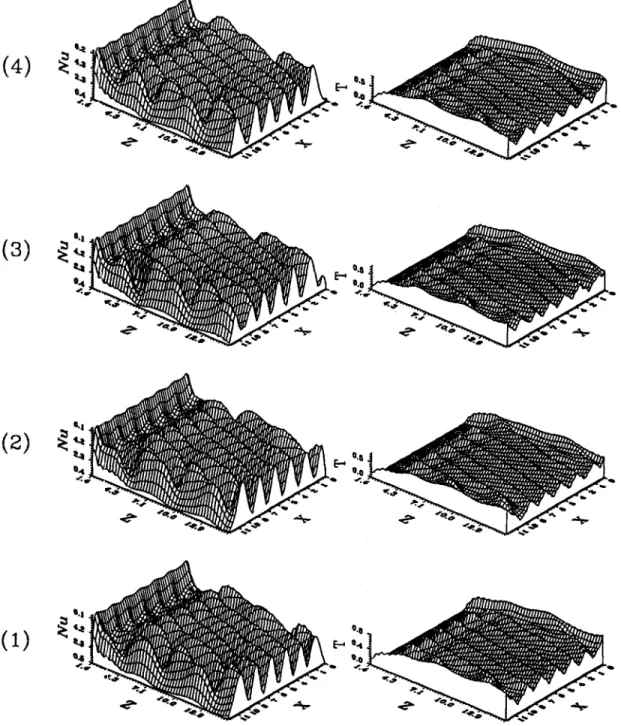
The unique roll structure in the time periodic flow described above is again reflected in the local Nusselt number distribution on the bottom plate and air tem- perature in the horizontal plane at y = 0.5, as shown in Fig. 9. These results again clearly show the roll termination and generation.
Up to this point attention has been focused on the spatial structure of the vortex rolls. To quantify the temporal characteristics in this asymmetric flow, time records of the temperature T and axial velocity w at sixteen selected locations, specified in Fig. 1, in one selected cross section are given in Fig. 10 for t ~> 150. The corresponding power spectrum densities for these records indicated that the flow in the entire duct oscil-
512 C.H. YU et al.
W m a x = 1 . 8 9 1
Fig. 6. Comparison of the predicted planform of the velocity field (a) and the flow visualization (b) at y = 1/2 for
Pr = 0.71, Re = 50 and Ra = 10000 at t = 300.
lates at the same fundamental frequency (fl = 0.096) as its harmonics. In a given cross-section the ampli- tude of the oscillation is also position dependent especially in the entry region. A close inspection of these results reveals that the temperature oscillations at various locations are not in the same phase, neither are the velocity oscillations. Comparing the time his- tories at the corresponding points symmetric with respect to the central plane, x = A / 2 discloses that the flow asymmetry is rather significant in the side wall region, obviously due to the roll generation and ter- mination there. Near the central plane the flow is almost symmetric with nearly the same wave form and amplitude but out of phase in the flow oscillation. Finally, it is necessary to point out that at Ra = 31 000 the flow becomes quasiperiodic with the appearance of a second fundamental frequency.
To enhance our understanding of the unsteady flow characteristics, the phase space trajectories relating the velocity components u, v and w in periodic motion at the same detection points in the cross-section z = 6.45 are shown in Fig. 11. A single enclosed curve (limiting cycle) is noted for each plot implying that the flow is completely periodic [26]. The results indi- cate that the trajectories of u, v and w in a period are very different at different locations and there are complicated relationships between the velocity com- ponents at a give location.
Having discussed the effects of the Rayleigh number on the flow evolution, attention is turned to the influ- ences of the Reynolds number. For this reason a straightforward numerical experiment was carried out. Knowing that the steady flow resulted for R e = 50 and R a = 9000, a calculation was performed for reducing Re from 50 with Ra fixed at 9000. The computed data show that after the initial transient the flow finally evolves to a time periodic state for 20 ~< Re <<. 40. For R e = 10 nonperiodic flow appears. Typical results for flow structures from this exper- iment are illustrated in Fig. 12 for R e = 30 and R a = 9000. It is worth noting that the longitudinal rolls in the left half of the duct tilt to the left-side wall, while those in the right-half tilt to the right wall. Note that the rolls also terminate before they encounter the side walls. Meanwhile, new rolls are generated in the duct core near the central plane. The vortex rolls are symmetric with respect to the central plane x = A/2, in this time dependent flow. This is also the case for R e = 40 and 20. Also note that the roll tilting is insen- sitive to the Reynolds number.
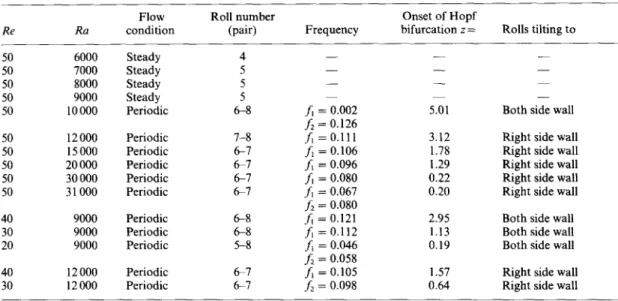
Finally, Table 1 summarizes some major flow characteristics for all the cases studied here. In addition to the criterion from the onset of vortex rolls given earlier, the onset of Hopf bifurcation (periodic oscillation) based on the present data is correlated as
~ z ~ -0.31
R a = 4907 x ~R--e~rJ " (13)
It is also noted in the table that the fundamental frequency of the flow oscillation increases with decreasing Rayleigh and Reynolds numbers.
5. CONCLUDING REMARK
Through a direct numerical simulation this study unraveled the unique longitudinal roll structures in time periodic mixed convective flow in a bottom heated horizontal flat duct. The induced vortex flow always shows spanwise symmetry when the flow is steady, while for time periodic flow the vortex rolls can be asymmetric for some cases and symmetric for others. Over the range of the parameters investigated the transverse rolls were not predicted. It is of interest to locate the domain of the parameters for the exis- tence of the transverse rolls in the near future. Effects
(s)
(7)
(s)
(s)
(4) (3) (2) (1)(8)
(7)
(e)(5)
(,t)(~)
(2)
(1) T:0.1(0.1)1.0 I:-5.90(.82)4.30 - - ~ .,'7' %:.!)) ~,., ~::"-*~t i:(,::%"i ~o<""i) "".~'<~:~.":'!;~
-Tv 2z
@
@ :.,.,;..,
@,....,.,.,
@ @
c_ DI
l : O . l ( O . l ) l . 0 I:-$.99(.79)4.016:it~iTfl
7{/')]i)
@i~)i
~!]r~
(7{i-j..'ii
?~:7~
T:O.I(O.I )1.0 l,:-4.23(.85)4;31 T:0,0(0.1)1.0 I:-4.16(.82)4.17 • :,;-?:'~:~ ;:'~:':'~-:; ~-7".:'_:~4. ~:':':~:.~:, - -T:O.0(0.1 )1.0 q[':-,t. 72( .7,1),1.68 T:O.0(0.1 )1.0 'I:-3.24(.70)`1.80 T:0.0(0.1)1.0 ,I,:-3.2s(.sg)2.Te l:O.O(O.l )1.0 I:-2.03(.,19)1.92
© C) © (3 (3 c"~ 0 0 O 0
o
(a)
T:0.1(0.1)1.0 t,:-4.27(.83)4.19 t...:----~', ~ti' '" ,:: ". :~ :. .. ,v .:;:;:':-~':~:' T:0.1(0.1)1.0 ~:-4.2e(.81 )~.94 T:0.1(0.1)1.0 I:-3.79(.75)3..87 T:0.0(0.1)I.0 I : - 3 . 7 2 ( . 7 5 ) 3 . 8 6 T:0.O(0.1)I.0 ~I,:-3.97(.78).t.91 i:O.O(O.l)l.O I:-3.83(.76)$,8e l:O.O(0.1)l.0 I:-5.23(.59)2.75 T:0.0(0.1)1.0 ,i':- 1.97(.40)2.15("~ 0 C 0
,,..- 0
"'
' ' 0 (£) 0 ;:
t..) ,..( ~
(b)Fig. 7. Isotherms a n d streamlines for Pr = 0.71, Re = 50 a n d Ra = 20 000 at cross-section z = (I) 2.52 (2) 4.21 (3) 5.89 (4) 7.57 (5) 9.26 (6) I0.94 (7) 12.62 a n d (8) 14.30 at t w o time instants in a pcriod (a) t a n d
514 C . H . Y U et al.
T a b l e 1. S u m m a r y o f s o m e m a j o r flow c h a r a c t e r i s t i c s for all cases
F l o w R o l l n u m b e r O n s e t o f H o p f Re Ra c o n d i t i o n (pair) F r e q u e n c y b i f u r c a t i o n z = R o l l s t i l t i n g to 50 6000 S t e a d y 4 - - - - - - 50 7000 S t e a d y 5 - - - - - - 50 8000 S t e a d y 5 - - - - 50 9000 S t e a d y 5 - - - - 50 10 000 P e r i o d i c 6 - 8 f~ = 0.002 5.01 B o t h side w a l l f2 = 0.126 50 12 000 P e r i o d i c 7 - 8 f~ = 0.111 3.12 R i g h t side w a l l 50 15 000 P e r i o d i c 6 - 7 f~ = 0.106 1.78 R i g h t side w a l l 50 20 000 P e r i o d i c 6 - 7 f~ = 0.096 1.29 R i g h t side w a l l 50 30 000 P e r i o d i c 6 - 7 f m = 0.080 0.22 R i g h t side w a l l 50 31 000 P e r i o d i c 6 - 7 ./'1 = 0.067 0.20 R i g h t side w a l l f2 = 0.080 40 9000 P e r i o d i c 6 - 8 f~ = 0.121 2.95 B o t h side w a l l 30 9000 P e r i o d i c 6 - 8 f~ = 0.112 1.13 B o t h side w a l l 20 9000 P e r i o d i c 5 - 8 f~ = 0.046 0.19 B o t h side w a l l A =
0.058
40 12 000 P e r i o d i c 6 - 7 f~ = 0.105 1.57 R i g h t side w a l l 30 12 000 P e r i o d i c 6 - 7 f2 = 0.098 0.64 R i g h t side w a l l W = 1 . 9 0 3 m a x W = 1 . 8 8 5 m a x(1)
I (a) W max = 1 . 9 5 3 - . ~ - - - . ~. ~.. - ~ . . .K N. .~ : ~ ~. ~ , ~ ~~ -. ~- : ~(2)
.
.
.
.
.
.
.
"
~
'
~
N
.
_
~
I W = 1 . 9 6 3 max(1)
I z = 1 . 1 5 z = 1 6 . 1 5 z = 2 3(b)
Fig. 8. T h e v e c t o r v e l o c i t y m a p s in t w o selected v e r t i c a l p l a n e s p a r a l l e l w i t h the side w a i l s a t x = (1) 5.90 a n d (2) 8.88 for Pr = 0.71, Re = 50 a n d Ra = 20 000 a t t w o selected t i m e i n s t a n t s in a p e r i o d : (a) t - t p / 8
(4)
(3)
(2)
(1)
~4 0.0i
0.0~
, I I D O.0 ~ o4 ~4 Q.OFig. 9. The local Nusselt number distributions on the bottom plate and the temperature distributions in the middle horizontal plane at y = 0.5 for Pr = 0.71, Re = 50 and Ra = 20000 at four time instants in a
516 C . H . Y U et al.
("~0.000
,0.000]
b" 0.000
0.000
0.600 .
~
0.000[. 0.600
0.000
1.682
~.832
0.082 1.582 ~0.83Z 0.082 1.682 0.01~ ~ 0 . 8 ~ O.WBZ l,f~12lm%.r~
O.~SI!I 1.662 ~0.032 0.0820.600 ~
m1"559
1
0.000
0.039
.800 ~
.1.5:~0
t
O.OOQ
0.0~0
0.600 ~
1.5,39 1
0.000
0.0:19
.
0.030
4 , -
0.000 0.0~9 0.000 0.000 1.659 I0.000
° 1"630
°'°°°,6o ~oo ~ o ~ o °'°%~o , m . o soo °'°%so moo ~5o ~ o °'°~'1to 2oo ~ o ~ o
7"
7"
T
7"
F i g . 10. T i m e s a m p l e s a n d p o w e r s p e c t r u m d e n s i t i e s a t selected d e t e c t i o n p o i n t s f o r w a n d T f o r Pr = 0.71,
- ~
=
Fig. 11. P h a s e space t r a j e c t o r i e s o f u, v a n d w a t e i g h t d e t e c t i o n p o i n t s for Pr = 0.71, Re = 50 a n d
Ra = 20 000 a t z = 6.45.
T:O.l(O.l)l.0
,I,:-4.13(.82)4.12 T:O.I(O.I)i.O ,I,:-3.76(.74)3.78 T:O.I(O.1)I.O 4,:-4.28(.84)4:28 T:0.0(0.1)1.0 #:-3.55(.70)3.52 ~(=~',]:t !::::',~i t '~.~ d!.'.': I,,:£C T:0.0(0.1)1.0 #:-4.04(.80)4,04T:O.O(O.I )I.0 ~I':-3,85(.76)3.86
T:O.O(O.I)I.O ',t':-3.20(.64)3.20 :f::~:
":/-%
:;~i'-,"
...'..,% ~:.::i,~ T:O.O(O.I)I.O ',It:-2. I 0(.42)2.11 ( 1 ) , o , ,~ Fig. 12. I s o t h e r m s a n d s t r e a m l i n e s for Pr = 0.71, Re = 30 a n d Ra = 9000 a t z = ( 1 ) 2.52 (2) 4.21 (3) 5.89 (4) 7.57 (5) 9.26 (6) 10:94 (7) 12.62 a n d (8) 14.30 a t a selected t i m e i n s t a n c e in a p e r i o d a t t + tp/8 (tp = 8.95).518 C.H. YU et al.
of the d u c t i n c l i n a t i o n are expected to be i m p o r t a n t a n d will be explored later.
Acknowledgements--The financial support of this study by the engineering division of National Science Council of Taiwan, Republic of China through the contrast NSC82- 0404-E009-141 is greatly appreciated. This support of the present computation by the National Center for the High- Performance Computing, Taiwan is also acknowledged.
REFERENCES
1. Mori, Y. and Uchida, Y., Forced convective heat trans- fer between horizontal flat plates. International Journal o f Heat & Mass Transfer, 1996, 9, 803 817.
2. Akiyama, M., Hwang, G. J. and Cheng, K. C., Experi- ments on the onset of longitudinal vortices in laminar forced convection between horizontal planes. Journal o f Heat Transfer, 1971, 93, 335-341.
3. Ostrach, S. and Kamotani, Y., Heat transfer aug- mentation in laminar fully developed flow by means of heating from below. Journal o f Heat Tramfer, 1975, 97, 22~225.
4. Kamotani, Y, and Ostrach, S., Effect of thermal insta- bility of thermally developing channel flow. Journal o f Heat Transfer, 1976, 98, 62 66.
5. Hwang, G. J. and Liu, C. L., An experimental study of convective instability in the thermal entrance region of a horizontal parallel-plate channel heated from below. Canadian Journal o f Chemical Engineering, 1976, 54, 521 525.
6. Kamotani, Y., Ostrach, S. and Miao, H., Convective heat transfer augmentation in thermal entrance regions by means of thermal instability. Journal of Heat Transfer, 1979, 101,222-226.
7. Chiu, K. C. and Rosenberger, F., Mixed convection between horizontal plates--I. Entrance effects. Inter- national Journal o f Heat & Mass Transfer, 1987, 30, 1645-1654.
8. Chiu, K. C., Ouazzani, J. and Rosenberger, F., Mixed convection between horizontal plates--]I. Fully developed flow. International Journal of Heat & Mass Tran~fer, 1987, 30, 1655-1662.
9. Ouazzani, M. T., Caltagirone, J. P., Meyer, G. and Mojtabi, A., Etude numrrique et exprrimental de la con- vection mixte entre deux plans horizontaux. Inter- national Journal of Heat & Mass Transfer, 1989, 32, 261- 269.
10. Ouazzani, M. T., Platten, J. K. and Mojtabi, A., Etude experimental de la convection mixte entre deux plans horizontaux fi temprratures defferents--II. International Journal o f Heat & Mass Transfer, 1990, 33, 1417-1427. 11. Osborne, D. G. and Incropera, F. P., Laminar, mixed
convection heat transfer for flow between horizontal par-
allel plates with asymmetric heating. International Jour- nal of Heat & Mass Transfer, 1985, 28, 207-217. 12. Osborne, D. G. and Incropera, F. P., Experimental study
of mixed convection heat transfer for transitional and turbulent flow between herizontal, parallel plates, Inter- national Journal o f Heat & Mass Transfer, 1985, 28, 1337-1344.
13. Incropera, F. P., Knox, A. L. and Schutt, J. A., Onset of thermally driven secondary flow in horizontal rec- tangular ducts. Proceedings ~?f the Eighth International Heat & Mass Transfer Conference, San Francisco, CA 1986, pp. 1395-1400.
14. Incropera, F. P., Knox, A. L. and Maughan, J. R. Mixed-convection flow and heat transfer in the entry region of a horizontal rectangular duct. Journal o f Heat Transfer, 1987, 109, 434439.
15. Maughan, J. R. and Incropera, F. P., Experiments on mixed convection heat transfer for airflow in a horizontal and inclined channel. International Journal o f Heat & Mass Transfer, 1987, 30, 1307-1318.
16. Maughan, J. R. and Incropera, F. P., Regions of heat transfer enhancement for laminar mixed convection in a parallel plate channel. International Journal o f Heat & Mass Transfer, 1990, 33, 555-570.
17. Nakayama, W., Hwang, G. J. and Cheng, K. C., Ther- mal instability in plane poiseuille flow. Journal o f Heat
Transfer, 1970, 92, 61~58.
18. Hwang, G. J. and Cheng, K. C., Convective instability in the thermal entrance regional of a horizontal parallel- plate channel heated from below. Journal of Heat Trans- fer, 1973, 95, 72-77.
19. Lee, F. S. and Hwang, G. J., Transient analysis on the onset of thermal instability in the thermal entrance region of a horizontal parallel plate channel. Journal o f Heat Transfer, 1991, 113, 363-370.
20. Shah, R. K. and London, A. L., Laminar Flow Forced Convection in Ducts. Academic Press, New York, 1978, pp. 196-198.
21. Peyret, R. and Taylor, T. D., Computational Methods for Fluid Flows, Chap. 6. Springer-Verlag, New York,
1983.
22. Hirsch, C., Numerical Computation of lnternal and Exter- nal Flow, Vol. I. Wiley, New York, 1989, pp. 176-179. 23. Kawamura, T., Takami, H. and Kuwahara, K., New
higher-order upwind scheme for incompressible Navier- Stokes equations. Ninth ICNMFD, Vol. 10, 1985, pp. 285-29 I.
24. Anderson, D. A., Tannehill, J. C. and Pletcher, R. H., Computational Fluid Mechanics and Heat Transfer. Hemisphere, Washington, DC, 1984, pp. 71-77. 25. Chang, M. Y., Yu, C. H. and Lin, T. F., Changes of
longitudinal vortex roll structure in a mixed convective air flow through a horizontal plane channel: an exper- imental study~ International Journal of Heat & Mass Transfer, 1997, 40, 347-363.
26. Tritton, D. J., Physical Fluid Dynamics, Chap. 24. Oxford University Press, New York, 1988.
![Fig. 2. Comparison of the spanwise temperature distributions at y = 1/2 with the data of Ostrach and Kamotani [21] for Pr = 0.71 and Re -- 38 with different Rayleigh numbers](https://thumb-ap.123doks.com/thumbv2/9libinfo/7980175.159006/5.810.205.604.79.770/comparison-spanwise-temperature-distributions-ostrach-kamotani-different-rayleigh.webp)