Wednesday, May 10
Applications of SEM in Forensic Science
Cathodoluminescence Microscopy of Paint Samples
THOMASJ. HOPEN, RICHARDS. BROWN, DAVIDA. VANKO,* DR. WILFRIEDSTOECKLEIN†
MVA, Inc., Norcross, Georgia, USA; *Dept. of Geology, Georgia State University, Georgia, USA;
†Kriminaltechnisches Institut, Bunderskriminalamt, Wiesbaden, Germany
The layer sequence of multilayered white and off-white paint chips is sometimes difficult to discern when utilizing commonly employed microscopical methods. This layer sequence information becomes vitally important when comparing a questioned paint sample to a paint sample of known origin. Techniques such as reflected light micro-scopy, fluorescence micromicro-scopy, and scanning electron microscopy (SEM) coupled with energy dispersive x-ray spectrometry (EDS) may not provide the needed discrim-ination. The elemental information obtained by EDS is of limited value since elemental composition alone is not suf-ficient to identify pigments/extenders used in white and off-white paints or to distinguish between different phases. Also, binder information may not be available for com-parison since the thinness of the layers and the abundance of extender pigments may preclude analysis by Fourier transform infrared (FTIR) microspectrophotometry.
Cathodoluminescence microscopy (CLM) may provide the needed layer sequence information and discrimination when analyzing and comparing multilayered white and off-white paint samples. Cathodoluminescence is the emis-sion of radiation from the sample in the visible light region and neighboring wavelengths following excitation by elec-trons generated from a cathode electron gun. CLM provides further discrimination of the layer sequence of multilayered white and off-white paint samples since cathodolumines-cence is sensitive to phase differences, trace amounts of for-eign atoms, and other lattice imperfections.
Analysis of polished cross-sections by CLM was accom-plished utilizing a light microscope coupled with a vacuum specimen chamber and a cold-cathode electron gun. A comparison was made of the layer information obtained by
CLM, darkfield reflected light microscopy, fluorescence microscopy, and SEM-EDS of several architectural paint cross-sections.
Forensic Microscopy in Pharmaceutical
Manufacturing — Where Did Those Dark Spots Come From?
J.P. NEILLY, J.A. FAGERLAND, J.J. SZPYLMAN ANDW. DZIKI Abbott Laboratories, Pharmaceutical Products Division, Abbott Park, IL, USA
In pharmaceutical manufacturing, potent chemical com-pounds are combined with excipients to create dosage forms that are safe and effective. Manufacturing involves many complex operations such as milling, mixing, granu-lation, and tablet compression and coating. A variety of materials can be used as excipients including synthetic compounds, agricultural materials such as starch and sug-ars, and mined material such as talc. Occasionally, unwanted discoloration or dark spots can occur in the final products rendering them aesthetically unacceptable. Foren-sic microscopy methods such as polarized light micro-scopy (PLM), Fourier-transform infrared spectromicro-scopy (FTIR), scanning electron microscopy (SEM), and energy dispersive x-ray spectroscopy (EDS) can be used to deter-mine the source of dark spots that arise during manufac-ture of pharmaceutical products.1
During visual inspection of a new tablet formulation, small, black and silver-colored spots were observed on the tablet surface. Initial inspection with a stereomicroscope showed that the particles were opaque, silver-gray in color and very reflective. By SEM, their texture was determined to be primarily smooth with conchoidal fractures and many rough patches. EDS of the smooth areas detected only car-bon, while the rough patches contained carcar-bon, oxygen, magnesium, and silicon. SEM showed that the particles had the morphology of graphite,2and EDS indicated that the
rough patches were magnesium silicate or talc. Talc is known to contain graphite,3 and similar particles were
eventually found in the talc used in manufacturing this product.
Contaminants can be introduced during manufacturing. During recent production of an oral liquid, numerous black, irregular particles were found in a liquid pharmaceutical
Proceedings of SCANNING 2000
May 9–12, 2000
product. By EDS, the particles contained primarily carbon and fluorine with low levels of oxygen, sodium, and sili-con, suggesting that the particles might be part of a gasket or seal composed of fluoropolymer. However, SEM exam-ination showed that the particles had a unique fibrous struc-ture similar to that of expanded polytetrafluoroethylene (PTFE). In addition, several particles had adherent diatoms on them. The elemental composition, fine structure of the particles, and presence of diatoms identified the source of the contaminants as a PTFE/diatomaceous filter that had failed.
During stability testing of coated and uncoated tablets, dark spots formed on tablets after they were exposed to accelerated storage conditions (high heat and humidity). Examination with a stereomicroscope showed that the spots were actually holes where material had fallen out of the tablet. In addition, discoloration of the tablet and coat-ing material around the hole had occurred. Cracks radiated from the holes, and small yellow fibrous particles were pre-sent on the edges of the holes. EDS and x-ray mapping showed fibrous structures that contained sodium through-out discolored tablets and surrounding the holes. These structures were identified as croscarmellose, a disintegrant used in this formulation. The fact that they were on the edges of the holes suggested that they had performed their function by absorbing water and swelling.
The active compound in this formulation was a primary amine and contained sulfur that allowed unique localiza-tion by EDS and x-ray mapping. X-ray maps showed that the drug had migrated away from the holes and suggested that water based diffusion may have occurred. Lactose is known to turn brown when in contact with primary amines.3
Therefore, migrating drug may have reacted with lactose to form the brown spots.
Identifying the source of the water that caused the drug migration came from careful examination of the excipients. The only excipient that had particles approximately the size of the holes in the tablet was anhydrous citric acid, which is very hydroscopic.3Large citric acid particles on the
sur-face of normal tablets were identified by microscopic FTIR. The largest citric acid particles likely absorbed enough water to activate the disintegrant, cause diffusion of the drug, and facilitate reaction of drug with lactose to form the colored spots. Reducing the particle size of the cit-ric acid is being evaluated as a solution to this problem
These examples clearly show the utility of correlative microscopy for identifying the source of contaminants in pharmaceutical products.
References
1. Briton HG, Bogdonawich SJ, Bugay DE, DeVincentis J, Lewen G, Newman AW: Physical Characterization of Pharmaceutical Solids. Pharmaceutical Research 8, 963–973 (1991)
2. McCrone Particle Atlas, Electronic Edition PAE2 CD-ROM, 1992. 3. Wade A, Weller PJ eds., Handbook of Pharmaceutical Excipi-ents 2nded. American Pharmaceutical Association 124, 257
(1994)
An X-ray Spectral Database for Forensic Applications
DENNISC. WARD
FBI Laboratory, Washington, D.C., USA
The scanning electron microscope (SEM) with associ-ated energy dispersive spectrometer (EDS) is frequently used in the forensic laboratory to characterize the structure and elemental composition of a variety of materials of forensic significance. Most often the results of these exam-inations are applied comparatively. Absence of differences may indicate that the materials had a common origin. Con-clusions of this type require only temporal data acquisition. As with other developed spectroscopies (FTIR, MS), the usefulness of SEM/EDS is limited without the ability to archive spectra within a database utility. The FBI Labora-tory has designed such an X-ray database, consisting of storage, query, and display utilities unique to X-ray spec-troscopy. Associated with each spectrum is: 1. A descrip-tion of the material, including manufacturer criteria and physical characteristics, 2. Compositional characteristics, 3. Instrumental parameters, and 4. Image. Material classes are organized in a hierarchical tree. Database queries may be made by selecting any combination of descriptors and compositional characteristics, or by simply performing a “best fit”. The spectra returned from a query can be criti-cally compared in an interactive display.
This database application permits:
• retrieval of compositional and structural information regarding a specific item
• retrieval of compositional and structural information of materials with a few related characteristics • comparison of the composition of an unknown
mate-rial to that of standards, and
• determination of the variations of composition within a material class
Future development will include networking this data-base to other forensic laboratories.
Classification of Puncture Holes in Plastic Bottles by Light and Scanning Electron Microscopy: A Preliminary Study
S.F. PLATEK, N.RANIERI, J.B.CROWE ANDK.A. WOLNIK Forensic Chemistry Center, U.S. Food and Drug Administration, Cincinnati, Ohio, USA
An increasing number of cases involving accidental, misinterpreted, falsely reported and intentional acts of tam-pering with food and beverage products are investigated by the Forensic Chemistry Center (FCC) of the US Food and Drug Administration. The Federal Anti-Tampering Act of 1983 specifically addresses product tampering as well as
the false report of product tampering as a felony with sub-stantial fines and prison sentences.1,2Suspected tampering
cases are routinely submitted to the FCC for confirmation of breached or punctured containers with visible holes and the identification of any foreign substance introduced. Cases range from suspect holes in both product and con-tainer items including fruits3, plastic/paper wrapped food
items (exa.—bread, candy bars), plastic film wrapped items (exa.—meat and produce) and plastic bottles and metal cans. In a number of cases analyzed by the FCC, there have been associated threats of extortion, terrorism and both accidental and deliberate product tampering involving holes or punctures in product packaging. Identification of the object(s) used to make the holes has been demonstrated to reduce the initial analysis time and determine if the hole was consistent with known objects. The identification is also valuable in the follow-up investigation.
Plastic bottles made of a variety of relatively soft plas-tics are used to package numerous items including soft drinks, bottled water, milk, juice, cosmetics, pharmaceu-ticals, and cleaning products. A study was initiated at the FCC to investigate and classify holes in plastic bottles made by a variety of commonly encountered objects. Emphasis was placed upon items that could be used to inject or make a suitable hole for the introduction or removal of liquids. Thirty-eight (38) puncturing objects [including nails, screws, needles (syringe, sewing), tacks, pins, paper clips, tools, blades (knife, razor), staples, fish hooks, scissors, and punches] were used to produce simu-lated tampering holes in plastic bottles.
Each object was used to make a series of eleven holes in a 5 ×10-cm section of plastic soft drink bottle. Stereo-scopic (SLM), polarized light microscopy and scanning electron microscopy (SEM) were used to analyze and char-acterize each type of hole. The puncture holes were initially examined on both sides by SLM. It was determined the inner or eruption surface provided the most characteristic information.
SEM analysis provided additional characteristic infor-mation including that the cut/puncture surface revealed smooth cut surfaces for syringe, razor, scissors and knife tips. Thread cuts were visible on twisted screw holes and could be differentiated from screw punctures. The eruption surface around the inside edges of the holes provided char-acteristic shapes usually dependent on the cross-sectional profile of the penetrating object. Cut nail holes (regardless of size) could be differentiated from conical pin, tack and sewing needle holes. Figure 1 shows an example of sec-ondary electron images comparing characteristic puncture holes in a plastic soft drink bottle (interior surface) made by a 25-gauge syringe needle (A) and a sewing needle (B). Syringe needles produced characteristic holes form-ing a “sform-ingle eye lid” appearance while sewform-ing (conical) needles produced a symmetrical “double eye lid” appear-ance (Fig. 1). Staples and drill bits also produced unique hole eruption surfaces. The diameter of circular penetration objects could be also be approximated. The preliminary
results of this study show that there are a number of unique and identifiable characteristics in the eruption surfaces of holes in plastic bottles made by penetrating objects. Con-tinuing research at the FCC will include developing a com-plete method for hole classification and the preparation of a guide for the identification of puncture holes.
FIG. 1 Secondary electron images comparing characteristic punc-ture holes (interior surface) in a plastic soft drink bottle made by a 25-gauge syringe needle (A) and a sewing needle (B). Syringe nee-dles produced characteristic holes forming a “single eye lid” appear-ance while sewing (conical) needles produced a symmetrical “dou-ble eye lid” appearance. Bar markers = 0.5 mm
References
1. Federal Anti Tampering Act, Title 18, USC Section 1365, 1983 2. Fines Enhancement Statues of 1985, Title 18, USC Section
3571
3. Tomlinson JA, Crowe JB, Ranieri N, Kindig JP, Platek SF: Supermarket tampering: cocaine in syringes and in fruit. J.
Forensic Analysis of Diamonds and Diamond Simulants, An Unusual Case History
CARLN. BRUNO ANDSCOTTKOVAR
Nassau County Police Department, Scientific Investigation Bureau, Mineola, New York, U.S.A.
Scanning electron microscopy/energy dispersive X-ray spectroscopy (SEM/EDS) and energy dispersive X-ray flu-orescence spectroscopy (EDXRF) are qualitative and quan-titative non-destructive techniques utilized in forensic analysis for gunshot residue (GSR), metal alloys, powders, glasses, paints, etc. Present day software speeds up both image capture in SEM and qualitative/quantitative energy dispersive spectrometric analysis in seconds rather than minutes. An Amray 1000 SEM with EDAX DX Prime EDS and a Phillips PV 9500 XRF Spectrometer were the actual instruments utilized in this case study.
Interestingly, there have been very few, if any, papers or literature presented in the forensic community on dia-monds and diamond simulants.
The subject in this case started advertising appraisals for $49.95 and with the use of a discount coupon, he would appraise an unlimited number of items for only $24.95. The police department and Scientific Investigation Bureau got involved in February, 1993, when a complainant claimed her diamond was switched for a cubic zirconia (CZ) stone. A sting was set up with four diamond rings and a loose pear-shaped diamond (0.8 ct.), which was subsequently switched with a cubic zirconia simulant. The subject was indicted and plead guilty to eleven counts and received a jail term of 3–6 years for grand larceny and 2–4 years for insurance fraud.
The analysis of dozens of rings and pieces of jewelry, over a period of eight months, was made involving con-sultation with GIA (Gemological Institute of America); mapping inclusions of diamonds, utilizing a gemological microscope; measuring stones with micrometers and calipers; weighing stones; determining girdle and culet type; measuring refractive index, specific gravity, UV flu-orescence, and thermal conductivity. Diamonds are easy to tell apart from most simulants due to the fact that dia-monds have numerous inclusions as either imperfections (e.g. — cloud, cavity, feather, pit, pin point, cavity, etc.), or minerals (e.g. — colorless diamond, zircon, garnet [red], diopside [green], magnetite/hematite/chromite [black], chrome spinel [red], olivine [green], etc.). Also, diamonds typically have frosted girdles.
For these analyses we utilized a micrometer or caliper to measure table diameter, girdle diameter, and depth. The refractive index was measured directly by gemological microscope or gemological refractometer. The specific gravity was measured with a special diamond pan attach-ment to a weighing pan balance. A diamond proportion analyzer was used to measure table %, crown angle, crown height %, girdle thickness %, pavilion depth %, and total
depth %. Finally, a thermal conductivity instrument was used to determine whether a stone was a diamond simulant or not. Diamonds have the highest thermal conductivity, by far, of any mineral, except for moissanite, which is fairly close and would fool the older instruments (early 1990's). All this was necessary to characterize and individualize the stones from this particular case. It should be noted, how-ever, that none of the original diamonds was actually recov-ered except for the stone originally used for the sting.
In 1996, we became involved with SEM/EDS and XRF, and have since analyzed simulants to determine their chem-ical composition. Some examples of various simulants are: CZ (ZrO2). YAG (Y3Al5O12), sapphire (Al2O3), topaz (Al2[F/OH]2 SiO4), quartz (SiO2), rutile (TiO2), spinel (MgAl2O4), strontium titanate (SrTiO3), zircon (ZrSiO4), GGG (Gd3Ga5O12), and moissanite (SiC). The use of XRF is necessary for analysis of trace elements down to 10-100 PPM and LA-ICP/MS, an expensive instrument, would be best suited down to PPB and PPT (parts per trillion).
Forensic analysis of jewelry settings to determine alloy content, and whether or not a gold alloy is only a plating, can also be done either instrumentally (SEM/EDS, or XRF) or by touchstone (basalt) testing utilizing known gold touch needles and appropriate acids. Through the years we have analyzed alleged gold bars (brass), gold plated coins, and other counterfeit metal items.
Case Studies in Gunshot Residue Analysis by SEM/EDX
JAMESD. GARCIA ANDMICHAELV. MARTINEZ
Bexar County Criminal Investigation Laboratory, San Antonio, Texas; Bexar County Criminal Investigation Laboratory, San Antonio, Texas, USA
The use of scanning electron microscopy/energy dis-persive x-ray (SEM/EDX) analysis in criminal investiga-tions has proven to be a very important tool in a variety of criminal cases. With the advent of automated systems, the ability of the forensic scientist to analyze a variety of foren-sic samples has increased and improved the use of SEM/EDX systems. The Bexar County Criminal Investi-gation Laboratory in San Antonio, Texas, has employed the use of automated SEM/EDX analysis since 1996. The pri-mary use of the automated system is for the detection of primer gunshot residues from a wide assortment of possi-ble sources. Three cases where automated SEM/EDX tech-nology was used to detect for primer gunshot residue from locations other than the hands of a suspect or a victim show the versatility of its forensic importance. Case one deals with primer gunshot residue detected on a leaf found at a homicide crime scene. The results of the analysis aided in solidifying the reconstruction of a fatal gunshot wound
to the back of the head followed by several “coup-de-grâce” shots. Case two deals with primer gunshot residue found on the interior of a vehicle, on the sleeve of a jacket and the right hand of a subject involved in an unusual drive-by shooting. The final case deals with primer gunshot residue detected on latex gloves used in one the largest mass murders by the “Mexican Mafia” in San Antonio history. These three cases represent novel forensic approaches using modern technology with simple sample collection techniques of commercially available carbon tape sam-pling devices. The samples were analyzed at an approxi-mate magnification of 350 at 20 KeV and a working dis-tance of 10 mm.
Can Gunshot Residue Indicate the Type of Ammunition Fired?
JOZEFLEBIEDZIK
Advanced Research Instruments Corp., Wheat Ridge, Colorado, USA
The presence or absence of gunshot residue (GSR) on the hand of a suspect can be easily and rapidly determined by SEM-EDX analysis if the sample is collected shortly after a weapon is fired.1, 2To determine what type of
ammu-nition was fired is more difficult and in some instances may be impossible. However, a comprehensive GSR analysis can point to a specific ammunition.
A careful study of GSR and supporting particles reveal a number of indicators typical to a specific type or a fam-ily of fired ammunition. This type of investigation requires a sufficient amount of each type of available ammunition to be fired from a clean weapon to collect statistically sig-nificant data. The job is much more time consuming than the GSR analysis alone, since it requires analysis of all par-ticles not just the high density ones as is the case for GSR analysis.
There are two basic indicators that may be combined to lead us to the type of fired ammunition. The two indicators are morphology and composition of the supporting parti-cles. The morphology of GSR particles points to a family of possible ammunition and the composition of the sup-porting particles may reveal the type of bullet fired or a spe-cific type of ammunition.
To illustrate this approach we limit our focus to large GSR particles only. In the SEM, they are easy to find and can provide us with the first estimate.
The morphology of GSR particles greater than several micrometers can be divided into three basic groups:
1. Spheroid forming. This is typical for Russian, Chi-nese, Czech 9mm or PMC ammunition.
2. Irregular shapes. Typical for Winchester, Mag Safe +P+, Federal Hydra Shok, CCI Blazer.
3. Mixed shapes. Other types.
Each group may be divided into subgroups based upon more subtle morphological differences, but more data may need to be collected to form a reliable conclusion.
The composition of GSR supporting particles, expressed as scanned area fraction in parts per million, indicates the concentration of any given type of particle. This number is routinely available from the image/x-ray analyzer. For example, lead area fraction divided by GSR area fraction yields the relative lead concentration to GSR in the sam-ple. If this value is less than one, implying low lead con-centration, this indicates jacketed bullet (typically around 0.1). If the value is greater than one (typically 5-30) this indicates a lead bullet. Using relative concentration value rather than absolute values dramatically reduces the data spread due to various sampling or collection errors.
To distinguish .22LR Federal from Remington ammu-nition is easy. The .22LR Federal has a copper plated lead bullet while Remington has a brass plated lead bullet. If the ratio of copper-lead particles expressed as area fraction to brass-lead particles is greater than one, it is from Federal ammunition. If less than one it is from a brass plated Rem-ington.3
Another example of identification of specific ammuni-tion is the significant presence of strontium. If the stron-tium concentration is half or more than that of GSR, cou-pled with unusually low lead presence, this points directly (regardless of morphology) to 9mm CCI Blazer “lead free” ammunition.4
These preliminary results indicate that there is enough information in the GSR and supporting particles to deter-mine, in some cases, the origin of the fired ammunition. The next step is to refine the system of clues which will converge to a specific ammunition applicable to larger variety of ammunition.
References
1. Meng HH, Caddy B. Gunshot Residue Analysis-A Review. J Forensic Sci 1997; 42(4):553-570.
2. Lebiedzik J, Johnson DL. Rapid Search and Quantitative Analy-sis of Gunshot Residue Particles in the SEM. J Forensic Sci 2000;45(1):83-92.
3. Wrobel H A, Miller J J, Kijek M. Identification of Ammunition from Gunshot Residue and Cartridge Related Materials-A Pre-liminary Model Using .22 Caliber Rimfire Ammunition. J Foren-sic Sci 1998;43(2):324-328.
4. Zeichner A, Schecter B, Brener R. Antimony Enrichment on the Bullets= Surface and the Possibility of Finding It in Gunshot Residue (GSR) of the Ammunition Having Antimony-Free Primers. J Forensic Sci 1998;43(3): 493-501.
Fact of Friction: Putting the Brakes on Gunshot Residue
J.R. GIACALONE
West Virginia State Police Forensic Laboratory, South Charleston, West Virginia, USA
Microtrace particle analysis of gunshot residue (GSR) is accomplished by utilizing scanning electron microscopy coupled with energy dispersive x-ray spectroscopy (SEM/EDS).1The identification of these micron size
par-ticles on the hands and/or face of a suspect by a crime lab-oratory has had forensic value for the past two decades. This value is attributed to the fact that when the primer in a round of ammunition is detonated, the resultant residue products are unique.2The quest to identify hobby’s,
occu-pations, and activities which may involve GSR-like parti-cles has been explored.3Over the past several years
how-ever, two different non-firearm related sources have been documented as having the potential ability to produce residue which can be construed as GSR.4,5
Friction materials are one of these sources and they are commonly encountered in brakes and transmissions. Their formulations can have ingredients that may produce residue akin to GSR. Primer compositions containing lead, barium, and antimony compounds yield conglomerate residue par-ticles of these elements when they mix in the vapor phase during the discharge.6
There exists friction material formulations which have a myriad of resins, binders, fillers, and metallic flakes.
The wheel is hailed as one of the greatest inventions but its value and usefulness are minimized unless it can be con-trolled by slowing and stopping. Therefore, with the advent of the wheel arose perhaps a more important invention — the brake. Brakes are by far the most important mechanism on any vehicle because the safety and lives of the passen-gers depend on the proper operation of the braking system.7
Brakes are energy absorbing mechanisms that, on demand, slow a moving object. Friction, which converts kinetic energy (motion) into thermal energy (heat), is one way to achieve this and is the most popular method for general pur-pose clutching and braking. Leonardo da Vinci was one of the earliest scholars of tribology and undertook systematic studies on friction.
This study focuses on friction material formulations. Samples of brake lining from various wheeled vehicles ranging from bicycles to airplanes were gathered and ana-lyzed by SEM/EDS under the same parameters which are utilized for the identification of GSR. The friction mater-ial specimens originated from ‘new’, unused pads and from worn, used ones. Sample preparation simply involved dabbing the brake friction material using a pin mount cov-ered with double-sided carbon adhesive tape. The speci-mens were manually searched at magnifications ranging from 40–4000 times. This afforded the opportunity to locate, analyze, and record particles which are
representa-tive of the respecrepresenta-tive friction material ingredients. Where possible the MSDS sheets were obtained to assist in cor-relating the findings. A variety of inorganic elements were catalogued during this research. One disc brake pad encountered is a sintered kevlar/carbon graphite type that contains lead/barium/antimony in its composition.
The existence of non-firearm sources of lead/barium/ antimony particles necessitates a reevaluation of the uniqueness of such residue and their implication with dis-charge residue (GSR). Though the majority of primer residue encountered consists of lead/barium/antimony, there are other formulations in older, foreign, and newly developed ‘lead-free’ ammunition that have yet to be encountered in friction materials. The inclusion of alu-minum, copper, and/or zinc with lead/barium/antimony particles will maintain their uniqueness to a firearm origin. Morphology can also play a role in evaluating the creation and origin of these particles. It is strongly advised and increasing useful to examine the residue remaining in the spent cartridge casing involved in the crime. By using this as a ‘known’ it can be used to compare the ‘questioned’ residue formulations detected on the suspect’s evidence.
The importance of microtrace particle analysis by SEM/EDS continues to grow in forensic science. It pro-vides the capability to identify particulate residue from var-ious sources and allows them to be associated with specific circumstances, environments, and scenarios.8The
objec-tive of a criminal investigation is to link both the crime scene with the suspect and the suspect to the crime scene. Forensic science with its cornucopia of technological, ana-lytical, and sensitive comparison examinations provides the avenue to establish these connections and SEM/EDS is a vital tool in the law enforcement arsenal.
References
1. White RS, Owens AD: Automation of gunshot residue detection and analysis by scanning electron microscopy/energy dispersive x-ray analysis (SEM/EDX). J Foren Sci JFSCA 32, No. 6, 1595-1603 (1987)
2. Wolton GM, Nesbitt RS, Calloway AR, Loper GL, Jones, P: Final Report On Particle Analysis For Gunshot Residue Detection, Aerospace Corporation, El Segundo, CA, 1977, ATR-77, 7915-3 3. Wolton GM, Nesbitt RS, Calloway AR, Loper GL, Jones, P: Par-ticle analysis for the detection of gunshot residue: II: Occupa-tional and environmental particles. J. Foren Sci 24 No. 2, 533-545 (1979)
4. Mosher PV, McVicar MJ, Randall ED, Slid EH: Gunshot residue similar particles produced by fireworks. Can Society Foren Sci J 31, No. 2, 157-168 (1998)
5. Garofano L, Capra M, Ferrari GP, Bizzaro D, Di Tullio D, Dell’Olio A, Ghitti A: Gunshot residue further studies on particles of environmental and occupational origin. Foren Sci Intl 103, 1-21 (1999)
6. Basu S: Formation of gunshot residue. J Foren Sci 27, No.1, 72-91 (1982) 7. Halderman JD, Chase MD: Automotive Brake Systems, 2nd ed,
Chapter 2, Prentice Hall, NJ (2000)
8. Giaclone JR: Scanning electron microscopy/energy dispersive x-ray analysis (SEM/EDS) of forensic microtrace particles col-lected on carbon-conductive adhesive tape. Scanning 19, 232-233 (1997)
Activities of the European Network of Forensic Science Institutes Working Group “Firearms” with Special Focus on European Gunshot Residue Work
LUDWIGNIEWÖHNER
Dept. of Gunshot Traces, Forensic Science Institute of the Bundeskriminalamt, Wiesbaden, Germany
ENFSI is the abbreviation of the European Network of Forensic Science Institutes (ENFSI), and was founded in 1993 by the directors of 9 national forensic science labo-ratories in Europe. Currently more than 40 directors of European forensic labs are ordinary members of that orga-nization or are just applying for a membership.
The aim of ENFSI is to promote co-operation between list members and their laboratories. This is achieved through:
• discussion of managerial questions, effective utiliza-tion of forensic science, scientific development, and standards of practice
• exchange of quality assurance methods and proce-dures, training, and scientific exchange programs • and co-operation with other international
organiza-tions.
Therefore special working groups were established for the different forensic fields of work. The ENFSI working group “Firearms” was approved by the ENFSI Board in 1995, and covers the fields of firearm examination, gunshot residues (GSR), evaluation of shooting distances, and bal-listics. Currently, representatives of 28 ENFSI members are attending the annual working group meetings.
Within the common framework for ENFSI working groups, the working group “Firearms” is actually promot-ing the followpromot-ing projects:
• establishing international data collections on GSR and firearms with access to all working group members • preparing and performing a proficiency test on GSR • coordinating the interpretation of results
• combining research activities and providing education and training.
Working groups report on the European proficiency test activities, including the preparation of identical GSR test samples and examples of some of the European research projects on GSR.
Preparation of an In-house GSR Standard WAYNED. NIEMEYER
McCrone Associates, Inc., Westmont, Illinois
Using automated analysis software to identify gunshot residue (GSR) particles in the scanning electron micro-scope (SEM) requires careful quality assurance of the
sys-tem. In addition to checking the qualitative and quantita-tive performance of the energy dispersive X-ray (EDX) sys-tem one must also ensure SEM performance such as stage positioning, brightness/contrast, and beam current para-meters.
Simple particle manipulation techniques can be used to prepare a custom GSR standard to conform with the par-ticular SEM in use at the laboratory. The work can be per-formed using a stereo microscope with at least X80 mag-nification capability.
Procure a spent cartridge casing and a copper jacketed bullet. Using a stiff needle or pick, gently scrape the inside of the cartridge casing near the primer and lower sidewall. Invert the cartridge over a glass petri dish and gently tap the side of the cartridge to force the powder out into the dish. Over separate petri dishes use a fine file to produce particles of brass from the casing and copper/lead from the bullet. As an option, cut the bullet open to expose the lead and file off particles.
Prepare another petri dish with iron (or other low aver-age atomic number material) filings. Keep the petri dishes covered and stored in a secure area for future use to pre-pare more references if necessary.
Prepare a “very fine” grade tungsten needle by sharp-ening a 24-gauge (0.52mm) tungsten wire1. Place the
nee-dle into a suitable neenee-dle holder. Attach a 12mm diameter double sided carbon tape (preferably with a smooth surface) to a SEM stub. Scribe a grid onto the tape using a stiff nee-dle or probe. Use the stereomicroscope to locate sub-10 micrometer dark, shiny spherical/ellipsoidal particles in the petri dishes. Carefully insert the needle into the field of view and, while maintaining about a 20-30 degree angle, touch the needle on the particle. While keeping the needle in the field of view, move the dish aside, place the SEM stub into the field of view, and place the particle on the tape in a grid square. Continue this process until particles repre-senting all types are mounted.
Prepare the reference SEM stub in the same manner as for submitted SEM GSR kits. Set the SEM parameters (BEI, accelerating voltage, beam current) for optimized imaging for GSR analysis. If parameters are unknown, use the iron particles to adjust the graylevel to about 100 (measured in the EDS imaging window). In the SEM locate each particle, note the stage coordinates, graylevel inten-sity, and collect an EDS spectrum. Upon completion of the manual search, set up the automated parameters and appro-priate measurements and run the test on the reference stub. Compare results to the manual search, especially stage coordinates to ensure that one particle is not being counted twice or more in overlapping fields of view.
With proper care, the in-house SEM GSR standard will last for many years.
Reference:
Teetsov, Anna: Preparation and Use of Needles and Micropipets for Handling Very Small Particles, Microscopy Today, #00-2, 8-16, February/March 2000.
Food Structure and Functionality
Symposium
Effects of Microfluidization on the Matrix of Mozzarella Cheeses
P.H. COOKE, M.H. TUNICK, E.L. MALIN
Eastern Regional Research Center, Agricultural Research Service, U.S. Department of Agriculture, Wyndmoor, PA, USA
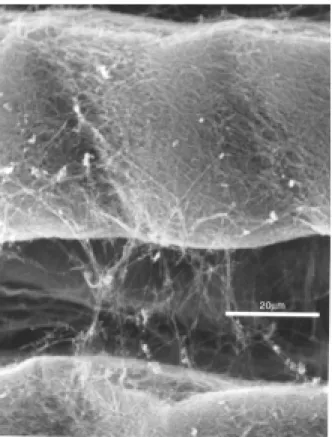
The complexity of physical and chemical properties of milk products offers many opportunities to develop new and unusual formulations. Special functional characteris-tics can be developed through novel processing and engi-neering. In traditional Mozzarella cheeses the milk proteins form an extensive, continuous phase separated by a dis-continuous phase filled with milk fats, and the interface between the phases contains most of the microbial popu-lation. Spatial dimensions of features in both phases range from 10–3 to 10–6 m. The arrangement and composition of
the phases apparently regulates the physical properties of the product, so an understanding of the molecular interac-tions within and between the phases could provide many important clues to guide further design. We have examined the structure of the protein matrix in Mozzarella cheeses in order to understand the effects of various compositions and processing steps on functional properties. Integrated microscopic imaging (SEM, TEM and AFM) and image transformation indicate that the matrix contains a pervasive structural repeat, around 10–8m, similar to the dimensions
of casein subunits observed in milk micelles and casein-ates1. Studies using different rennets and processed sources
of milk protein show that organization related to the sub-unit-repeat changes during a few weeks of refrigerated storage, suggesting a link between molecular organization and other measurable, functional properties2–4.
Microfluidization of milk changes the basic structural organization of Mozzarella cheeses. For extreme parame-ters of both temperature and pressure (173 MPa/54 C), this processing approach transforms the typical two phase structure into a persistent emulsion with resolved features on a nanometer scale and functional properties that are not typical (5). Microscopic imaging reveals that the 15 nm subunit-repeat in the continuous phase is restricted to small areas, intercalated among numerous small fat droplets ranging from 20 to over 200 nm in diameter. Many of the protein subunits are distributed at the interface of the fat droplets, and this atypical pattern of organization does not change after 6 weeks of refrigerated storage. Moderate conditions (104 MPa/43 C) of homogenization result in fewer, larger droplets with a broader range of sizes, and minimal conditions (35 MPa/10 C) result in products that resemble the classical structure of Mozzarella. The results indicate that microfluidized milk under the extreme
con-ditions does not produce typical Mozzarella cheeses, but suitable conditions might be found for designing a variety of other nanostructured milk products with advantageous functional properties.
References
1. Cooke PH, Tunick MH, Malin EL, Smith PW, Holsinger VH: Electron-density patterns in low-fat Mozzarella cheese during refrigerated storage. In Chemistry of Structure- Function
Rela-tionships in Cheese, (Eds. Malin EL and Tunick MH). Plenum
Press, NY (1995) 311-320
2. Tunick MH, Mackey KL, Sheih JJ, Smith, PW, Cooke PH, Malin EL: Rheology and microstructure of low-fat Mozzarella cheese. Intl Dairy J 3, 649-662 (1993)
3. Tunick MH, Cooke PH, Malin EL, Smith PW, Holsinger VH: Reorganization of casein submicelles in Mozzarella cheese dur-ing storage. Intl Dairy J 7, 149-155 (1997)
4. Tunick MH, Cooke PH, Malin EL, Smith PW, Holsinger VH: Imaging of casein submicelles in Mozzarella cheeses by trans-mission electron microscopy. Amer Lab 30,44-47 (1998) 5. Van Hekken DL, Smith PW, Tunick ML, Malin EL, Holsinger
VH: Textural properties of Mozzarella cheeses from milks with 1 or 3.2% fat homogenized at varying pressure and temperature.
J Dairy Sci 82(Suppl 1)19 (1999)
The Stabilisation of Air in Foods Containing Fat — A Universal Mechanism
B.E. BROOKER
Institute of Food Research, Colney Lane, Norwich, UK Many foods owe their characteristic rheological and organoleptic properties to the presence of an entrapped gas phase. Although some such foams are stabilised only by an adsorbed interfacial film, usually of protein, most foams owe their stability to the additional presence of fat. In the latter, complex interactions between fat and protein at the gas-water interface produce structures that are responsible for the observed stability.
In the case of foods containing globular fat, such as cream or confectionery emulsions, the incorporation of air produces a protein stabilised air-water interface and at the same time, globules of fat become permanently attached to the bubble surface as a result of coalescence of the air-water and fat-air-water interfaces. In the case of whipping cream, additional globule-globule interactions produce a series of cross links between bubbles that form a stable three-dimensional structure in which de-stabilisation caused by drainage is minimised. Similar fat-protein inter-actions can and have been demonstrated in toppings, frozen desserts, confectionery products and ice cream.
In some of these systems where a disperse fat phase is produced in the presence of highly surface active mole-cules, such as phospholipids or emulsifiers, an additional process takes place. The reduction in surface tension at the fat globule surface results in the ejection of fat crystals into the aqueous phase. In the course of this process the
crys-tals become enveloped in a layer of the oil-water interface and as a result become hydrophilic in their behaviour; e.g., they do not aggregate in aqueous systems. When gas is incorporated into the emulsion, the behaviour of hydrophilic crystals is similar to that observed for globules in that they become attached to the surface of bubbles in large numbers by the coalescence of the air-water and crystal-water interfaces. In foods such as desserts and bak-ery batters and doughs, crystal attachment allows the entrapment of large volumes of air by encouraging the sta-bilisation of small bubbles that would otherwise de-stabilise because of the high pressure of gas inside them.
In the case of baked products, crystal attachment to bub-bles has another important significance. During baking, the fat crystals melt and leave behind their crystal-water inter-face that is incorporated into the bubble surinter-face as the lat-ter expands. Without this source of additional inlat-terface, bubbles in baked systems undergo one of two fates, neither of which is consistent with the formation of high volume products with fine crumb structure. They either break, allowing entrapped gas to escape from the system or they must coalesce with neighbouring bubbles to increase the ratio of their surface to volume. The attachment of crystals to bubbles in these products must therefore be seen as a mechanism for the transfer of interfacial material from the surface of fat droplets to bubbles.
It can thus be seen that in the many food systems con-taining globular fat and/or hydrophilic fat crystals, bubble stabilisation involves attachment of the fat phase to their surfaces by a common mechanism that involves coales-cence of the air-water interface with the interface at the sur-face of the fat phase. For foods containing soluble protein and a fat phase, this mechanism is universal.
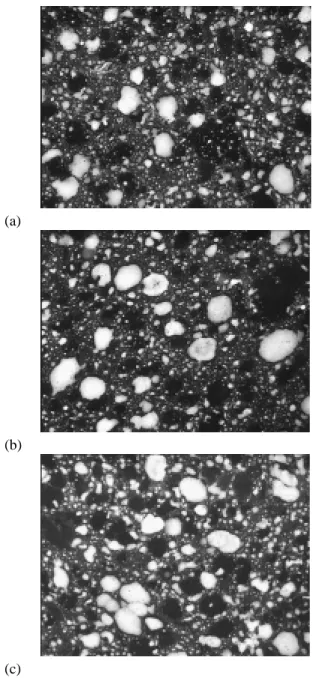
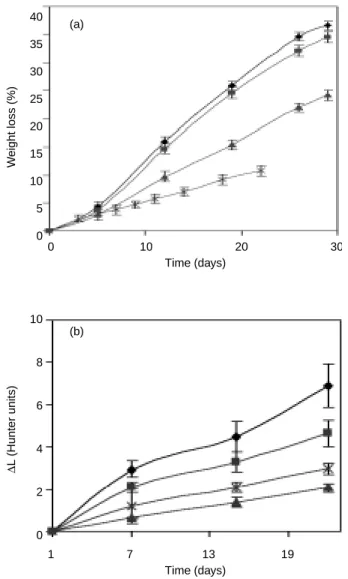
A Study of Fat Bloom and Anti-Bloom Agents KATHYGROVES, P.J. SUBRAMANIAM, R.A. CURTIS, M.E. SAUNDERS, O.C. MURPHY
Leatherhead Food Research Association, Leatherhead, Surrey, England
This paper presents the results of a study of the effects of incorporation of four different anti-bloom fats and but-terfat on the fat bloom development in tempered plain chocolate containing cocoa butter.
Bloom is the general term used to describe the crys-tallisation of either fat or sugar on the surface of chocolate. Fat bloom on chocolate is normally preceded by a loss of gloss and is visually apparent as white areas on the surface of the chocolate. The development of fat bloom is a prob-lem in chocolate products but can occur in other fat systems and compound coatings.
Cocoa butter is polymorphic fat and can therefore form different crystalline or liquid-crystalline structures with different melting points. It is widely published that there
are six polymorphic forms, although some research has postulated only four forms. Merken & Vaeck (1980) sug-gest that form III is a mixture of forms II and IV, and Fincke (1955) and Hernqvist (1987) claim that form VI is the same as form V except for the separation of the liquid triglyceride portion, making the form VI a higher-melting form. The most preferred form is form V as it has been found to give the highest level of contraction and gloss. In a well-tempered chocolate the transformation of form V to the more stable form VI has been identified as the cause of bloom using X-ray diffraction (Cebula & Ziegleder, 1993). Using microscopy it was found that the crystals in bloomed chocolate are identical to those in form VI cocoa butter (Jewell, 1974; Cruickshank & Jewell, 1977; Timms, 1984).
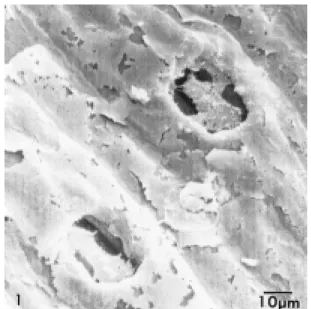
If, as is thought, the formation of bloom is a solid-state transformation, then anything that increases the liquid fat phase, such as butterfat, will delay bloom (confirmed in practice). However, this is not always so, as some liquid fats e.g. olive, and almond oil, accelerate the transformation to form VI (Timms, 1984). Published literature shows that many different ingredients could have anti-bloom proper-ties. A common approach is the addition of butterfat. How-ever, this has the negative effect of softening chocolate tex-ture. This has led to the search for other anti-bloom agents. In this study, the effects of addition of anti-bloom fats were evaluated in a standard plain chocolate. The aim was to see how these fats affected bloom development under dif-ferent storage conditions. Six batches of chocolates were made, with cocoa butter (control), butterfat and four anti-bloom fats. The products were stored under different stor-age conditions. Gloss was assessed visually and hardness was measured using a Stable Microsystems TAXT2 Tex-ture Analyser. Melting profiles of the chocolates were assessed after 1 week’s storage at 20°C using a TA Instru-ments DSC 2920. Melting profiles of the different choco-lates were used to estimate the percentage of liquid fat in the samples at 20°C and at 28°C. Bloom development was assessed using a stereomicroscope, and the surfaces of the chocolates were examined by cold-stage scanning electron microscopy.
The anti-bloom fats were found to be better at delaying bloom formation than butterfat and gave acceptable gloss. Three of the fats were similar in terms of hardness to the control, and one was similar to butterfat. Microscopy showed interesting differences in the size and shape of the bloom crystals and in their distribution over the surface. Accelerated storage conditions produced some very long needle-like crystals in the control and some of the other samples, possibly due to fractionation of the fat. These crys-tals had not been seen before in bloomed chocolate and may have been due to the fractionation of the cocoa butter dur-ing bloom development.
This work has shown some interesting effects of certain anti-bloom fats on texture, behaviour and bloom crystal appearance. Further work on the effects of anti-bloom fats in other products should advance understanding of choco-late stability further.
References
1. Cebula D. J., & Ziegleder, G. (1993). “Studies of bloom for-mation using X-ray diffraction from chocolates after long term storage”. Fett Wissenschaft Technologie, 95 (9), 340–3 2. Cruickshank, D. A. Jewell, G. G. (1977). “Structural studies on
tempered cocoa butter”. Leatherhead Food RA Research Reports No. 256.
3. Fincke, H. (1955). Zucker-und Süsswarenwirtschaft, 8, 140–3 4. Hernqvist, L. (1987). “Chocolate temper” in “Industrial Choco-late Manufacture and Use”. Ed. S.T. Beckett, pp159–71. Blackie USA and Canada: Van Nostrand Reinhold Company, New York. 5. Jewell, G. G. (1974). “Electron microscopy of chocolate. Part I. Structure of bloom on plain chocolate”. Leatherhead Food RA Research Reports No. 202.
6. Merken, G. V. & Vaeck, S.V. (1980). “Study of polymorphism in cocoa butter by differential scanning calorimetry”. Lebens-mittel-Wissenschaft und Technologie, 13 (6), 314–7
7. Timms, R.E. (1984). “Phase behaviour of fats and their mix-tures”. Progress in Lipid Research, 23 (1), 1–38.
Fundamental Characteristics and Utilization of Milk Whey Protein
NAOFUMIKITABATAKE
Research Institute for Food Science, Kyoto University, Kyoto, Japan
Whey proteins from bovine milk are used for bakery, dairy, beverage, meat, and fish products as additive to improve and keep quality of products. The properties of heat-induced gels made from whey proteins are influenced by the heating conditions: protein concentration, pH, and heating temperature. Salts also affect the gelation of whey proteins, and the properties of the gels. Whey protein iso-late (WPI) give a transparent gel or sol by heating under spe-cific condition, although heat treatment usually produces a turbid suspension or gel. Heat-denatured protein molecules are in a soluble form in these transparent gels or sols, which are generally superior to their turbid counterparts as food materials. Preheated WPI under salt-free conditions, that is, transparent liquid, produces a transparent gel upon reheat-ing in the presence of NaCl. This preheated WPI material, process whey protein (PWP), not only has properties sim-ilar to those of WPI over a wider range of conditions, but also has other novel characteristics as a food ingredient. The PWP can produce a transparent gel or a viscous liquid even at room temperature and can produce either a stable emul-sion or an emulemul-sion gel only by addition of salt. PWP is already being used in several processed foods because of superior functionalities. The PWP appears to consist of soluble linear aggregates of heat-denatured whey protein molecules. Such fine-stranded structures have been observed in heated ovalbumin and bovine serum albumin. Those fine-stranded structures might correspond to linear aggregates of heat-denatured globular protein molecules.
To clarify the details of the functionality of PWP the puri-fied B-lactoglobulin A was used for further investigation. The
B-lactoglobulin A preheated under salt-free condition gives transparent liquid on heating and produces a transparent gel upon reheating in the presence of NaCl as well as PWP.
WPI is believed to be a digestible protein ingredient because it is used for infant formula. However, B-lac-toglobulin in WPI cannot be hydrolyzed by pepsins, includ-ing porcine, rat, bovine, human, carp pepsin in vivo and in vitro. On the other hand, B-lactoglobulin in PWP is easily hydrolyzed by any kind of pepsin. This means that PWP is more digestible in the stomach than WPI. Other protein components except B-lactoglobulin can be easily hydrolyzed by pepsin. Based on this results, we developed a new method to purify B-lactoglobulin from WPI using crude porcine pepsin. Using this method, a large quantity of native toglobulin was purified and a nutritional test of native B-lac-toglobulin and heated B-lacB-lac-toglobulin was done with rats. This test showed that the heated B-lactoglobulin is superior to unheated B-lactoglobulin for growth of rats.
Protein-protein Interactions during the
Manufacture and Storage of Dried Milk Powder A.B MCKENNA
New Zealand Dairy Research Institute, Palmerston North, New Zealand
The protein-protein interactions that occur during man-ufacture of milk powder products have a major influence on solubility. During standard powder manufacture, these protein interactions occur when the casein micelles come into close contact at the surface of fat globules and during concentrated heating.
FIG. 1 Transmission electron micrograph of high protein skim milk powder showing fused casein micelles on the surface of the powder particle. FC = fused casein micelles. Bar = 0.2 µm.
During manufacture of high protein powders, the protein interactions occur when lactose is removed during ultra-filtration and diaultra-filtration forcing the casein micelles close together. Upon spray drying the formation of an air/water interface is instrumental in forcing protein components into close contact. The interactions between proteins con-tinue upon storage of the dry powders. This is particularly the case at the surface of the particles and at higher stor-age temperatures (Fig. 1).
Influence of Composition and Process Conditions on Microstructure of Amorphous Starch/Protein Powders
ANNEMARIESCHOONMAN,* GUYMAYOR,* CHRISBISPERINK,† JOBUBBINK*
*Nestlé Research Center, CH-1000 Lausanne 26, Switzerland; †Current affiliation: DMV International, 5460 BA Veghel, The Netherlands
An important goal of food research is to develop desir-able food structure and texture. Structure and texture in food are the result of interactions among the food compo-nents and the phase transitions induced in them during processing and storage. Here, we present an investigation of the physical and structural properties of maltodex-trin/sodium caseinate powders as a function of composi-tion and processing condicomposi-tions.
Surface area, density and porosity of powders are known to be strongly affected by processing, composition, parti-cle size, temperature and storage conditions. Nitrogen adsorption data were compared with data obtained from density measurements and with microscopic observations from image analysis. Powders are obtained by spray and freeze drying and differ in the volume of nitrogen injected into the maltodextrin DE 12 / sodium caseinate concentrate prior to drying. The percentage of proteins in the powders was also varied.
Nitrogen adsorption data were used to calculate the sur-face areas of various dried powders utilizing the Brunauer, Emmet and Teller (BET) method. Differences in the struc-ture of dried foams, as affected by the composition of the powder and the volume of gas injected during the foaming process, were correlated with a variation in specific surface area. Measured surface areas were all below 5 m2/g but
var-ied by two orders of magnitude. The differences in surface areas are attributed to porosity effects and formation of cracks. The surface area increased with increasing vol-ume of nitrogen injected and increasing amount of proteins in the powder.
Helium pycnometry measurements and microscopic data showed a strong influence of the percentage of sodium caseinate added to the concentrate on the porosity and microstructure of the powders. An increasing amount of sodium caseinate leads to higher porosities in powders
with the same volume of nitrogen gas injected. As expected, the amount of nitrogen gas injected prior to drying is an important factor controlling the microstructure and bubble size distribution of the foam. A higher volume of injected nitrogen gas increases both the open and the closed poros-ity and diminishes the thickness of the wall between adja-cent cells.
The bubble size distribution is shown to be different in freeze-dried and spray-dried powders. Freeze-dried pow-ders show a more homogeneous distribution of the pores in the matrix.
Monitoring Moisture Mobility and Migration in Model Bilayered Food Systems by NMR, MRI, and Mechanical Assessment
YOAWANG, IRWINA. TAUB ANDANNBARRETT Combat Feeding Program, Natick Soldier Center, US Army SBCCOM, Natick MA
Model multi-layered food systems were designed in order to mimic the structure of actual sandwich-type prod-ucts in which moisture content and water activity differ. Such a water activity gradient is the driving force for migra-tion of moisture, which can affect product characteristics and stability.
In a model bread-barbeque chicken bilayer system, time-domain proton (1H) nuclear magnetic resonance was
employed to monitor the change in mobility of water in both layers1, and also the migration of water from filler to
bread. Specifically, the NMR longitudinal relaxation time (T1) of water in the filler was initially higher than that in the bread; however, this difference was lessened after stor-age, indicating migration of water into the lower water activity bread layer. Migration was faster at high temper-atures and was also retarded by incorporation of glycerol, which reduced water activity in both bread and filler. Mois-ture distribution profiles were furthermore visually cap-tured through magnetic resonance imaging2. A linear
rela-tionship between proton NMR T1 relaxation time and sample moisture content was determined, which provides a non-invasive method to assess moisture content in com-plex food systems.
In model bread-cheese sandwich systems, in which water activity gradients were varied by bread glycerol con-tent, measurements of moisture migration were coupled with textural assessment of both the constructed sand-wiches and individual components. Compressive force-deformation functions of components, prior to and after storage, were used to mathematically construct predicted force-deformation relationships of the composites3.
Dif-ferences between the predicted and actual force-deforma-tion funcforce-deforma-tions were due to, and can be predictive of, migra-tion of moisture.
These advanced techniques can be used to monitor and to assess the physical effects of water mobility/migration in multilayer foods.
References
Belton PS, Colquhoun IJ, Hills BP: 1993. Application of NMR to Food Science. In: Annual Reports on NMR Spectroscopy. Pp. 1-53. G.A. Webb, Editor. Academic Press, London.
Schmidt SJ, Lai HM: 1991. Use of NMR and MRI to Study Water Relations in Foods. Pp. 405-452. In: Water Relationships in
Food. H. Levine and L. Slade, Editors. Plenum Press, New
York.
Peleg M: 1993. Calculation of the Compressive Stress-Strain Rela-tionships of Layered Arrays of Cellular Solids Using Equation Solving Computer Software. Journal of Cellular Plastics, 29:286-293.
Cryo-Electron Microscopy in the
Biomedical Sciences
Electron Cryomicroscopy of Biological Assemblies WAHCHIU
National Center for Macromolecular Imaging, Verna & Marrs McLean Department of Biochemistry and Molecular Biology, Baylor College of Medicine, Houston, TX, USA
Introduction
A fundamental theme in cell and molecular biology research centers is the structure-function relationships of macromolecular assemblies that are responsible for biologi-cal processes. X-ray crystallography and NMR spectroscopy are well-established approaches for obtaining atomic struc-tures of individual macromolecules. However, many biolog-ically active components cannot be studied readily using these techniques owing to their large size, biochemical/structural heterogeneity, or membrane association. Electron cyromi-croscopy is an emerging structural technique that is superbly suited to study complex macromolecular assemblies of vari-ous sizes and forms, as occur in cells. These include fila-ments, bundles, membranes, ion channels, receptors, protein-nucleic acid complexes and viruses.
Experimental Method
Electron cyromicroscopic technique requires the speci-mens that have been highly purified so that the observed struc-tures can be related to the well-defined molecular components. The concentration of the samples is less than 1mg/ml in a stan-dard buffer. In general, one would avoid high salt, glycerol and sucrose in the sample. A 5 µl sample is applied to a grid which is either holey or has a thin carbon film across the
holes. The sample is blotted by a filter paper and plunged into liquid ethane for quick freezing.1The frozen grid is transferred
to a cyro-specimen transfer station in which the grid is loaded into the cyro-specimen holder. The frozen hydrated specimen is maintained at temperature below –165°C during the entire observation. Low dose (~10 electrons/Å2) is used to record
images. In this whole process of specimen preparation and data collection, the new investigators are usually frustrated by the unsuitable thickness of the embedding ice; the inappropriate concentration of the specimens on each grid area; the exces-sive ice contamination on the specimen; and the specimen movement seen in the micrograph. However, all of these prob-lems can eventually be overcome through experience.
Data Analysis
Image recorded from frozen hydrated biological machines has low contrast partly due to the low dose and partly due to the choice of defocus to ensure the recording of the high-resolution data. In order to assess the data qual-ity, it often requires an extensive computational analysis of the digitized image data. The computed diffraction pattern of the specimen area will show how far signal is detected in the Fourier space.2In order to retrieve the
three-dimen-sional image of the biological assembly, one needs multi-ple images of the same object in different orientations.3The
number of images needed to perform a reconstruction depends on the targeted resolution and size of the machine. The major tasks of image analysis are to determine and refine the orientations of each image of the machine; to make image corrections due to the contrast transfer func-tion of the microscope and other experimental factors that dampen the high resolution Fourier amplitudes; and to merge the data coherently from machines recorded in dif-ferent micrographs. Finally, the three-dimensional map of the assembly is computed and interpreted with advanced graphics tools. In some of the complex biological machines that are made up of multiple molecular components, its structural interpretations will be made simpler with ani-mation made from the structure.4
Biological Applications
Electron cryomicroscopy is fundamentally a high-resolu-tion tool.5For some biological molecules that form
two-dimensional crystals, the application of electron cryomi-croscopy has resulted in the determination of the tertiary fold of protein.6In instances where crystals cannot be formed,
atomic resolution information can be gleaned by combining high resolution structures of individual components deter-mined by X-ray crystallography or NMR with image-derived reconstructions at moderate resolution.8This can provide
unique and critical information on the mechanism of these complexes such as actin, microtubule and ribosome. Finally, image reconstructions have been used as initial models that facilitate phasing of crystals of large assembly by X-ray dif-fraction analysis.9,10
Acknowledgment
This research has been supported by NCRR of NIH grant P41RR02250.
References
1. Dubochet J, et al.: Cryo-electron microscopy of vitrified spec-imens. Q Rev Biophys 21, 129–228 (1988)
2. Zhou ZH, Hardt S, Wang B, Sherman MB, Jakana J, Chiu W: CTF determination of images of ice-embedded single particles using a graphics interface. J Struct Biol 116, 216–22 (1996) 3. Crowther RA, Amos LA, Finch JT, De Rosier DJ, Klug A:
Three-dimensional reconstructions of spherical viruses by Fourier synthesis from electron micrographs. Nature 226, 421–5 (1970)
4. Dougherty MT, Chiu W: Using animation to enhance 3D visu-aliztion: a strategy for a production and environment. In
Micro-scopy and Microanalysis 452–453 (1998)
5. Chiu W, McGough A, Sherman MB, Schmid MF: High resolu-tion electron cryomicroscopy of macromolecular assemblies.
Trends Cell Biol 9, 154–159 (1999)
6. Henderson R, Baldwin JM, Ceska TA, Zemlin F, Beckmann E, Downing KH: Model for the structure of bacteriorhodopsin based on high-resolution electron cryomicroscopy. J Mol Biol 213, 899–929 (1990)
7. Nogales E, Wolf SG, Downing KH: Structure of the alpha beta tubulin dimer by electron crystallography. Nature 391, 199–203 (1998)
8. Milligan RA: Protein-protein interactions in the rigor actomysin complex. Proc Natl Acad Sci USA 93, 21–6 (1996)
9. Ban N, et al.: A 9 Å resolution X-ray crystallographic map of the large ribosomal subunit. Cell 93, 1105–15 (1998) 10. Prasad BVV, Hardy M, Dokland T, Bella J, Rossman MG, Estes
MK: X-ray crystallographic structure of Norwak virus capsid.
Science 286, 287–290 (1999)
Tandem Cryo-Scanning Transmission and Cryo-High Resolution Secondary Electron Microscopy (SE-I) of Bio-Molecular Complexes ROBERTP. APKARIAN ANDKEVINL. CARAN
Integrated Microscopy and Microanalytical Facility, Department of Chemistry, Emory University, Atlanta, GA 30322
Cryo-electron microscopy methods are evolving into powerful tools for the spatial characterization of bio-molecular complexes assembled in nature and whose syn-thesis is genetically directed. Molecular studies that seek to elucidate cell function or characterize natural and syn-thetic bio-polymers are greatly complemented by cryo-electron microscopy. Bio-polymers composed of phos-pholipids, amino acid or nucleic acid sequences, are routinely analyzed spectroscopically (mass spectrometry and NMR) and by X-ray crystallography.1,2Additionally,
these polymers are now characterized at the 1-10 nm level of resolution in isolated aqueous systems by tandem
cryo-HRSEM/STEM. Large protein bio-polymers, organelles, vesicles, viruses and cells represent a challenge to spec-troscopic techniques due to their complex biological com-partmentalization. The context in which spectroscopic techniques can analyze molecular moieties is limited to purified and isolated preparations. Cryo-electron micro-scopy methods allow molecular imaging of systems com-posed of heterogeneous molecular entities such as integral membrane proteins that may function as receptors, and cell surface recognition and attachment sites.3Tandem
cryo-HRSEM/STEM represents another approach to imaging vitrified thin specimens that complement cryo-TEM struc-tural analysis.
Pure phospholipid vesicles and genetically engineered elastin-mimetic block copolymers are routinely cryo-immobilized in a vitreous film of ice on coated grids by plunging-freezing in liquid ethane (–183°C).4 Aqueous
suspensions (10 µl) of protein or phospholipid vesicles and coacervates are applied onto a carbon coated grid, blotted with either a capillary tube or filter paper, and plunge frozen in freshly melted ethane. Grids are mounted onto the Oxford CT-3500 cryoholder held within the prepa-ration chamber at –170°C. Under a positive pressure with cooled and dry nitrogen gas the double shuttered cry-oholder is transferred to a Denton DV-602 Cr coater and sputtered with a 1 nm thick film. Specimen temperature never rises above –168°C during the coating process. The cryoholder is transferred through the atmosphere and into the lens of a Topcon DS-130 Schottky field emission micro-scope, operated at 25kV. The specimen is constantly main-tained below 1×10⁻⁷torr throughout specimen stage
heat-ing to –110°C and imagheat-ing procedures. Tandem cryo-STEM/HRSEM imaging provides two recorded images (4.8 Mbytes/ea.) in 30-sec photoscans.
Monatomic chromium films provided rich contrasts of frozen-hydrated biopolymers in both recording modes without structural decoration and provide protection from beam damage. Although more modest levels of structural resolution are available (1–5 nm) with cryo-STEM/ HRSEM than by cryo-TEM, topographic contrasts are readily available to assess tertiary features of protein poly-mers. Further, multiple recordings and complex computer reconstruction methods necessary to process low contrast cryo-TEM data are circumvented. The comparatively low voltage (25kV) source used on the DS-130F STEM/HRSEM and the microscope’s ability to remove ice contamination on the coated specimen surface through in-lens sublimation greatly enhances specimen stability and recording accuracy.
The grid-plunge-freeze method and cryo-HRSEM have provided topographic data with vistas of viruses, fibronectin fibrils, phospholipid vesicles and elastin poly-mers.5,6,7,8Structural analysis of biological
macromolecu-lar complexes, both isolated and within biological com-partments (cells) are further scrutinized by cryo-STEM phase contrasts and in tandem with cryo-HRSEM provide an excellent tools for molecular studies.
References
1. McMillan, R.A., Caran, K.L., Apkarian, R.P., Conticello, V.P. High resolution topographic imaging of environmentally respon-sive elastin-mimetic hydrogels under native conditions: evi-dence for structural rearrangements during the phase transition.
Macromolecules. 1999: 32, 9067-9070.
2. Menger, F.M., Caran, K.L., Apkarian, R.P., In-lens cryo-high-resolution scanning electron microscopy of large vesicles.
Lang-muir. 2000: 16, 98-101.
3. Apkarian, R.P., Caran, K.L., Robinson, K.A. Topographic imag-ing of chromium-coated frozen-hydrated cell and macromole-cular complexes by in-lens field emission Scanning Electron Microscopy. Microsc. and Microanal. 1999, 5:3, 197-207. 4. Ryan, K.P., Purse, D.H., Robinson, S.G., Wood., J.W. The
rel-ative efficiency of cryogens used for plunge-cooling biological specimens. J. Microsc. 1987, 145:1, 89-96.
5. Chen Y, Centonze VE, Nilbert ML, Borisy G (1994) Cryo-scanning electron microscopy of reovirus structure. 52ndAnn Proc Microsc Soc Amer 134-135.
6. Chen Y, Zardi L, Pesciotta Peters DM (1997) High-resolution cryo-scanning electron microscopy study of the macromolecu-lar structure of fibronectin fibrils. Scanning 19:349-355. 7. Caran, K.L., Apkarian, R.P., Menger, F.M. Examination of large
unilamellar vesicles (LUVs) using HRSEM and cryo-STEM. 57thAnn. Proc. Microsc. Soc. America. 1999:
1210-1211.
8. Qu, Y., Payne, S.C., Apkarian, R.P., and Conticello, V.P. Self-assembly of polypeptide multi-block copolymer modeled on arachnid dragline silk proteins. J. Am. Chem. Soc. 2000 (in-press).
Morphology of Fresh -Frozen Hydrated Platelets Assessed by Cryo-High Resolution Scanning Electron Microscopy
KEITHA. ROBINSON, PH.D., NICOLASA.F. CHRONOS, M.D., ROBERTP. APKARIAN, PH.D.
Atlanta Cardiovascular Research Institute and Emory University, Atlanta, GA, USA
Novel cryo-immobilization and -imaging techniques allow the capacity to observe the morphology of cells with-out the artifactual distortions induced by chemical fixation and processing. In the case of blood platelets viewed by high-resolution scanning and scanning transmission elec-tron microscopy novel cryo-imaging strategies provide the opportunity for observation of the cells in suspension in the hydrated state, and correlate surface and overall shape structural changes to functional assessments such as aggre-gometry in response to physiologic agonists. To assess the morphology of quiescent and stimulated blood platelets using this new technique, we obtained platelet-rich plasma (PRP) from pigs and human donors.
Whole blood (26 ml) was obtained by needle puncture of the median ear artery (pig) or cephalic vein (human) and mixed with 3 ml acidified citrated dextrose solution. Platelets were isolated by standard techniques and exam-ined in the resting state or after stimulation with the phys-iologically relevant agonists thrombin (human and pig),
collagen and adenosine diphosphate (pig only). Platelet sus-pensions were pipetted into gold carriers or onto formvar-coated copper mesh grids and cryofixed by plunging into liquid ethane (–183°C). The sample preparation and imag-ing strategy has been described in detail by Apkarian et al.1
Briefly, following plunge freezing and for holders, cry-ofracture, samples were loaded into an Oxford Instruments preparation chamber. They were then transferred into the chamber of a Cr coater (Denton DV-602) with the stage and specimen maintained below –150°C. With an appropriate vacuum obtained, a 1 nm Cr film was deposited following which the samples were shuttled through atmosphere to the in-lens stage of the electron microscope. During this trans-fer the stage temperature did not rise above –120°C. The DS-130F microscope (Topcon, beam diameter ~1 nm) with in-lens CT-3500 Oxford cryo-stage fitted with dual cold fin-ger anti-contamination traps and a Varian 860 cold cathode discharge gauge for monitoring the vacuum at the specimen was used for documentation of platelet morphology at high magnification and resolution. The microscope was operated at 25kV and the specimens imaged at tempera-tures of –110°C and –160°C; the cold stage was warmed to –110°C to sublime away ice crystals formed during transfer to the microscope. Images (4.8 Mb) were recorded with a Pentium based GW video capture board and processed with Adobe Photoshop as tagged image format (TIF) files. The images were used to assess platelet and platelet microparticle size and morphologic features of activation.
In samples from pig and human whole platelets were clearly visible at low magnification (~2000X) on the frac-tured surface of the frozen PRP droplet. There was no evi-dence of fracture planes that extended into the cell interior. Control platelets were consistently discoid in shape and dis-played smooth plasma membranes with occasional evi-dence of curvilinear steps or folds at the disc edges. In con-trast stimulated platelets were considerably larger size and often showed ~50–200 nm surface blebs which may cor-respond to platelet microparticles known to form after acti-vation with various agonists. In the case of thrombin stim-ulation, prominent pseudopodia and cytoplasmic densities were also observed. For human platelets, various stages of activation were clearly delineated within the sample stim-ulated with thrombin 0.5 units/ml; fully dendritic platelets with striking stellate morphology were also detected. The above changes were obtained at the effective concentration to induce ~50% of maximum aggregation (EC50) and thus were correlated to aggregometry.
These experiments demonstrate the feasibility of a new technique to evaluate the morphology of unfixed blood platelets using a simple preparation method.1Furthermore
we have shown the capacity to distinguish marked changes in platelet surface morphology very early after activation with physiologically relevant agonists.2In a manner
sim-ilar to previous studies this method can be used to corre-late pcorre-latelet morphology to functionally significant responses.3Ongoing studies will be focused on refining