Prevalence of myopia in Taiwanese schoolchildren: 1983 to 2000
7
0
0
全文
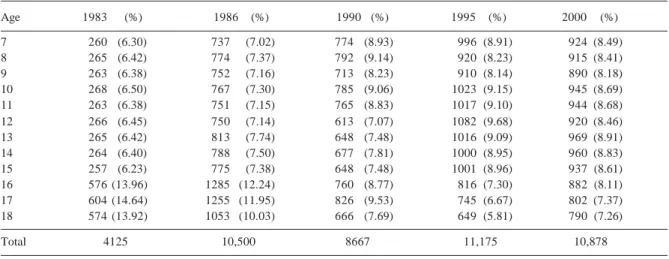
(2) 28. Prevalence of Myopia in Taiwan—LLK Lin et al. and 16 years, found that the myopic rate was 13%. In contrast, for the same age group for Chinese children being educated in the same aboriginal schools, the myopic rate was 30%. It can clearly be concluded that the myopic rate was quite low among aboriginal students some 20 years ago. Chinese students also showed a rather low myopic rate at about that time. In 1959, Ko et al11 reviewed the ocular refraction levels amongst 621 primary schoolchildren in the city of Taipei. Most of the schoolchildren in Taipei are Chinese, and it was found that 40.74% were hyperopic, 54.27% emmetropic, and only 5.31% appeared to be myopic. Interestingly, the prevalence of myopia was 3.65% at the age of 7; this level rose to 10% at the age of 12, and the myopic rate at the age of 15, on completion of compulsory education, was noted to be 16.67%.10 In 1980,12 the prevalence of myopia among 621 primary schoolchildren aged between 6 to 12 years in Taipei was reported to be 20.8% and the prevalence of myopia was observed to be 5.0% at the age of 7, and 35.1% at the age of 12. By 1983,13 it appeared to have risen to a figure of 22.2%, only to be surpassed by an even greater rate (36.2%) in 1986.14 Previous reports from studies conducted in Asia have often failed to accurately describe the refraction techniques and to provide a clear definition of myopia. To look at the changing trends of myopia over the past 20 years in Taiwan, 5 separate nationwide surveys on ocular refraction level among schoolchildren have been performed in 1983,15 1986,14 1990,16 199517 and 2000.18 The sampling technique adopted involved the assaying of stratified systematic clusters, with the unweighted myopic rate data corresponding to different sectors of the population, such as metropolitan, city, town, and aboriginal schoolchildren, being reviewed. To facilitate appropriate comparisons of the relative prevalence of myopia as well as the presence of secondary trends across different populations, studies clearly need to provide or utilise a similar definition of myopia, in order to appropriately refract children under cycloplegia, and report findings by age. We followed this rule in our study of nationwide myopia-prevalence surveys having been previously conducted in Taiwan.. Materials and Methods Sampling Methods Currently in Taiwan, there are approximately 4 million schoolchildren aged between 7 and 18 years. Table 1 shows the distribution of students surveyed for these 5 separate surveys. The sampling selected in all 5 surveys were conducted by the Department of Epidemiology, National Taiwan University. From the survey conducted in 1983,15 we randomly selected 300 students from each age group, based upon a technique of stratified system cluster sampling. For the city level of “development” category, Taiwan was arbitrarily divided into 5 different socio-geographical categories (metropolitan precincts, provincial cities, townships, villages and aboriginal areas), based upon the population, degree of civilisation and level of education. In total, 15 kindergartens, 16 primary. schools, 16 junior high schools, 19 senior high schools, and 17 vocational schools were randomly selected from strata defined by age grade and sex. A total of 4500 students were selected, 4125 (91.7%) of whom participated in the 1983 study. In 1986,14 we selected 40 to 50 students from each age group from each participating school based upon the method of stratified system cluster sampling. In total, 18 primary schools, 19 junior high schools, 31 senior high schools and 33 vocational schools were randomly selected. A total of 11,000 students were thus selected, from whom 10,500 (95.5%) participated in the study. In 1990,16 a total of 14 primary schools, 7 junior high schools, 9 senior high schools and 8 vocational schools were randomly selected. In total 9500 students were selected, 8667 (91.2%) of whom participated in the study. In 1995,17 a new national myopia-prevalence survey method was adopted based upon the developmental grading of studyinvolved cities and with the size proportional to population, in attempting to more effectively stratify the cluster sampling. Here, the 361 different administrative areas within Taiwan were first grouped into 10 distinct strata according to their status of urbanisation, these categories including the cities of Taipei, Kaohsiung and 8 strata corresponding to various other socio-geographical regions of Taiwan (provincial cities, developing areas, industrial areas, service business areas, combination areas, remote areas, hilly areas, aboriginal areas). Two cities or towns were randomly selected from each region grading. In total, 37 primary schools and 39 junior high schools were randomly selected from 10 developmental grades, and 5 senior high schools, 49 vocational schools, plus 3 colleges were drawn from ages 16 to 18. Students attending these 57 different educational institutions were randomly selected from strata defined by grade and sex. A total of 11,882 students were selected for this survey and 11,178 (94%) of them participated, including 5676 boys and 5502 girls. In the 200018 study, the multi-stage stratified sampling method was used to select random samples of schoolchildren for this national survey. In the sampling of schoolchildren, the 361 administrative areas in Taiwan were first grouped into 10 strata according to their level of urbanisation. Various numbers of townships were further selected from each stratum based upon the sampling probabilities proportional to the individual township’s population size. A total of 18 administrative areas were selected for inclusion in this particular study. Elementary, junior high, senior high and vocational schools within these areas were next selected in this study, with a probability proportional to the institution’s respective student body size. A total of 41 primary schools, 39 junior high schools, 13 senior high schools, 9 vocational schools and 4 colleges were selected from these 18 administrative areas for the 2000 study. Students from these schools were then randomly selected based upon their academic grade and sex. A total of 11,995 students were selected and 10,889 (91%) of them participated in the study, including 5664 boys and 5225 girls with ages ranging from 7 to 18 years.. Annals Academy of Medicine.
(3) Prevalence of Myopia in Taiwan—LLK Lin et al. Examination In the 1983, 1986 and 1990 studies, the corneal radius was measured using keratometry (Topcon OM-3, Tokyo, Japan), and the cycloplegic refractive status was measured using an autorefractor (Canon R-10). The level of cycloplegic refraction was assessed using a procedure incorporating the addition of 3 successive drops of 0.5% tropicamide at 5-min intervals, the measuring procedure commencing 30 minutes subsequent to the final instillation. All values for refractive status were rechecked using a retinoscope, and the biometric axial length (total axial length only) was measured using A-scan ultrasonography (Sonomed A-1000, Lake Success, NY, USA). In 1995 and 2000, the new instruments were used. The corneal radius and cycloplegic refractive status were both measured with an autorefractor (Topcon RK-3000, Tokyo, Japan). All results for the refractive status were also rechecked using a retinoscope. Biometric axial length (including anterior chamber depth, lens thickness, and total axial length) was measured using A-scan ultrasonography (Sonomed A-1500, Lake Sucess, NY, USA). Data Analysis Data acquired from all subjects and corresponding to all measurements were transferred from individual record sheets into a central computer at the central office of the Department of Epidemiology, National Taiwan University. Double data entry was performed separately by 2 independent data entry personnel, plus a third person who acted in an adjudication capacity. Results of difference in ocular components were presented as mean ± standard deviation. A multiple regression test was used to identify the age and/or education level associated with myopia and ocular components. Analysis of variance and dependent or independent Student t-tests were performed in order to evaluate the differences within groups or between genders. A Mantel Hansael test was performed in order to evaluate the statistical significance of any detected linear trends.. The tenets of the Declaration of Helsinki were observed in this study. Ethical approval was obtained from the Joint Committee for Clinical Investigation at the National Taiwan University School of Medicine. Because the correlation of refractive error between fellow eyes was noted to be very high, only the data corresponding to a participant’s right eye were used to construct the distribution of refractive errors and ocular components for the entire study population and to provide an estimate of the prevalence of myopia. Because the number of boys and girls selected were similar, we used the mean of total number in this study. The mean values of spherical equivalents of refractive status and corneal radii deriving from the autorefractometer were used for the calculation. Emmetropia was defined as a mean spherical equivalent ranging from –0.25 D to +0.25 D. Myopia was defined as a mean spherical equivalent of more than –0.25 D. The value for the level of astigmatism was not assessed in this study.. Results Prevalence The prevalence of myopia from the 1983 to the 2000 would appear to have progressively increased from one study to the next. At the primary school level, for participants aged 7 years, the prevalence of myopia varied from 5.8% in 1983, 3.0% in 1986, 6.6% in 1990, 12.0% in 1995, and 20% in 2000. For children who were aged 12 years, the corresponding values were 36.7%, 27.5%, 35.2%, 55.5% and 61%, respectively. At the junior high school level, the myopic rates at the age of 15 years were 64.2%, 61.6%, 74%, 76% and 81%, respectively. At the senior high school level, the myopic rate appeared to remain relatively unchanged (around 74%) from the age of 16 to 18 years for the 1983 and 1986 studies, and was very similar for the 1990 study (around 75%), the prevalence then appeared to increase to a level of 84% for both the 1995 and 2000 studies (Fig. 1).. Table 1. The Distribution of Students for the 5 Surveys Age. 1983. 7 8 9 10 11 12 13 14 15 16 17 18 Total. January 2004, Vol. 33 No. 1. 260 265 263 268 263 266 265 264 257 576 604 574. (%) (6.30) (6.42) (6.38) (6.50) (6.38) (6.45) (6.42) (6.40) (6.23) (13.96) (14.64) (13.92). 4125. 1986. (%). 737 (7.02) 774 (7.37) 752 (7.16) 767 (7.30) 751 (7.15) 750 (7.14) 813 (7.74) 788 (7.50) 775 (7.38) 1285 (12.24) 1255 (11.95) 1053 (10.03) 10,500. 29. 1990 (%). 1995. (%). 774 792 713 785 765 613 648 677 648 760 826 666. 996 920 910 1023 1017 1082 1016 1000 1001 816 745 649. (8.91) (8.23) (8.14) (9.15) (9.10) (9.68) (9.09) (8.95) (8.96) (7.30) (6.67) (5.81). (8.93) (9.14) (8.23) (9.06) (8.83) (7.07) (7.48) (7.81) (7.48) (8.77) (9.53) (7.69). 8667. 11,175. 2000 924 915 890 945 944 920 969 960 937 882 802 790. (%) (8.49) (8.41) (8.18) (8.69) (8.68) (8.46) (8.91) (8.83) (8.61) (8.11) (7.37) (7.26). 10,878.
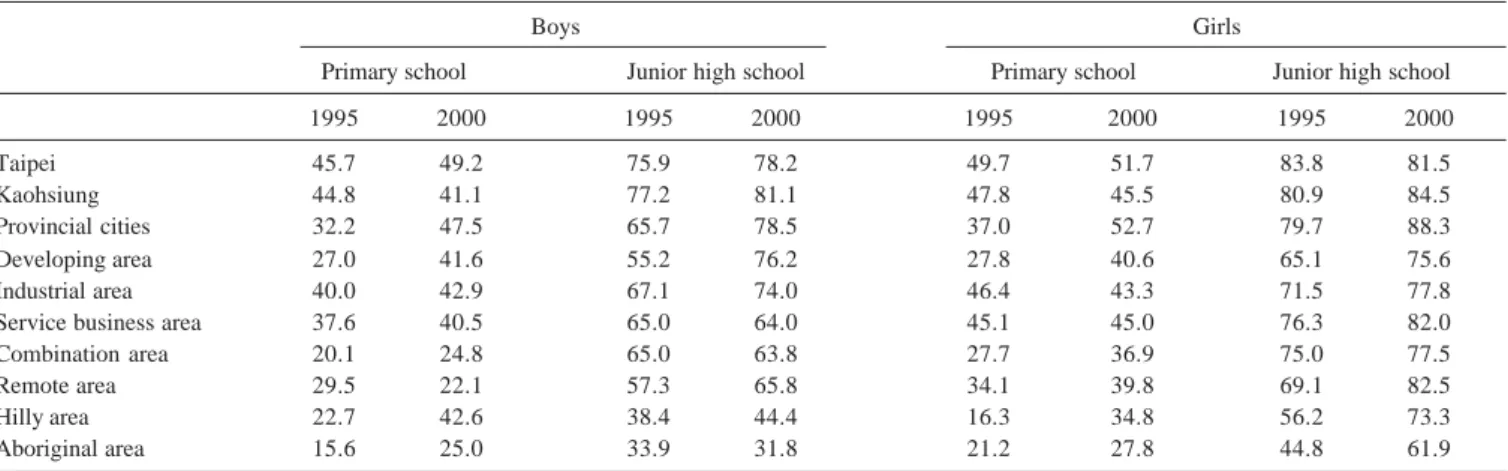
(4) 30. Prevalence of Myopia in Taiwan—LLK Lin et al. Table 2. The Mean Refractive Status (D) of Each Age Groups Age. 1983. 1986. 1990. 1995. 2000. 7 8 9 10 11 12 13 14 15 16 17 18. 0.52 (± 0.98) 0.45 (± 1.03) 0.08 (± 1.11) –0.07 (± 1.57) –0.27 (± 1.72) –0.48 (± 1.83) –0.68 (± 1.90) –1.25 (± 1.98) –1.49 (± 2.20) –2.11 (± 2.35) –2.22 (± 2.39) –2.55 (± 2.55). 0.66 (± 1.01) 0.50 (± 1.10) 0.33 (± 1.23) 0.06 (± 1.56) –0.15 (± 1.70) –0.30 (± 1.81) –0.75 (± 1.93) –1.29 (± 2.21) –1.50 (± 2.36) –2.16 (± 2.55) –2.40 (± 2.57) –2.68 (± 2.62). 0.52 (± 0.97) 0.38 (± 1.04) 0.04 (± 1.25) –0.08 (± 1.54) –0.33 (± 1.68) –0.58 (± 1.83) –0.94 (± 1.96) –1.53 (± 2.18) –1.84 (± 2.35) –2.25 (± 2.56) –2.64 (± 2.66) –2.93 (± 2.71). 0.52 (± 1.01) 0.18 (± 1.31) –0.15 (± 1.38) –0.37 (± 1.74) –0.72 (± 1.81) –1.04 (± 1.95) –1.45 (± 2.20) –1.73 (± 2.31) –2.27 (± 2.55) –2.94 (± 2.64) –3.07 (± 2.70) –3.32 (± 2.75). 0.17 (± 1.00) –0.15 (± 1.40) –0.59 (± 1.37) –0.77 (± 1.81) –1.20 (± 1.93) –1.45 (± 2.21) –2.11 (± 2.35) –2.44 (± 2.64) –2.89 (± 2.70) –3.30 (± 2.60) –3.14 (± 2.84) –3.64 (± 2.41). Table 3. Prevalence Rate of Myopia (%) of Schoolchildren Among Each Developmental Stratum in 1995 and 2000 (Right Eyes Only) Boys Primary school. Taipei Kaohsiung Provincial cities Developing area Industrial area Service business area Combination area Remote area Hilly area Aboriginal area. Girls Junior high school. Primary school. Junior high school. 1995. 2000. 1995. 2000. 1995. 2000. 1995. 2000. 45.7 44.8 32.2 27.0 40.0 37.6 20.1 29.5 22.7 15.6. 49.2 41.1 47.5 41.6 42.9 40.5 24.8 22.1 42.6 25.0. 75.9 77.2 65.7 55.2 67.1 65.0 65.0 57.3 38.4 33.9. 78.2 81.1 78.5 76.2 74.0 64.0 63.8 65.8 44.4 31.8. 49.7 47.8 37.0 27.8 46.4 45.1 27.7 34.1 16.3 21.2. 51.7 45.5 52.7 40.6 43.3 45.0 36.9 39.8 34.8 27.8. 83.8 80.9 79.7 65.1 71.5 76.3 75.0 69.1 56.2 44.8. 81.5 84.5 88.3 75.6 77.8 82.0 77.5 82.5 73.3 61.9. ANOVA test, P <0.0001. The prevalence of high myopia (over –6.0 D) also appeared to increase from study to study, levels for primary school participants at the age of 12 years were 0.2%, 0.7%, 0.5%, 2%, and 3.4%, respectively. For junior high school students aged 15, corresponding values were 4.3%, 3.1%, 6.1%, 8% and 13%, respectively, and for senior high schoolchildren 18-year-olds, levels were 10.9%, 9.2%, 6.7%, 16% and 21%, respectively (Fig. 2).. Severity Table 2 shows the mean refractive status corresponding to each age group for each respective survey conducted. In 1983, the mean ocular refraction appeared to drift towards myopia at the age of about 11 years. The mean ocular refraction appeared to approach a myopic state at about the same mean age in 1986 as was the case in 1983, then 10 years in 1990. Thereafter, the mean ocular refraction level drifted towards a myopic state for study participants at a progressively younger age, 9 years in 1995, and 8 years in 2000. In 1983, the mean spherical equivalent at the age of 15 was –1.49 D. It further progressed to –2.55 D at the age of 18. The data provided by the 1986 study were similar to those derived from the 1983 study, with a mean spherical equivalent, at the. age of 15, of –1.50 D, progressing to –2.68 D at the age of 18. Thereafter, the severity of myopia appeared to become progressively more and more substantial. The mean spherical equivalent at the age of 15 in 1990 was –1.84 D, progressing to –2.93 D at the age of 18. In 1995, the mean spherical equivalent at the age of 15 was –2.27 D, increasing to –3.32 D at the age of 18. The mean spherical equivalent at the age of 15 in 2000 was –2.89 D at the age of 15, this further progressing to –3.64 D at the age of 18.. City Development Table 3 shows the prevalence rate of myopia for schoolchildren aged 7 through 15 years with respect to the 10 developmental levels of urbanisation. There were significant differences in the prevalence of myopia between students living in cities and villages. In 1995, boys and girls in metropolitan primary schools (Taipei: 45.7% and 49.7% respectively) experienced a higher prevalence of myopia than children in hilly areas (15.6%, 16.3%). In 2000, boys (Taipei, 49.2%) and girls (provincial cities, 52.1%) in metropolitan primary schools still suffered a higher prevalence of myopia than did children in remote areas (boys, 22.1%) and aboriginal areas (girls, 27.8%).. Annals Academy of Medicine.
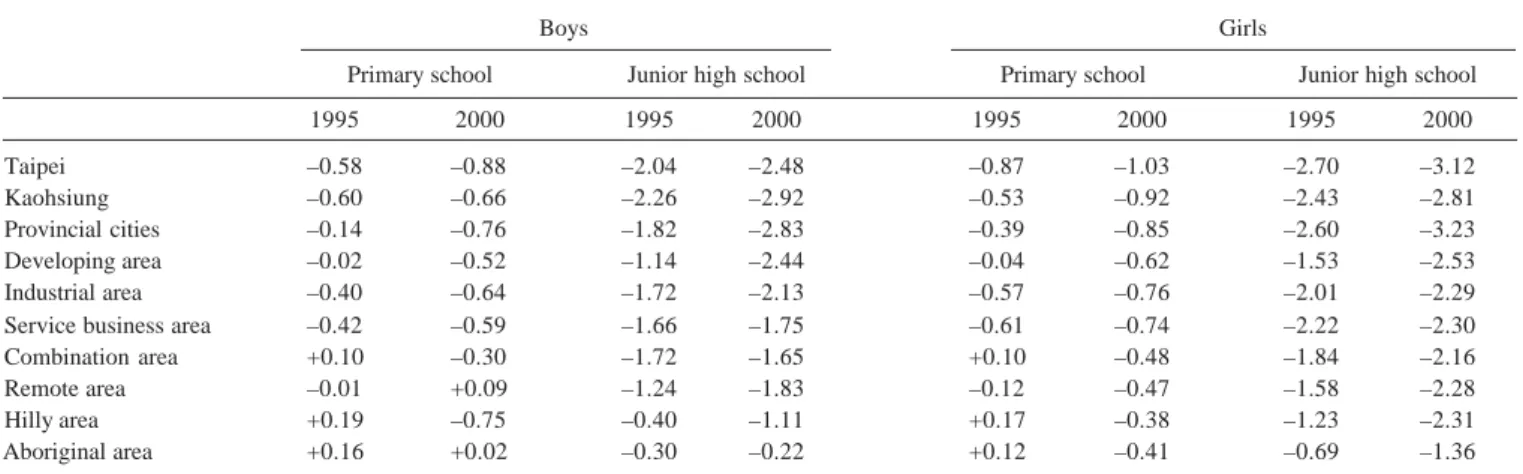
(5) Prevalence of Myopia in Taiwan—LLK Lin et al. 90. 25. 80. 20. 1983. 70. %. 1983. 60. 1986. %. 50. 15. 1990 1995 2000. 1999. 30. 1986. 10. 1990. 40. 5. 2000 0. 20. 7. 10 0. 31. 8. 9. 10. 11 12 13. 14 15. 16 17 18. Age (y). 7. 8. 9. 10 11. 12 13 14 15. 16 17 18. Age (y). Fig. 2. Prevalence of high myopia (>–6.0 D) among schoolchildren in Taiwan.. Fig. 1. Prevalence of myopia among schoolchildren in Taiwan.. Table 4. The Mean Refractive Status (D) of Schoolchildren Among Each Developmental Stratum in 1995 and 2000 (Right Eyes Only) Boys Primary school. Taipei Kaohsiung Provincial cities Developing area Industrial area Service business area Combination area Remote area Hilly area Aboriginal area. Girls Junior high school. Primary school. Junior high school. 1995. 2000. 1995. 2000. 1995. 2000. 1995. 2000. –0.58 –0.60 –0.14 –0.02 –0.40 –0.42 +0.10 –0.01 +0.19 +0.16. –0.88 –0.66 –0.76 –0.52 –0.64 –0.59 –0.30 +0.09 –0.75 +0.02. –2.04 –2.26 –1.82 –1.14 –1.72 –1.66 –1.72 –1.24 –0.40 –0.30. –2.48 –2.92 –2.83 –2.44 –2.13 –1.75 –1.65 –1.83 –1.11 –0.22. –0.87 –0.53 –0.39 –0.04 –0.57 –0.61 +0.10 –0.12 +0.17 +0.12. –1.03 –0.92 –0.85 –0.62 –0.76 –0.74 –0.48 –0.47 –0.38 –0.41. –2.70 –2.43 –2.60 –1.53 –2.01 –2.22 –1.84 –1.58 –1.23 –0.69. –3.12 –2.81 –3.23 –2.53 –2.29 –2.30 –2.16 –2.28 –2.31 –1.36. ANOVA test, P <0.0001. The highest prevalence of myopia among junior high schoolchildren in 1995 was students in Kaohsiung (boys, 77.2%) and Taipei (girls, 83.8%). In 2000, the highest prevalence of myopia among junior high schoolchildren corresponded to students in Kaohsiung (boys, 81.1%) and provincial cities (girls, 88.3%). The lowest myopic rates for children in junior high schools in 1995 corresponded to aboriginal children and those in hilly areas (33.9% and 38.4% respectively for boys, and 44.8% and 56.2% respectively for girls). In 2000, the lowest myopic rates for junior high schoolchildren corresponded to children of aboriginal descent and children living in remote areas, the prevalence being, respectively, 31.8% and 44.4% for boys, and 61.9% and 73.3% for girls. Table 4 shows the mean ocular refraction levels for schoolchildren aged 7 through 15 years with respect to the 10 developmental levels of urbanisation. The ANOVA test and multiple comparisons test between separate strata or groups also demonstrated significant differences in mean refractive status amongst schoolchildren in cities, towns and villages. The highest mean myopic refraction among junior high schoolchildren in 1995 was students in Kaohsiung (boys,. January 2004, Vol. 33 No. 1. –2.26 D) and Taipei (girls, –2.70 D). In 2000, the highest prevalence of myopia among junior high schoolchildren corresponded to students in Kaohsiung (boys, –2.92 D) and provincial cities (girls, –3.23 D). The aboriginal children and those in hilly areas (–0.30 D and –0.22 D respectively for boys, and –0.69 D and –1.36 D respectively for girls) still had the lowest mean myopic refraction for children in junior high schools in 1995 and 2000. Girls have significant higher myopia prevalence and myopic refraction than boys. In addition, the relative severity of myopia increased significantly from 1995 to 2000.. Discussion This study included 5 large-scale, population-based, crosssectional surveys of schoolchildren between 7 and 18 years of age. To our knowledge, this study was first to provide a changing trend on ocular status in the past 20 years. From this study, we can compare the refractive status between different age or different studying year. From the changing curves of myopic prevalence between these 5 surveys, we can clearly find that the changing pattern of 5 prevalence curves were quite similar, as well, the changing pattern of the severity of myopia.
(6) 32. Prevalence of Myopia in Taiwan—LLK Lin et al. (myopic refraction) was similar between these 5 surveys. The differences of mean refractive change between the ages of 15 and 18 were –1.0 D in 1983, 1986, 1990, 1995, and –0.8 D in 2000. These suggested that the myopic progression rate was similar between these 5 surveys. The most striking difference is the starting age of myopia becoming younger and younger. The mean ocular refraction level drifted towards a myopic state from study to another at a progressively younger age, 11 years in 1983, 10 years in 1990, 9 years in 1995, and 8 years in 2000. Children who were more myopic at the beginning of the study were found to have more rapid myopia progression rates.19-21 Therefore, the possible reason for the increase in myopia rates and also the severity of myopia is due to the onset of myopia which clearly appears to be occurring at a very early age. Studies on kindergarten children 22 and elementary schoolchildren23 all suggested near-work activity might be related to myopia onset. From the standpoint of epidemiological principles, if a studied population reveals a low prevalence of myopia, it will be relatively difficult to determine the role of environmental factors in the aetiology of ocular refraction. Contrasting this somewhat, Taiwan demonstrates, to our knowledge, the highest prevalence of myopia in the world. Most schoolchildren find themselves to be under a great stress as they go through a highly competitive school environment, spending, on average, more than 12 hours reading and studying each day. Such long periods of near work may possibly be a significant contributor to the significantly higher prevalence of myopia among Chinese schoolchildren in Taiwan compared to elsewhere. Myopic prevalence was found to increase with age, the prevalence of myopia increased from 20% at the primary school level to 81% at the junior high school level in 2000. At the senior high school level, the prevalence then appeared to increase to a level of 84%. Near-work activity may be one factor related to myopic progression.1,24 Education is also strongly associated with prevalence of myopia.25 There was a myopic rate of around 93% for the freshmen of the National Taiwan University in 1991, with a mean refraction exceeding –4.0 D,26 and a 91.15% prevalence rate among medical students at the National Taiwan University in 1989. The average refractive error amongst this latter group was –4.37 D, with an average axial length of 25.5 mm for males and 24.6 mm for females, and with only 4.95% of these medical students exhibiting an emmetropic axial length of 23 mm. 27 Similar results were noted amongst the students at the Kaohsiung Medical College, where 88.3% of students surveyed appeared to be myopic in 1983.28 The prevalence of myopia has also increased over the past several decades in Singapore. Three studies carried out in Singapore, during the period 1987 to 1992, demonstrated varying rates of myopia: 24.9% for 10year-old Chinese children,29 63% for university freshmen aged 19 years, and 82% for medical students.30,31 High myopia has a higher risk of cataract, glaucoma, myopic macular degeneration, and retinal detachment. 32,33 The. prevalence of high myopia (>–6.0 D) in the Baltimore Eye Survey was approximately 1.4% 34 and only 0.8% in provincial Sumatra.35 The incidence of high myopia in Taiwan also increased over past decade. In our study, it was 21% at the age of 18 years in 2000. It would appear that currently a most serious situation has developed in that far too many of our younger generations to suffer from myopic complications. However, we can clearly find that the incidence of high myopia was quite low before age of 11 years, and then increased with age. Thus, this may conclude that most of the high myopia in Taiwan came from the low myopia, not congenitally high myopia. There were significant differences in the prevalence of myopia and its relative degree between students resident in cities and villages.36 The prevalence of myopia in urban India37 (7.4%) was higher than in rural India 38 (4.1%). In our study, the highest prevalence of myopia corresponded to students in cities (Kaohsiung, Taipei and provincial cities). The lowest myopic rates also corresponded to aboriginal children and those in hilly areas and remote areas. The mean ocular refraction levels of schoolchildren in cities had the highest myopic refraction. Urban areas (developing area, industrial area, service business area and combination area) were the second. Rural areas (hilly area, remote area and aboriginal area) had the lowest myopic refraction. Gender could affect the distribution and severity of myopia. Our study found that the prevalence of myopia and the mean myopic refraction were higher in girls than in boys. To our knowledge, Taiwan has demonstrated a rather rapid and progressive increase in both the prevalence and severity of myopia over the past 20 years. From an epidemiological standpoint, this supports environmental factors in the aetiology of myopia in Asian people. This may be due to the increasing near work activity. However, the prevalence of myopia amongst schoolchildren in Taiwan, especially with regards to the onset of myopia, clearly appears to be occurring at a very early age. Therefore, to prevent the occurrence of myopia and the severity of myopia, we should pay more attention on the preschoolchildren.. Acknowledgements We are grateful to Dr. Chong-Bin Tsai, Dr. Loung-An Lee, Dr. Por T. Hung, Dr. Jau-Kang Huang, Dr. Sheau-Huey Huang and Ching-Wei Chang, and Mei-Hsien Lee for their technical assistance. These studies were supported by the Department of Health, Executive Yuan, Taiwan, ROC.. REFERENCES 1. Saw SM, Katz J, Schein OD, Chew SJ, Chan TK. Epidemiology of myopia. Epidemiol Rev 1996;18:175-87. 2. Hosaka A. The growth of the eye and its components: Japanese studies. Acta Ophthalmol Suppl 1988;185:65-8. 3. Hosaka A. Population studies – myopia experience in Japan. Acta Ophthalmol Suppl 1988;185:37-40.. Annals Academy of Medicine.
(7) Prevalence of Myopia in Taiwan—LLK Lin et al. 4. Motegi S, Kunitomo N, Kumano CY, Chiu LY, Liaw KS, Hu TL, et al. Survey of the refractive status among Taiwanese aboriginals I. J Formosan Med Assoc 1944;43:778-90. 5. Motegi S, Kunitomo N, Kumano CY, Chiu LY, Liaw KS, Hu TL, et al. Survey of the refractive status among Taiwanese aboriginals II. J Formosan Med Assoc 1944;43:826-36. 6. Motegi S, Liaw KS, Kunitomo N, Hu TL, Kumano CY, Lee DH, et al. Survey of the refractive status among Taiwanese aboriginals III. J Formosan Med Assoc 1945;44:1-11. 7. Motegi S, Liaw KS, Kunitomo N, Hu TL, Kumano CY, Lee DH, et al. Survey of the refractive status among Taiwanese aboriginals IV. J Formosan Med Assoc 1945;44:71-81. 8. Chung CB, Huang WL, Sheu MM, Chen CW. Survey of refractive status of the eyes among the aboriginal primary school students of Wu-Tai and San-Ti Hsiung, mountain area of Ping-Tong Hsien. Trans Soc Ophth Sinicae 1983;22:21-5. 9. Chen NY, Chen CW, Huang WL, Lin CP, Lee CC. The refraction screening among primary school children in mountain area of Shiow-Lin Hsiang, Huea-Lian Hsien. Trans Soc Ophth Sinicae 1984;23:14-9. 10. Lin LLK, Hung PT, Ko LS, Hou PK. Study of myopia among aboriginal school children in Taiwan. Acta Ophthalmol 1988;185(Suppl):34-6. 11. Ko LS, Liu HS, Yang YF. Study of the refraction on the primary school students in Taipei. J Formosan Med Assoc 1959;58:336-53. 12. Lin LLK, Hung PT, Ko LS. Survey of the refraction status among the primary school children in Taipei. Trans Soc Ophth Sinicae 1980;19: 58-62. 13. Liang YS, Lai IC, Loke TY, Chen TT. Preliminary report of ocular examination in school children. Trans Soc Ophth Sinicae 1984; 23:1-7. 14. Lin LLK, Chen CJ, Hung PT, Ko LS. Nation-wide survey of myopia among schoolchildren in Taiwan, 1986. Acta Ophthalmol 1988; 185(Suppl):29-33. 15. Lin LLK, Shih YF, Chen CJ, Hung PT, Hou PK. Epidemiologic study of ocular refraction among schoolchildren in Taiwan in 1983. Annual Reports of Department of Health, Executive Yuan, Taiwan, 1983. 16. Lin LLK, Shih YF, Chen CJ, Hung PT, Hou PK. Epidemiologic study of ocular refraction among schoolchildren in Taiwan in 1990. Annual Reports of Department of Health, Executive Yuan, Taiwan, 1990. 17. Lin LLK, Shih YF, Tsai CB, Chen CJ, Lee LA, Hung PT, et al. Epidemiologic study of ocular refraction among schoolchildren in Taiwan in 1995. Optom Vis Sci 1999;76:1-7. 18. Lin LLK, Shih YF, Hsiao CK, Chen CJ, Lee LA, Hung PT. Epidemiologic study of the prevalence and severity of myopia among schoolchildren in Taiwan in 2000. J Formos Med Assoc 2001;100:684-91. 19. Mantyjarvi MI. Changes of refraction in schoolchildren. Arch Ophthalmol 1985;103:790-2. 20. Goss DA. Variables related to the rate of childhood myopia progression. Optom Vis Sci 1990;67:631-6.. January 2004, Vol. 33 No. 1. 33. 21. Saw SM, Nieto FJ, Katz J, Schein OD, Levy B, Chew SJ. Factors related to the progression of myopia in Singaporean children. Optom Vis Sci 2000;77:549-54. 22. Tan GJS, Ng YP, Lim YC, Ong PY, Snodgrass A, Saw SM. Crosssectional study of near-work and myopia in kindergarten children in Singapore. Ann Acad Med Singapore 2000;29:740-4. 23. Tan NWH, Saw SM, Lam DSC, Cheng HM, Rajan U, Chew SJ. Temporal variations in myopia progression in Singaporean children within an academic year. Optom Vis Sci 2000;77:465-72. 24. Saw SM, Chua WH, Hong CY, Wu HM, Chan WY, Chia KS, et al. Nearwork in early-onset myopia. Invest Ophthalmol Vis Sci 2002; 43:332-9. 25. Kinge B, Midelfart A, Jacobsen G, Rystad J. The influence of near-work on development of myopia among university students. A three-year longitudinal study among engineering students in Norway. Acta Ophthalmol Scand 2000;78:26-9. 26. Lin LLK, Wang TH, Jan JH, Shih YF, Ko LS, Hou PK. Survey of the ocular refraction with its optical components among freshmen in National Taiwan University. Trans Soc Ophth Sinicae 1991;30:597-604. 27. Shih YF, Wang AH, Ko LS. Refractive status of medical students in National Taiwan University. Trans Soc Ophth Sinicae 1989; 28:53-8. 28. Lai CY, Huang WL, Sheu MM, Chen CW. Refractive status of students in Kaohsiung Medical College. Trans Soc Ophth Sinicae 1983;22: 14-20. 29. Ling SL, Chen AJ, Rajan U, Cheah WM. Myopia in ten year old childrena case-control study. Singapore Med J 1987;28:288-92. 30. Law NW, Chew SJ, Ritch R, Thompson HW, Beuerman RW. Survey of refraction in a Chinese population shows that myopia severity can be predicted from its age of onset [abstract]. Invest Ophthalmol Vis Sci 1992;33:709. 31. Chow YC, Dhillon B, Chew PTK, Chew SJ. Refractive errors in Singapore medical students. Singapore Med J 1990;31:472-3. 32. Mitchell P, Hourihan F, Sandbach J, Wang JJ. The relationship between glaucoma and myopia: the Blue Mountain Eye Study. Ophthalmology 1999;106:2010-5. 33. Pierro L, Camesasca FI, Mischi M, Brancato R. Peripheral retinal changes and axial myopia. Retina 1992;12:12-7. 34. Katz J, Tielsch JM, Sommer A. Prevalence and risk factors for refractive errors in an adult inner city population. Invest Ophthalmol Vis Sci 1997;38:334-40. 35. Saw SM, Gazzard G, Koh D, Farook M, Widjaja D, Lee J, et al. Prevalence rates of refractive errors in Sumatra, Indonesia. Invest Ophthalmol Vis Sci 2002;43:3174-80. 36. Wensor M, McCarty CA, Taylor HR. Prevalence and risk factors of myopia in Victoria, Australia. Arch Ophthalmol 1999;117:658-63. 37. Murthy GVS, Gupta SK, Ellwein LB, Munoz SR, Pokharel GP, Sanga L, et al. Refractive error in children in an urban population in New Delhi. Invest Ophthalmol Vis Sci 2002;43:623-31. 38. Dandona R, Dandona L, Srinivas M, Sahare P, Narsaiah S, Munoz SR, et al. Refractive error in children in a rural population in India. Invest Ophthalmol Vis Sci 2002;43:615-22..
(8)
數據
相關文件
In order to understand the influence level of the variables to pension reform, this study aims to investigate the relationship among job characteristic,
ix If more than one computer room is opened, please add up the opening hours for each room per week. duties may include planning of IT infrastructure, procurement of
a) Describe the changing trend of daily patronage of different types of public transport modes in Hong Kong from 2000 to 2015.. b) Discuss the possible reasons leading to
a) Visitor arrivals is growing at a compound annual growth rate. The number of visitors fluctuates from 2012 to 2018 and does not increase in compound growth rate in reality.
• To consider the purpose of the task-based approach and the inductive approach in the learning and teaching of grammar at the secondary level.. • To take part in demonstrations
• A teaching strategy to conduct with young learners who have acquired some skills and strategies in reading, through shared reading and supported reading.. • A good
Incorporating effective learning and teaching strategies to cater for students’ diverse learning needs and styles?. Integrating textbook materials with e-learning and authentic
Therefore, this paper bases on the sangha of Kai Yuan Monastery to have a look at the exchange of Buddhist sangha between Taiwan and Fukien since 19th century as well as the
