Carbonaceous composition changes of heavy-duty diesel
engine particles in relation to biodiesels, aftertreatments and
engine loads
Man-Ting Cheng
1, Hsun-Jung Chen
1, Li-Hao Young
2, Hsi-Hsien Yang
3, Ying I.
Tsai
4, Lin-Chi Wang
5,Jau-Huai Lu
6,Chung-Bang Cheng
71Department of Environmental Engineering, National Chung Hsing University, 250 Kuo-Kuang
Road, Taichung 40254, Taiwan
2Department of Occupational Safety and Health, China Medical University, 91 Hsueh-Shih
Road, Taichung 40402, Taiwan.
3Department of Environmental Engineering and Management, Chaoyang University of
Technology, 168, Jifeng E. Road, Wufeng District, Taichung 41349, Taiwan
4Department of Environmental Engineering and Science, Chia Nan University of Pharmacy and
Science, 60, Sec. 1, Erh-Jen Road, Jen-Te, Tainan 71710, Taiwan
5Department of Chemical and Materials Engineering, Cheng Shiu University, 840, Chengcing
Road, Niaosong District, Kaohsiung 83347, Taiwan
6Department of Mechanical Engineering, National Chung Hsing University, 250 Kuo-Kuang
Road, Taichung 40254, Taiwan
7Fuel Quality and Engine Performance Research, Refining and Manufacturing Research Institute,
Chinese Petroleum Corporation, 217, Minsheng S. Road, West District, Chiayi City 600, Taiwan
Abstract
Corresponding author. Tel.: +886422053366 Ext.6219; Fax.: +886422075711; E-mail address:
Three biodiesels and two aftertreatments were tested on a heavy-duty diesel engine under the US FTP transient cycle and additional four steady engine loads. The objective was to examine their effects on the gaseous and particulate emissions, with emphasis given to the organic and elemental carbon (OC and EC) in the total particulate matter. Negligible differences were observed between the low-sulfur (B1S50) and ultralow-sulfur (B1S10) biodiesels, whereas small reductions of OC were identified with the 10% biodiesel blend (B10). The use of diesel oxidation catalyst (DOC1) showed moderate reductions of EC and particularly OC, resulting in the OC/EC ratio well below unity. The use of DOC plus diesel particulate filter (DOC2+DPF) yielded substantial reductions of OC and particularly EC, resulting in the OC/EC ratio well above unity. The OC/EC ratios were substantially above unity at idle and low load, whereas below unity at medium and high load. The above changes in particulate OC and EC are discussed with respect to the fuel content, pollutant removal mechanisms and engine combustion conditions. Overall, the present study shows that the carbonaceous composition of PM could change drastically with engine load and aftertreatments, and to a lesser extent with the biodiesels under study.
Keywords: Heavy-duty diesel engine, Diesel engine particles, Organic carbon, Elemental carbon, Control technology
1. Introduction
Diesel engine exhaust is a complex mixture that contains gaseous pollutants and particulate matter (PM) with diameters primarily less than 2.5 m (PM2.5). The key gaseous pollutants
consist of nitrogen oxides (NOx), carbon monoxide (CO), carbon dioxide, sulfur dioxide (SO2),
and light hydrocarbons (HC). The PM components are composed predominantly of carbonaceous material in the form of organic carbon (OC) and elemental carbon (EC) [1]. The OC has recently been found to be highly associated with the oxidative potential of PM, which is an indicator of cell toxicity [2,3]. Diesel engine particles (DEP) are considered as the major source of EC in the atmosphere [4,5]. Collectively, the diesel engine exhaust contributes to adverse human health effects, restricted visibility, acid rain, and global climate change [5,6,7]; more recently, it has been reclassified as “carcinogenic to humans” [8].
The EC in DEP is formed by the pyrolysis of the unburnt fuels at temperatures above 1300 K, while the OC is produced as a result of incomplete combustion of fuel and lubricant oil [9,10]. The EC and metal ashes make up the agglomerated nearly spherical solid particles, with their surface coated with semivolatile OC and sulfate. The emission rates of particulate EC and OC from engines are shown to vary considerably, depending on the sampling conditions, engine type, mode of engine operation, fuel type, and the presence of aftertreatment [11,12,13]. Unlike the nonvolatile EC that forms in the engine, the gas/particle partitioning of semivolatile OC varies with dilution ratio, temperature and residence time [14,15].
The major contributor to the EC in PM2.5 is heavy-duty diesel engines (HDDE), followed by
light-duty diesel engines, and then gasoline engines; on average, the EC contributed to 75% of the DEP and ~ 25% of gasoline engine particles [5]. From in-use heavy heavy-duty diesel trucks, Shah et al. [11] showed that the OC/EC ratios were below unity under cruise and transient
operation, whereas above unity under creep and cold-start/idle operation. Sharma et al. [16] reported the fraction of EC in DEP increased from 25% to 48% with increasing load from idling to 70% load. Ålander et al. [12] showed that reformulated low-sulfur, low-aromatic fuel as well as diesel oxidation catalyst (DOC) reduced the particulate OC in DEP; additionally, the OC contributions to the total carbon (TC) from an indirect injection engine was significantly greater than that from a direct injection engine. Tsai et al. [17] tested soy-biodiesel blends of 0%-50% (B0, B10, B20 and B50) on a diesel generator and showed that the OC and EC decreased with increasing biodiesel blend to a minimum with B20 and then sharply increased to a maximum with B50. Similarly, Lin et al. [18] reported that the soluble organic fraction decreased to a minimum with palm-biodiesel blend of 20% (P20) and reached a maximum with neat P100. Biswas et al. [19] have shown that significant reductions (> 90%) of PM, EC, OC and water-soluble OC were achieved with catalyzed or uncatalyzed diesel particulate filters (DPF), between which only catalyzed aftertreatments were found to decrease the OC solubility. In addition, the DEP was dominated by TC in which a higher fraction of OC was observed for HDDE vehicles retrofitted with selected catalyzed continuously regenerating traps or electric particle filter that emits less or insignificant nucleation mode particles.
With increasing stringent PM emission standards, the development and application of advanced emission control technologies are an area of active research in recent years. Although new vehicles are required to meet the new emission standards, emission reductions from in-use vehicles are an integral part of an effective reduction strategy. Among those in-use vehicles, HDDE buses and trucks are of special interest as they contributed to ~50% of the total PM10
emitted from mobile sources, despite making up only a minute fraction of the total fleet in Taiwan [20]. In addition, diesel engine commonly has a life expectancy of 20-30 years or more.
Therefore, retrofitting in-use vehicles with high-efficiency aftertreatments as well as the use of biofuels have become attracting options for air pollution abatement and energy conservation. However, the impact of control strategies on the emissions needs to be evaluated for changes in human and environmental health implications. Although there are numerous publications on similar subjects, the study focuses vary substantially with respect to engine types, pollutants, fuels, aftertreatments and engine operating conditions. This study therefore supplement earlier studies by focusing on how the carbonaceous composition of diesel engine particles changes in relation to three biofuels and two aftertreatments under transient cycle and during steady engine loads. In addition, this study addresses practical applications as to how the selected biofuels and aftertreatments perform when retrofitted to old, high-emission in-use engines.
2. Experimental methods
2.1 Test engine, fuels and aftertreatments
This study was carried out in the testing facility of the Refining and Manufacturing Research Institute, Chinese Petroleum Corporation in Taiwan. The test engine was a 6-cylinder, 6 L, turbocharged air aspiration, water-cooled, direct-injection 1996 Cummins HDDE (Table S1). At the time of study, the market diesel fuels all contain ~1% waste cooking oil biodiesel (B1) supplied by the Chinese Petroleum Corporation in Taiwan. Three test fuels under study included a premium low-sulfur (< 50 ppmw) diesel (B1S50), an ultralow-sulfur (< 10 ppmw) diesel (B1S10), and a biodiesel blend containing 10% volume (B10) of neat waste cooking oil (B100). The fuel properties of the B1S50, B1S10 and B100 are given in Table S2. The biodiesel fuel quality and diesel fuel quality standards for use in mobile vehicles in Taiwan, the Chinese National Standards (CNS) 15072 and CNS 1471, are comparable to the European standards EN
14214 and EN 590, respectively.The above fuel selection was due to our national policy changes in 2010 and 2011 to further increase the biofuel content to above 2% and to lower the diesel sulfur contents, respectively. As a result, B1S50 and B1S10 could serve as the base cases for evaluating how policy changes might impact mobile pollutant emissions.The two aftertreatments under study included a DOC (denoted as DOC1) and a prototype DOC+DPF (denoted as DOC2+DPF). The DOC1 is of length (L) 40 cm and outer diameter (o.d.) 21 cm, whereas the DOC2 is of L 10 cm and o.d. 24 cm, made of a ceramic straight-through honeycomb catalyzed with a mixture of platinum and palladium. The DPF is an uncatalyzed ceramic wall-flow honeycomb (L=30.5 cm, o.d.=24 cm) with porosity of 45-50% and pore size of 2-3 m.
2.2 Duty cycles and emission factor calculation
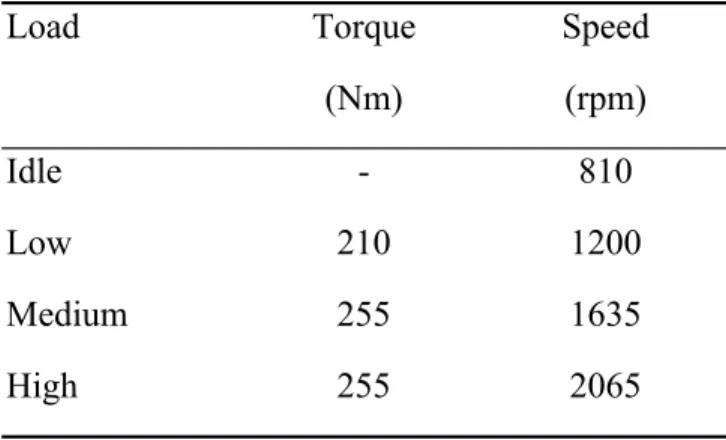
The HDDE was tested with the US Federal Test Procedure (FTP) heavy-duty transient cycle and four steady cycles that include idle, low, medium and high load. The engine torque and speed were controlled by an engine dynamometer (Schenck GS-350). Prior to each transient cycle emission test, the engine was given an overnight cold soak, after which the experiments were conducted in the order of a cold-start emission test and then 3 to 5 hot-start emission tests, with a 20-minute hot soak in between. In the steady cycle emission tests, the engine was maintained steady for 20 minutes with four sets of torque and speed given in Table 1, denoted as idle, low, medium, and high load. As shown, with the exception of idle, the engine loads differed mainly in the speed (1200-2065 rpm), while the torque was similar (210-255 Nm). In each steady cycle, the emission tests were repeated three times.
With the transient cycle, the emission tests were conducted with the engine running on the three biofuels without any aftertreatments (denoted as B1S50, B1S10 and B10) and with the B1S50 in combination with one of the two aftertreatments (denoted as DOC1 and DOC2+DPF).
With the steady cycle, all the emission tests were conducted with the engine running on B1S50 without any aftertreatments under four different loads (Table 1). This resulted in a total of 5 transient-cycle and 4 steady-cycle emission test conditions, where the former aims to investigate the effects of fuels and aftertreatments and in the latter the effects of engine loads on the engine emissions.
In the transient cycle, the weighted emission factors (EFw, mg/bhp-hr) were derived from the
cold-start and hot-start according to the US Title 40 CFR Part 86 Subpart N, for which the B1S50 with no aftertreatment is the baseline case, as follows:
EFw= gc+6 gh
(
bhp -hrc)
+6(
bhp -hrh)
where the gc and bhp-hrc are the measured pollutant mass and the brake horsepower-hour under
cold-start, respectively, whereas the subscript h denotes the hot-start. In the steady cycle, the average emission factors (EFa, mg/hr) were directly computed from the measured pollutant mass
and sampling duration, for which the B1S50 at idle is the baseline case.
2.3 Sampling and analytical
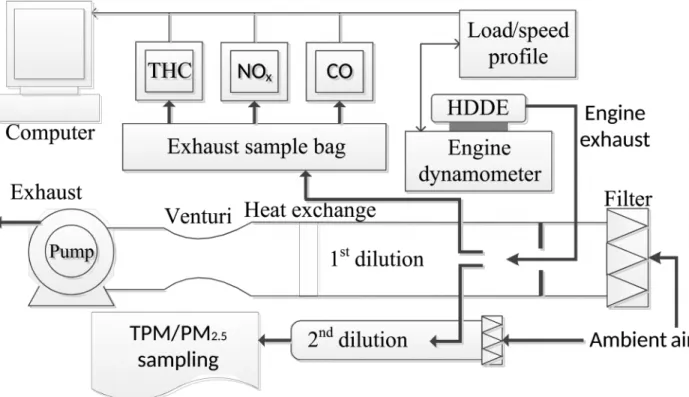
Fig. 1 shows the schematic diagram of the experimental setup, consisting of a constant-volume sampling (CVS) dilution tunnel and PM/gas sampling systems. Both the transient and steady cycle emission tests were conducted with the CVS tunnel. Using filtered air, the full-flow engine exhaust was first diluted in the CVS primary tunnel (i.d. = 35.56 cm) with the dilution ratios (DR) between 17.5 and 21.5. A small portion of the diluted engine exhaust was then further diluted inside the secondary tunnel (i.d. = 10.16 cm) with the DR between 5.9 and 9.9. The average residence time in the primary and secondary tunnel were 0.88 and 3.04 s, respectively. The diluted exhaust temperatures at the sampling zone of the secondary dilution tunnel was
per minute (lpm) and the total particulate matter (TPM) samples taken directly by filtration at 80 lpm. For each emission test condition, a PM2.5 sample on a 47-mm Zefluor filter plus a pair of
TPM samples on 70-mm quartz filters were taken for gravimetric and carbon analysis. The quartz filters (2500QAO-UP, Pall Life Sciences) were pre-baked at 900 C for 4 hours to remove carbonaceous contaminants. The filters were then conditioned at 233 C and 405% RH for 24 hours and weighed before and after sampling with a microbalance of 10 g precision (XR105DR, Mettler Toledo). Quartz filter samples were further analyzed for total carbon (TC) and elemental carbon (EC) with an elemental analyzer (W.C. Heraeus CHN-O-Rapid) [21]. In brief, the TC was determined by combusting the “non-preheated” quartz filter samples, along with a Sn foil wrap, under pure O2 to temperature up to 1800 C. The resulting combustion
product CO2 was then purged by a He flow into the thermal conductivity detector (TCD) for
carbon determination. The EC was determined by the same analytical process except that the quartz filters were “preheated” to 340 C under the presence of O2 flow of 0.5 lpm for 80
minutes. This heat treatment basically removes the vast majority of volatile and semivolatile organic carbon (OC) fraction off the particulate matter. The carbon contents were then determined by the calibration curves between the TCD signals and varying concentrations of acetanilide (C6H5NH(COCH3)) standards of known elemental composition (N: 10.36%, C:
71.09%, H: 6.71% and O: 11.80%). Finally, the OC was obtained by subtracting the EC from the TC. The above thermal method for OC/EC determination was modified from the French two-step protocol [22], except that our method did not include the decarbonation and the charring correction processes, and that we used a higher final combustion temperature. According to a number of inter-comparison studies, we suggest that the diesel particulate OC and EC concentration differences between our method and the TOR and TOT methods are less than
25%, whereas the TC concentration differences are insignificant [23-27]. The gaseous total hydrocarbon (THC), carbon monoxide (CO), and nitrogen oxides (NOx) were monitored by means of flame ionization detector, non-dispersive infrared analyzer, and chemiluminescence, respectively (Rosemount Analytical Inc., CA, USA).
3. Results and discussion
In the following, EFw (mg/bhp-hr) is used to evaluate the transient cycle test results, in which
the B1S50 with no aftertreatment is the baseline case, while EFa (mg/hr) is used for the steady
cycle test results, in which the B1S50 at idle is the baseline case. Idle represents a unique condition during which the engine typically emits the highest PM and CO, hence its results have important environmental and health implications.
3.1 Regulated gaseous and PM emissions
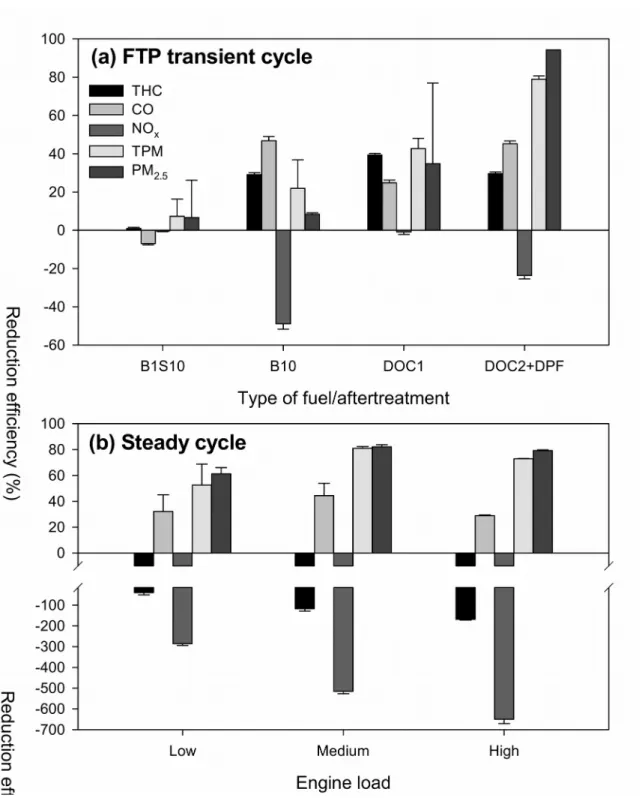
The EFw and EFa of gaseous (THC, CO and NOx) and particulate pollutants (TPM and PM2.5)
under the US FTP transient cycle and four steady cycles are given in Tables S3 and S4, respectively. The pollutant reduction efficiencies with respect to the baseline cases are shown in Fig. 2. The transient cycle results show that the reduction of fuel sulfur content from <50 ppmw to <10 ppmw yielded almost negligible reductions (<7%) with respect to regulated pollutants (HC, CO, NOx and TPM) and PM2.5, but keep in mind that SO2 and sulfate were not measured
here. On the other hand, the B10 biodiesel blended with waste cooking oil showed small to moderate reductions (8-47%) of all gaseous and particulate pollutants, except for NOx which increased moderately (49%). Such emission characteristics are consistent with the majority of studies reviewed by Lapuerta et al., Xue et al. and Pullen and Saeed [28-30], and could be attributed to the fuel properties of biodiesel that favor a more complete combustion, advance
combustion or injection and subsequently higher combustion temperature. The DOC1 and DOC2+DPF both showed small to moderate reductions (25-45%) of THC and CO, whereas small increases of NOx were observed with the DOC2+DPF. The small increase (24%) of NOx with DOC2+DPF, but not DOC1, was somewhat unexpected. Previous studies have shown little changes of NOx emission with the use of DOC+DPF or catalyzed DPF [31,32], in which the DOC is commonly used to convert NO to NO2 to assist DPF regeneration [33]. Although the two
aftertreatments utilize catalysts to enhance oxidation but they differed primarily in their reduction efficiencies of TPM and PM2.5; moderate reductions (35-43%) with the DOC1,
whereas significant reductions (79-94%) with the DOC2+DPF. Clearly, the wall-flow structure of the DPF is much more effective in trapping the particles than the flow-through structure of the DOC. The above results suggest that the two aftertreatments under study are more effective in reducing TPM and PM2.5 than the changes in fuel sulfur and biodiesel content. Nevertheless, the
high-efficiency DPF may not be enough for high-PM emitting diesel engines to meet the current standards, particularly those uncontrolled or poorly maintained engines.
The steady cycle results show that the EFa of the gaseous and particulate pollutants at idle were
comparable to that reported for HDDE equipped with electronic fuel injection [34]. In this study, the EFa of TPM and PM2.5 at idle were highest, followed by low load and then more or less
leveled off at moderate and high load. Shi et al. [35] reasoned that air-to-fuel ratios at low load were highest and hence lower combustion temperature is favorable for higher PM emissions. In this study, the medium and high load differed primarily in engine speed, not engine torque (Table 1), thus indicating higher engine speed led to higher TPM and PM2.5 emissions. Di et al.
[36] reported similar results and suggested that the increase in mechanical friction loss, the more incomplete combustion and the reduction in volumetric efficiency at the higher engine speed
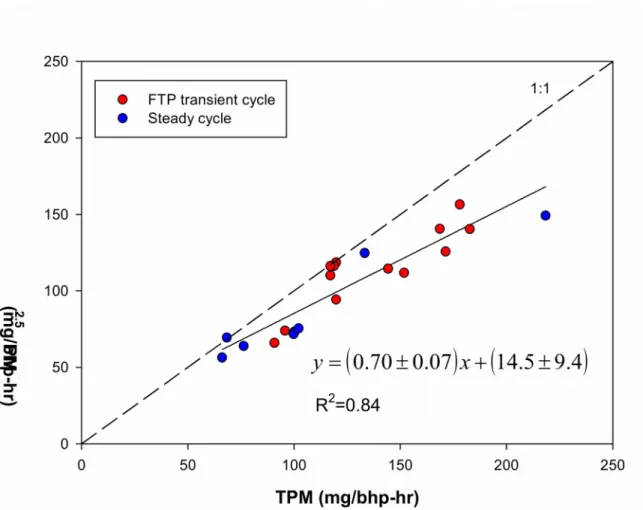
resulted in higher PM emissions. In an internal combustion engine, the volumetric efficiency is the ratio between the inducted air volume to the displaced air volume. This ratio is affected by the fuel, engine design and operating conditions. Typically, the volumetric efficiency is lower at low and high engine speed, whereas its maximum lies in between the two ends. Overall, the THC and NOx increased with increasing engine load or speed, whereas the CO and PM decreased from idle to medium load and then leveled off at or increased from medium to high load, possibly related to the reduced engine performance at high engine speed. Combining all the transient and steady cycle emission data, a strong linear relationship (R2=0.84) was observed
between the TPM and PM2.5, indicating that 70% of the TPM in diesel engine exhaust on average
are composed of PM2.5 (Fig. 3).
3.2 Effects of biofuels and aftertreatments on carbonaceous PM
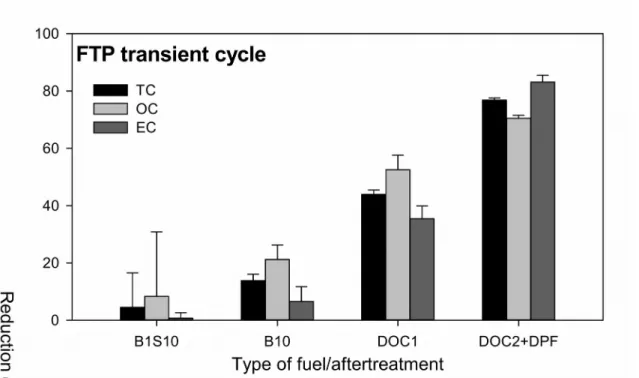
The EFw of OC and EC and their respective OC/EC ratios in TPM with the engine running on
different fuels and aftertreatments under transient cycle are given in Table 2. Using B1S50 as the baseline case, the OC, EC and TC (=OC+EC) reductions in TPM are shown in Fig. 4. Similar to the gaseous pollutants, the change from B1S50 to B1S10 showed minor reductions (<8%) of OC and EC, with an overall TC reduction of only 5%. Again, this is anticipated as the sulfur content (34.5 vs. 7.3 ppm) as well as other fuel properties are very similar between B1S50 and B1S10 (Table S2). Nevertheless, a notable reduction of OC but little reductions of EC when the fuel sulfur content was reduced substantially from ~400 ppm to <50 ppm has been reported elsewhere [12,37]. With the B10, the OC and EC showed reductions of 21% and 7%, respectively, with an overall TC reduction of 14%. The higher reductions of OC than EC indicate that the higher oxygen content in B10 is more favorable for complete combustion of OC. Studies have shown that high blends of biofuels could result in elevated OC emissions, e.g., above 20% and neat
biofuels [17,18,38], indicating that the OC reductions do not monotonically increase with increasing biodiesel blend. On the other hand, the OC and EC reductions increased considerably with the use of aftertreatments. With the DOC1, the OC and EC showed moderate reductions of 53% and 36%, respectively, with an overall TC reduction of 45%. This observation is consistent with earlier studies that suggested the oxidation catalyst reduces the PM by oxidizing and removing the toluene-soluble organic fraction of PM [39]. It is notable that the DOC1 also caused the reduction of EC, consistent with the moderate reductions of TPM and PM2.5 shown
previously. A substantial improvement in the EC reduction was observed with the DOC2+DPF, where the OC and EC reductions increased to 71% and 83%, respectively, with an overall TC reduction of 77%. Biswas et al. [19] also observed significant reductions in PM, EC and OC emissions from various types of DPF. This agrees with the fact that the DPF is designed to filter out the nonvolatile fraction of PM, i.e., the EC component.
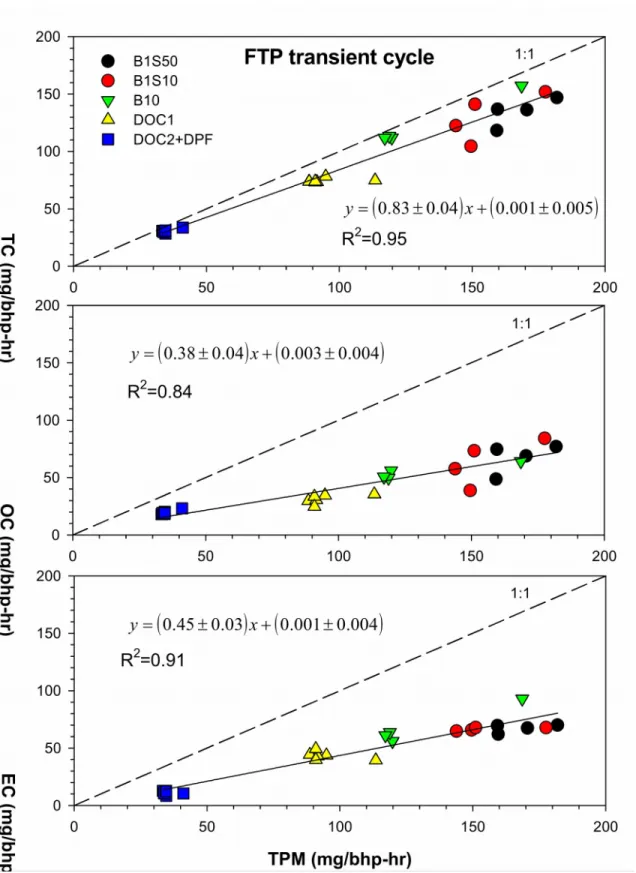
Fig. 5 presents the scatter plots of the measured EFw of TPM with TC, OC and EC under
transient cycle. As shown, the TPM showed strong positive linear relationships with TC, EC and then OC, in the order of decreasing strength where the R2 were between 0.84-0.95. It is important
to note that those relationships span across various fuels and aftertreatments, indicating that the major carbonaceous make-up of the TPM are rather stable and hence predictable across the fuels and aftertreatments under study. Across a variety of fuels and aftertreatments, Noll et al. [40] have shown that the diesel PM and TC can be accurately predicted using EC as a surrogate when the concentrations of diesel PM and TC are above 0.16 mg/m3. In this study, the measured TC
concentrations were typically above 0.5 mg/m3. The slopes of the linear fit indicate that, the TC,
EC and OC on average contributed approximately 83%, 45% and 38% of TPM, respectively. However, a closer examination of Table 2 shows that the effects of biofuels and aftertreatments
on the TC reductions were not equally apportioned to the OC and EC, and thus causing changes in the OC/EC ratio. The reduction of fuel sulfur content yielded almost negligible reductions (<6%) of OC and EC, consistent with the reductions for other pollutants under study. The minor TC reductions (8%) with the B10 were mainly a result of OC reductions (18%), possibly due to its higher oxygen content, whereas the EC practically stayed constant. As a result, the average OC/EC ratio dropped from 1.00 with the B1S50, and 0.95 with the B1S10, and to 0.81 with the B10. The TC reductions increased notably to 45% and 77% with the use of aftertreatments DOC1 and DOC2+DPF, respectively. In the case of DOC1, the TC reductions were mainly attributed to the moderate OC reductions (53%), while the EC reductions were relatively smaller (36%). The effectiveness of the DOC1 to preferentially remove the OC fraction via catalytic oxidation is revealed in its smallest OC/EC ratio of 0.72. On the other hand, the DOC2+DPF was considerable more effective in removing both the OC and EC (71% and 83%, respectively), and particularly the less volatile EC fraction. Such relatively higher EC reduction efficiency therefore resulted in the largest OC/EC ratio of 1.73. This also highlights the increasing importance of semi-volatile organic materials over the nonvolatile soot particles, as the DPF is one of the primary aftertreatments applied to meet stringent PM emission standards.
3.3 Effects of engine load on carbonaceous PM
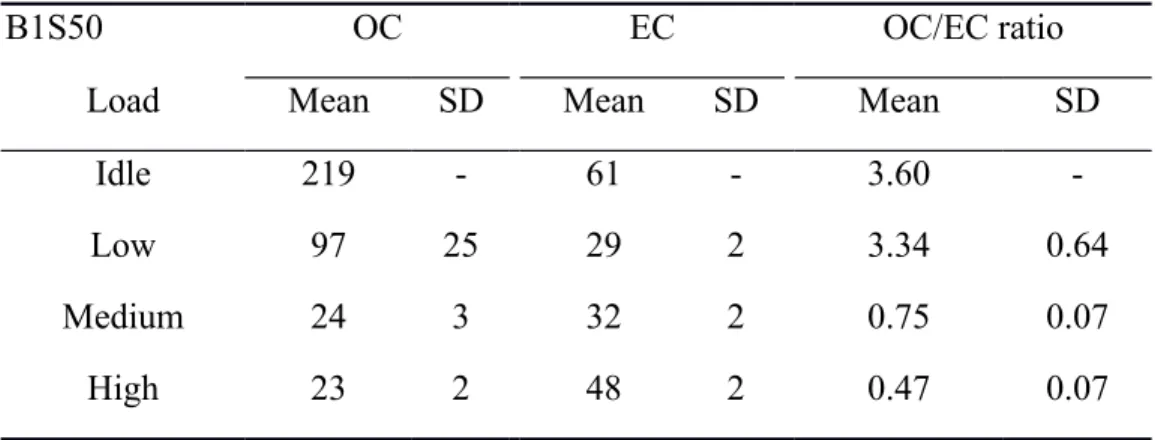
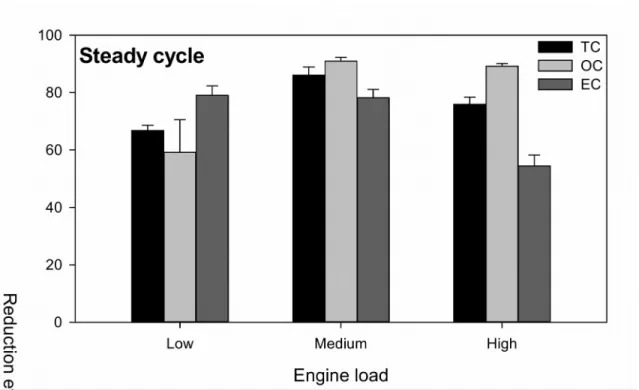
The EFa of OC and EC and their respective OC/EC ratios in TPM with the engine running on
B1S50 and without any aftertreatments under steady cycle are given in Table 3. Using the idle as the baseline case, the OC, EC and TC emission reductions in TPM under varying engine load are shown in Fig. 6. The emissions of OC and EC at idle were the highest and about 2 to 10 times higher than other engine loads. The air-to-fuel ratio at idle is the highest and the resulting lower combustion temperature is favorable for elevated PM emissions; in this study, the highest CO
emissions were observed at idle, indicating the strongest degree of incomplete combustion. From low, medium to high engine load, the emissions of OC and EC showed different trends. Specifically, the reduction of OC (32%) was notable when increasing from low to medium load, but then became negligible (~2%) from medium to high load. More fuel is combusted at higher load and thus leads to a higher combustion temperature. The OC is therefore more easily oxidized under higher temperature. Unlike the OC, the emissions of EC showed an increasing trend with increasing load. This can be explained by the decreases of the volumetric efficiency and hence post-flame soot oxidation at higher engine speed, such that the DEP contain more EC [30]. The reductions of EC therefore decreased with increasing load, from 79% to 54% for TPM and from 53% to 24% for PM2.5. The OC/EC ratios in TPM were well above unity at idle and low
engine load, but then dropped sharply to <0.75 at medium load and to <0.46 at high load, consistent with earlier studies [11,32]. The above results clearly show a trend of decreasing OC/EC ratio with increasing load.
4. Conclusions
Three biodiesels (B1S50, B1S10 and B10) and two aftertreatments (DOC1 and DOC2+DPF) were tested on a HDDE to examine their effects on the gaseous and particulate emissions under the US FTP transient cycle and four steady engine loads, with emphasis given to the carbonaceous composition (OC and EC) in the TPM. The transient cycle results show that the use of DOC2+DPF yielded the highest reductions (79-94%) of TPM and PM2.5, followed by the
DOC1 (35-43%), whereas small reductions (<25%) were obtained from the three biodiesels. With its higher oxygen content, the B10 biodiesel blended with waste cooking oil showed the highest reduction (47%) of CO, but highest increase (49%) of NOx. On the other hand, the
reduction of the fuel sulfur content from B1S50 to B1S10 yielded almost negligible reductions (<8%) with respect to all the pollutants under study, but keep in mind that SO2 and sulfate were
not evaluated here. The steady cycle results show that the THC and NOx increased with increasing engine load or speed, whereas the CO and PM decreased from idle to medium load and then leveled off at or increased from medium to high load, possibly related to the reduced engine performance at high engine speed. On average, PM2.5 contributed to 70% of the TPM.
Under the transient cycle, the emissions of particulate TC (=OC+EC) increased proportionally with that of the TPM. However, a closer examination shows that the effects of fuels and aftertreatments on the TC reductions were not equally apportioned to the OC and EC, and are thus causing changes in the OC/EC ratio. Unlike the two other biofuels, the small reduction preference of B10 for OC, but not EC, resulted in a decrease of the OC/EC ratio from about unity to 0.81. The TC reductions increased notably to 45% and 77% with the use of aftertreatments DOC1 and DOC2+DPF, respectively. The effectiveness of the DOC1 to preferentially remove the OC fraction via catalytic oxidation is revealed in its smallest OC/EC ratio of 0.72. On the other hand, the DOC2+DPF was considerably effective in removing both the OC and EC (71% and 83%, respectively), particularly the nonvolatile EC fraction. Such a preference therefore resulted in the largest OC/EC ratio of 1.73. Under the steady cycle, the emissions of OC and EC at idle were about 2 to 10 times higher than for other engine loads because of the strongest level of incomplete combustion at idle, evident by its highest CO emissions. From low, medium to high engine load, the emission of OC decreased while the EC increased with increasing engine load. As a result, the OC reductions (32%) increased from low to medium load, but then leveled off (~2%) from medium to high load. On the other hand, the reductions of EC decreased with increasing load, from 79% to 54%. The above opposing trends can be attributed to the higher
combustion temperature but decreased post-flame soot oxidation at higher engine speed, respectively.
The overall results indicate that the relative importance of particulate OC and EC varies largely with engine load and the use of aftertreatments such as the DOC and DPF and, to a lesser extent, for low-percentage (10%) biodiesel. Specifically, the semivolatile OC in PM is significantly more important at idle and low load or when the DPF is in place, whereas nonvolatile EC is more prominent at medium and high load or when aftertreatments are not in place. It is notable that the OC in PM are strongly associated with cell toxicity. On the other hand, the reduction of fuel sulfur content from <50 ppmw to <10 ppmw has negligible effects on the carbonaceous composition in diesel engine particles, though its relation with SO2 and sulfate emissions was not
evaluated in the present work. Finally, the high-efficiency DPF may not be enough for high-PM emitting diesel engines to meet the current standards, particularly for those uncontrolled or poorly maintained engines. As diesel engine, emission control technology and biodiesel are finding increasing worldwide application in abating air pollution and global warming, such carbonaceous composition changes would impact the roles of PM in adverse human health and atmospheric chemistry, and its use in source apportionment.
In the present study design, the effects of aftertreatments on exhaust emissions can only be evaluated under transient test results, whereas the effects of engine load on exhaust emissions can only be evaluated under steady-cycle test results. Our study therefore could not straightforwardly elucidate how aftertreatments would impact exhaust emissions at specific engine operation conditions. Nevertheless, the use of DOC or DPF under idle would change the PM mass and OC/EC fraction simply because of the catalytic and filtration processes. In the future, the potential interactions between aftertreatments and engine load should be included for
an improved, refined understanding of the factors influencing diesel engine exhaust. The present work has focused on the changes of particulate “mass” in relation to varying control measures. However, it is important to note that mass alone is not sufficient to fully address the adverse human health effects from diesel engine particles. Other possible exposure metrics, e.g., particle surface chemistry, morphology and toxic chemical constituents, should also be taken into consideration. Unless more detailed information is available, most risk assessment still uses mass-based exposure metric as a surrogate for evaluating dose-response relationships.
Supplementary data
Table S1 shows the test engine specifications. Table S2 gives the fuel properties. Table S3 gives the weighted emission factor (EFw, mg/bhp-hr) of THC, CO, NOx, TPM and PM2.5 under
transient cycle. Table S4 gives the average emission factor (EFa,mg/hr) of THC, CO, NOx, TPM
and PM2.5 under steady cycle.
Acknowledgments
The authors acknowledge the financial and administrative support from the Taiwan Ministry of Science and Technology and the Environmental Protection Administration under the contract # NSC 98-EPA-M003-002 and NSC-99-EPA-M-002-002.
References
[1] M.J. Kleeman, M.A. Robert, S.G. Riddle, C.A. Jakober, M. Hannigan, Characterization of Ultrafine and Fine Particulate Matter Emissions from Heavy-Duty Diesel Vehicles, CRC Report No. E-55-59 1.5a, Coordinating Research Council, Inc.:Alpharetta, GA, 2007.
[2] S. Biswas, V. Verma, J.J. Schauer, F.R. Cassee, A.K. Cho, C. Sioutas, Oxidative potential of semi-volatile and non volatile particulate matter (PM) from heavy-duty vehicles retrofitted with emission control technologies, Environ. Sci. Technol. 43 (2009) 3905-3912.
[3] K.L. Cheung, A. Polidori, L. Ntziachristos, T. Tzamkiozis, Z. Samaras, F.R. Cassee, M. Gerlofs, C. Sioutas, Chemical characteristics and oxidative potential of particulate matter emissions from gasoline, diesel, and biodiesel cars, Environ. Sci. Technol. 43 (2009) 6334-6340.
[4] R.S. Hamilton, T.A. Mansfield, Airborne particulate elemental carbon: Its sources, transport and contribution to dark smoke and soiling, Atmos. Environ. 25 (1991) 715-723. [5] US EPA, Health Assessment Document for Diesel Engine Exhaust, National Center for
Environmental Assessment, Office of Transportation and Air Quality, US Environmental Protection Agency, EPA/600/8-90/057F, 2002.
[6] A. Eldering, G.R. Cass, Source-oriented model for air pollutant effects on visibility, J. Geophy. Res. 101 (1996) 19343-19369.
[7] A.S. Ackerman, O.B. Toon, D.E. Stevens, A.J. Heymsfield, V. Ramanathan, E.J. Welton, Reduction of tropical cloudiness by soot, Science. 288 (2000) 1042-1047.
[8] IARC, Diesel Engine Exhaust Carcinogenic, Press Release N 213, International Agency for Research on Cancer, World Health Organization: Lyon, France. , 2012.
[9] J.E. Dec, C. Espey, Ignition and Early Soot Formation in a Diesel Engine Using Multiple 2-D Imaging Diagnostics. SAE Technical Paper Ser. No. 950456, 1995.
[10] D.B. Kittelson, W.F. Watts, J.P. Johnson, On-road and laboratory evaluation of combustion aerosols part 1: Summary of diesel engine results, J. Aerosol Sci. 37 (2006) 913-930.
[11] S.D. Shah, D.R. Cocker III, J.W. Miller, J.M. Norbeck, Emission rates of particulate matter and elemental and organic carbon from in-use diesel engines, Environ. Sci. Technol. 38 (2004) 2544-2550.
[12] T.J.A. Ålander, A.P. Leskinen, T.M. Raunemaa, Characterization of diesel particles: Effects of fuel reformulation, exhaust aftertreatment, and engine operation on particle carbon and volatility, Environ. Sci. Technol. 38 (2004) 2707-2714.
[13] M.M. Maricq, Characterization of Combustion and Engine Exhaust Particles. In Nanoparticles in Medicine and Environment: Inhalation and Health Effects, J.C.M. Marijnissen, L. Gradoń, Eds., Springer Science+Business Media B.V: Dordrecht, Netherlands, 2010.
[14] E.M. Lipsky, A.L. Robinson, Effects of dilution on fine particle mass and partitioning of semivolatile organics in diesel exhaust and wood smoke, Environ. Sci. Technol. 40 (2006) 155-162.
[15] I. Abdul-Khalek, D. Kittelson, F. Brear, The Influence of Dilution Conditions on Diesel Exhaust Particle Size Distribution Measurements, SAE Technical Paper Ser. No. 1999-01-1142, 1999.
[16] M. Sharma, A.K. Agarwal, K.V.L. Bharathi, Characterization of exhaust particulates from diesel engine, Atmos. Environ. 39 (2005) 3023–3028.
[17] J.-H. Tsai, S.-J. Chen, K.-L. Huang, Y.-C. Lin, W.-J. Lee, C.-C. Lin, W.-Y. Lin, PM, Carbon, and PAH emissions from a diesel generator fuelled with soy-biodiesel blends, J. Hazard. Mater. 179 (2010) 237-243.
[18] Y.-C. Lin, W.-J. Lee, H.-C. Hou, PAH emissions and energy efficiency of palm- biodiesel blends fueled on diesel generator, Atmos. Environ. 40 (2006) 3930-3940.
[19] S. Biswas, V. Verma, J.J. Schauer, C. Sioutas, Chemical speciation of PM emissions from heavy-duty diesel vehicles equipped with diesel particulate filter (DPF) and selective catalytic reduction (SCR) retrofits, Environ. Sci. Technol. 43 (2009) 1917-1925.
[20] TW EPA (Taiwan Environmental Protection Administration), Taiwan Emission Data System (TEDS), http://ivy2.epa.gov.tw/air-ei/new_main2-0-1.htm, accessed 2014/7/4. [21] Y.I. Tsai, M.T. Cheng, Visibility and aerosol chemical compositions near the coastal area
in Central Taiwan, Sci. Total Environ. 231 (1999) 37–51.
[22] H. Cachier, M.P. Bremond, P. Buat-Ménard, P., Thermal separation of soot carbon, Aerosol Sci. Technol. 10 (1989) 358-364.
[23] S. Sharma, J.R. Brook, H. Cachier, J. Chow, A. Gaudenzi, A., G. Lu, G. Light absorption and thermal measurements of black carbon in different regions of Canada, J. Geophys. Res. 107(D24) 4771 (2002) doi:10.1029/2002JD002496.
[24] J. Sciare, H. Cachier, K. Oikonomou,P. Ausset, R. Sarda-Estève, N. Mihalopoulos, N, Characterization of carbonaceous aerosols during the MINOS campaign in Crete, July– August 2001: a multi-analytical approach, Atmos. Chem. Phys. 3 (2003) 1743-1757.
[25] J.G. Watson, J.C. Chow, L. Chen, Summary of organic and elemental carbon/black carbon analysis methods and intercomparisons, Aerosol Air Qual. Res. 5 (2005) 65-102.
[26] P. Reisinger, A. Wonaschütz, R. Hitzenberger, A. Petzold, H. Bauer, N. Jankowski, H. Puxbaum, C. Chi, W. Maenhaut, Intercomparison of measurement techniques for black or elemental carbon under urban background conditions in wintertime: Influence of biomass combustion, Environ. Sci. Technol. 42 (2008) 884-889.
[27] J.C. Chow, J.G. Watson, P. Doraiswamy, L.-W. A. Chen, D.A. Sodeman, D.H. Lowenthal, D. H., K. Park, W.P. Arnott, N. Motallebi, Aerosol light absorption, black carbon, and elemental carbon at the Fresno Supersite, California. Atmos. Res. 93 (2009) 874–887. [28] M. Lapuerta, O. Armas, J. Rodríguez-Fernández, Effect of biodiesel fuels on diesel engine
emissions, Prog. Energ. Combust. Sci. 24 (2008) 198-223.
[29] J. Xue, T.E. Grift, A.C. Hansen, Effect of biodiesel on engine performances and emissions, Renew. Sust. Energ. Rev. 15 (2011) 1098–1116.
[30] J. Pullen, K. Saeed, Factors affecting biodiesel engine performance and exhaust emissions– Part I: Review, Energy. 72 (2014) 1–16.
[31] T.D. Durbin, X. Zhu, J.M. Norbeck, The effects of diesel particulate filters and a low-aromatic, low-sulfur diesel fuel on emissions for medium-duty diesel trucks, Atmos. Environ. 37 (2003) 2105-2116.
[32] Z.G. Liu, D.R. Berg, T.A. Swor, J.J. Schauer, Comparative analysis on the effects of diesel particulate filter and selective catalytic reduction systems on a wide spectrum of chemical species emissions, Environ. Sci. Technol. 42 (2008) 6080-6085.
[33] T.V. Johnson, Review of diesel emissions and control, Int. J. Engine Res. 10 (2009) 275– 285.
[34] A.S. Khan, N.N. Clark, G.J. Thompson, W.S. Wayne, M. Gautam, D.W. Lyons, D. Hawelti, Idle emissions from heavy-duty diesel vehicles: Review and recent data, J. Air Waste Manag. Assoc. 56 (2006) 1404-1419.
[35] J.P. Shi, D. Mark, and R.M. Harrison, Characterization of particles from a current technology heavy-duty diesel engine, Environ. Sci. Technol. 34 (2000) 748-755.
[36] Y. Di, C.S. Cheung, and Z. Huang, Experimental investigation of particulate emissions from a diesel engine fueled with ultralow-sulfur diesel fuel blended with diglyme, Atmos. Environ. 44 (2010) 55-63.
[37] T. Lu, Z. Huang, C.S. Cheung, J. Ma, Size distribution of EC, OC and particle-phase PAHs emissions from a diesel engine fueled with three fuels, Sci. Total Environ. 438 (2012) 33– 41.
[38] J. Zhang, K. He, X. Shi, Y. Zhao, Comparison of particle emissions from an engine operating on biodiesel and petroleum diesel, Fuel. 90 (2011) 2089–2097.
[39] K. Vaaraslahti, J. Ristimäki, A. Virtanen, J. Keskinen, B. Giechaskiel, A. Solla, Effect of oxidation catalysts on diesel soot particles, Environ. Sci. Technol. 40 (2006) 4776-4781. [40] J.D. Noll, A.D. Bugarski, L.D. Patts, S.E. Mischler, L. McWilliams, Relationship between
elemental carbon, total carbon, and diesel particulate matter in several underground metal/non-metal mines, Environ. Sci. Technol. 41 (2007) 710–716.
Table Captions
Table 1. Engine test modes under steady cycle.
Table 2. The weighted emission factor (EFw, mg/bhp-hr) of OC and EC in TPM under transient
cycle.
Table1. Engine test modes under steady cycle.
Load Torque Speed
(Nm) (rpm)
Idle - 810
Low 210 1200
Medium 255 1635
High 255 2065
Table 2. The weighted emission factor (EFw, mg/bhp-hr) of OC and EC in TPM under transient
cycle.
OC EC OC/EC ratio
Fuel/Aftertreatment Mean SD Mean SD Mean SD
B1S50 66 12 67 3 0.99 0.21 B1S10 61 15 66 1 0.91 0.21 B10 52 3 62 3 0.84 0.09 DOC1 31 3 43 3 0.73 0.12 DOC2+DPF 20 1 11 2 1.77 0.35 SD: standard deviation.
Table 3. The average emission factor (EFa, mg/hr) of OC and EC in TPM
under steady cycle.
B1S50 OC EC OC/EC ratio
Load Mean SD Mean SD Mean SD
Idle 219 - 61 - 3.60
-Low 97 25 29 2 3.34 0.64
Medium 24 3 32 2 0.75 0.07
High 23 2 48 2 0.47 0.07
Figure Captions
Figure 1. The experimental setup consists of a constant-volume sampling dilution tunnel, an
engine dynamometer, a heavy duty diesel engine (HDDE) and PM/gas sampling systems, with bold arrows indicating flow directions.
Figure 2. The reduction efficiencies of gaseous and particulate emissions under (a) transient
cycle with B1S50 as the baseline and (b) steady cycle with idle as the baseline.
Figure 3. A scatter plot of the weighted emission factors of TPM and PM2.5 under transient and
steady cycle.
Figure 4. The TC, OC and EC reduction efficiencies for TPM under transient cycle with B1S50
as the baseline. The error bar gives the standard deviation.
Figure 5. Scatter plots of TPM against TC, OC and EC weighted emission factors under
transient cycle.
Figure 6. The TC, OC and EC reduction efficiencies for TPM under steady cycle with idle as the
Fig. 1. The experimental setup consists of a constant volume sampling dilution tunnel, an engine
dynamometer, a heavy duty diesel engine (HDDE) and PM/gas sampling systems, with bold arrows indicating flow directions.
Fig. 2. The reduction efficiencies of gaseous and particulate emissions under (a) transient cycle
with B1S50 as the baseline and (b) steady cycle with idle as the baseline. The error bar gives the standard deviation.
Fig. 3. A scatter plot of the weighted emission factors of TPM and PM2.5 under transient and
Fig. 4. The TC, OC and EC reduction efficiencies for TPM under transient cycle with B1S50 as
Fig. 5. Scatter plots of TPM against TC, OC and EC weighted emission factors under transient
Fig. 6. The TC, OC and EC reduction efficiencies for TPM under steady cycle with idle as the