A rapid, sensitive, and accurate stability-indicating high-performance liquid chromatographic assay method for determining the degradation of carprofen (CPF) is developed and validated under acidic, basic, or photo-irradiated conditions. The analysis is monitored with a Cosmosil 5C18-AR column using a mobile phase of CH3CN–H2O–AcOH (50:49:1, v/v/v) at 260 nm. The developed method satisfies the system suitability criteria, peak integrity, and resolution among the parent drug and its degradation products. The results indicate that the established assay method shows good selectivity and specificity suitable for stability measurements of CPF. CPF is found to be more sensitive to exposure to light and in acidic conditions, but it is stable in a basic medium. The kinetic study of the photodegradation of CPF follows an apparent first-order reaction in a variety of solvents. The solvent effects on the rates of degradation are in the decreasing order of chloroform > dichloromethane > methanol > ethanol > 2-propanol, which is irrelevant to the dielectric constant ε. However, the hydrogen-donating ability of the solvents is essential to the photochemical decomposition of CPF. A plot of log k versus the Kirkwood function exhibits a linear relationship in aqueous ethanolic solutions, which implies that degradation proceeds via an ionic mechanism.
Introduction
Carprofen (CPF), 2-(6-chloro-2-carbazolyl)propanoic acid, is a relatively new nonsteroidal anti-inflammatory drug (NSAID) that is used to treat patients with rheumatoid arthritis, osteoarthritis, and acute gouty arthritis (1–3). How-ever, incidences of gastric irritation caused by these NSAIDs are frequently reported (4). The CPF that is available on the market is a solid; however, efforts to search for a new dosage form with better absorption characteristics in a rectal formulation (including aqueous solutions and suppository forms) have
been under intensive investigation (5,6).
CPF has been reported to be very active in producing pho-tosensitized allergic and hemolytic adverse effects (7–13). Therefore, the photostability of CPF must be seriously consid-ered with respect to its safety and efficacy in formulations. Because stability studies are an important part of preformula-tion in dosage-form development, establishing a stability-indi-cating assay method suitable for potential critical factors has become an urgent task (14–16).
Assay methods for CPF in the form of solids or biological fluids using high-performance liquid chromatographic (HPLC) techniques have been studied with promising results (1,5,6,17,18). The objective of this study is to focus on the development of a rapid, sensitive, and accurate stability-indi-cating HPLC assay method to monitor the degradation of CPF under acidic, basic, or photo-irradiated conditions. In addi-tion, we report on a series of kinetic studies of the photo-chemical decomposition of CPF in various solvent systems.
Experimental
Materials
CPF, indomethacin, and butylparaben were purchased from Sigma Chemicals (St. Louis, MO). 2,5-Dimethylfuran was from Acros Organics (Geel, Belgium). Liquid chromatographic (LC)-grade methanol, ethanol, and 2-propanol were from Fisher Chemicals (Springfield, NJ), and LC-grade chloroform, dichloromethane, and glacial acetic acid were from E. Merck
(Darmstadt, Germany). A Cosmosil 5C18-AR reversed-phase
HPLC column was the product of Naikalai Tesque (Kyoto, Japan). All other chemicals were of reagent grade.
HPLC assay condition
A Shimadzu LC-10AT HPLC pump system equipped with an SPD-10A UV–vis detector, C-R6A integrator, and Jasco 851-AS autosampler was used to analyze the degraded samples on a
Abstract
Stability-Indicating High-Performance
Liquid Chromatographic Assay Method and
Photostability of Carprofen
An-Bang Wu1, Chau-Yang Chen2, Shih-Der Chu2, Yih-Chiao Tsai2, and Fu-An Chen 2 ,*
1Graduate Institute of Pharmaceutical Sciences, Taipei Medical College, Taipei 11031, Taiwan, R.O.C. and 2Department of Pharmacy,
Cosmosil 5C18-AR column (4.6- × 250-mm i.d.) at 260 and 270 nm. A mixture of CH3CN–H2O–HOAc (50:49:1, v/v/v) was used as the mobile phase at a flow rate of 1 mL/min. The injec-tion volume was 20 µL, and indomethacin (IND) was used as an internal standard.
Degradation of CPF in acidic, basic, or photo-irradiated conditions
A 500-µg/mL ethanol solution of CPF was prepared as a stock solution. The stock solution was further diluted with 0.2 N HCl, 0.2 N NaOH, or distilled water in order to make an acidic, basic, or neutral solution, respectively, with a concen-tration of 100 µg/mL (i.e., each solution contained 20% ethanol). Six milliliters of each solution was transferred to a 20-mL clear glass container. The acidic and basic solutions were incubated for 3 days at 60°C, whereas the neutral solution was exposed to daylight for 10 min. The samples were then sub-jected to HPLC analyses.
Validation of HPLC method
The system suitability parameters—including capacity factor (k'), selectivity (α), resolution (Rs), plate number (N), and asymmetric factor (As)—of the HPLC system were established to adequate levels (19,20). The peak specificity of CPF was evaluated by comparing the ratio of the amount determined at two different wavelengths (260 and 270 nm). The linearity of CPF was carried out in the range of 2.5 to 80 µg/mL in ethanol containing 40 µg/mL of IND as an internal standard. The cali-bration curve was constructed by plotting the CPF–IND response area ratio versus concentration. The Lack-of-Fit test was used to confirm the adequacy of the regression model (19,21). The precision of the method was assessed by intra- and interday variabilities at a usual working concentration (50 µg/mL) with six replicate determinations for three con-secutive days. The accuracy of the method was evaluated by the recovery test. The mimic excipients (starch–talc, 95:5, w/w)
were compounded, and then 20 mg of the excipients was trans-ferred to three individual 50-mL volumetric flasks. The 5-, 30-, and 60-µg/mL CPF ethanolic solutions containing 40 µg/mL of IND were prepared by adding adequate stock solutions of CPF and IND and then made to mark with ethanol. After ultrason-ication for 10 min and filtration through a Millipore membrane (0.45 µm), the filtrate was subjected to HPLC analysis. Kinetic studies of CPF
CPF at 50 µg/mL was prepared in methanol; ethanol; 2-propanol; dichloromethane; chloroform; and 80%, 60%, 40%, and 20% aqueous ethanolic solutions for the purpose of studying the kinetic behavior with respect to solvent effects. Each test solution (6 mL) was transferred to a 20-mL clear glass container and exposed to a fluorescent light (NEC-FL20SSEX-D/18HG). The distance from the light source to the samples was 30 cm (1500 lx). An aliquot of 500 µL solution was removed at each predetermined checkpoint. The re-maining CPF in the solution was assayed with the established stability-indicating HPLC assay method.
Data analysis
The apparent first-order degradation rate constant was cal-culated by linear regression analysis using Sigmaplot version 2.01 for Windows from Jandel Scientific (San Rafael, CA).
Results and Discussion
Degradation of CPF
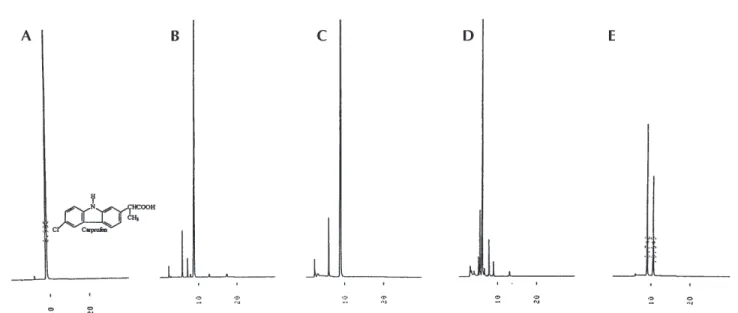
The chromatograms of the CPF that was degraded in acidic, basic, or photo-irradiated conditions are shown in Figures 1B, 1C, and 1D, respectively. Apparently, CPF was degraded to numerous products, especially under daylight exposure. The retention time of CPF was found to be 8.91 min (Figure 1A),
Figure 1. HPLC chromatograms of CPF: standard solution, A; degraded under acidic conditions for 3 days at 60°C, B; degraded under basic conditions for 3 days at 60°C, C; photodegraded in daylight for 10 min, D; and CPF and IND as internal standards, E.
and most of the degradation products had retention times shorter than that of CPF, indicating that the degradation prod-ucts were more polar than the parent drug. To avoid interfer-ence by the degradation products, IND with a retention time of 10.35 min was chosen as an internal standard, which appeared after the parent drug (Figure 1E). Under acidic or basic con-ditions of incubation for 3 days at 60°C, the amounts of CPF remaining were 65.2% and 99.9%, respectively, whereas under daylight exposure for 10 min, it was 2.1%. The results clearly show that CPF is more labile to light and in acidic conditions, but it is stable in a basic medium.
Validation of the HPLC method
The system suitability parameters—including capacity factor (k'), selectivity (α), resolution (Rs), plate number (N), and asymmetric factor (As)—are shown in Table I. Obviously, all values of the system parameters are located within adequate levels of an optimized HPLC condition (19,20). Table II shows the ratio of the amount quantitated at 260 and 270 nm (before and after the stress treatment). The results of the statistical comparison using one-way analysis of variance (ANOVA) are shown in Table III. The lack of significant differences between the four groups for CPF and IND is indicative of peak homo-geneity. A stability-indicating method must selectively separate the parent drug from its potential impurities and degradation products. Otherwise, a nonspecific assay method cannot obtain reliable measurements of drug stability
(15). Our established method satisfied the system suitability criteria, peak integrity, and resolution among the parent drug, internal standard, and degradation prod-ucts. The results clearly indicated that the established assay method has good selec-tivity and specificity for the stability mea-surements of CPF.
The linearity of the calibration curve was checked over the range of 2.5 to 80 µg/mL in ethanol containing 40 µg/mL IND as an internal standard. The calibration curve was constructed by plotting the CPF–IND response area ratio versus the concentra-tion. The calibration curve for CPF was rec-tilinear in the concentration range studied. The correlation coefficient of the linear regression analysis was greater than 0.9999. The results of linear regression gave the equation y = 0.03124x – 0.00045 with 95% confidence limits for the inter-cept from –0.00621 to 0.00531 and the slope from 0.03109 to 0.03139. The differ-ence of the intercept from zero was found not to be significant (p > 0.05). The ANOVA for testing the significance of regression is shown in Table IV. The F ratios for regres-sion and Lack-of-Fit test confirm both the significance and the adequacy of the linear model. The intra- and interday relative standard deviations (RSDs) of six replicate
Table I. System Suitability Parameters for CPF
Parameter CPF IND Preferable levels
k' 3.57 4.23 2 to 8 α 1.18 1.02 to 2.0 Rs 2.59 (CPF–IND) > 1.5 2.22 (CPF–DP*) 4.54 (IND–DP) As 1.08 1.12 0.9 to 1.3 N 72,319 87,278 * DP, degradation products of CPF.
Table II. Peak Area Ratios Quantitated at 260 and 270 nm* Condition CPF at 260 nm/270 nm IND at 260 nm/270 nm Standard solution 2.505 ± 0.009 1.073 ± 0.038 Acidic medium 2.531 ± 0.039 1.082 ± 0.049 Basic medium 2.505 ± 0.015 1.136 ± 0.036 Daylight exposure 2.552 ± 0.046 1.097 ± 0.036
* Data represent the mean ± standard deviation (n = 3).
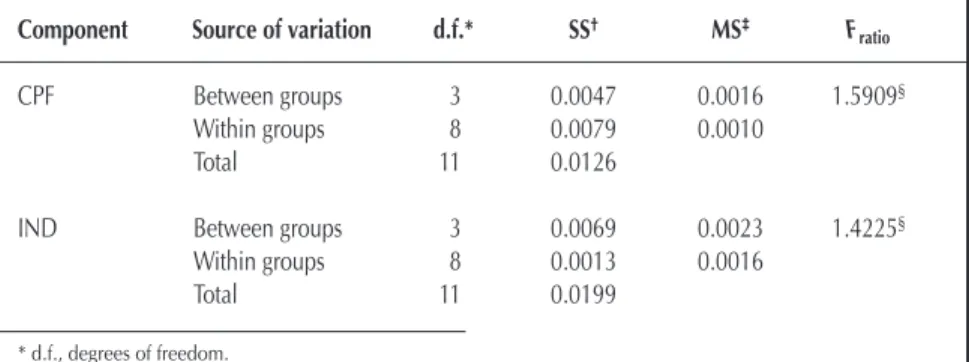
Table III. Comparison Between the Peak Area Ratios of CPF Determined at 260 and 270 nm
Component Source of variation d.f.* SS† MS‡ F ratio
CPF Between groups 3 0.0047 0.0016 1.5909§
Within groups 8 0.0079 0.0010
Total 11 0.0126
IND Between groups 3 0.0069 0.0023 1.4225§
Within groups 8 0.0013 0.0016 Total 11 0.0199 * d.f., degrees of freedom. †SS, sum of squares. ‡MS, mean square. §F
ratio< F(3,8,0.95); differences between groups are not significant.
Table IV. Analysis of Variance of the Calibration Curve
Source of variation d.f.* SS† MS‡ F ratio Regression 1 25.7453 25.7453 172787.2483§ Residual 34 5.0656 × 10⁻³ 1.4900 × 10⁻⁴ Lack-of-Fit 4 9.2831 × 10⁻⁴ 2.3208 × 10⁻⁴ 1.6828** Pure error 30 4.1373 × 10⁻³ 1.3791 × 10⁻⁴ Total 35 25.7504 * d.f., degrees of freedom. † SS, sum of squares. ‡ MS, mean square.
§ Fratio> F(1,34,0.95); regression is significant.
determinations for three consecutive days at a usual working concentration of 50 µg/mL were 0.87% and 1.12%, respec-tively. The accuracies of the method—referring to the recovery test at the three concentrations of 5, 30, and 60 µg/mL (expressed as the closeness of the observed mean to the true value)—were determined to be 99.5%, 101.3%, and 98.9%, respectively. There was no significant difference in comparison with the results with 100% recovery (p > 0.05), which indicates good accuracy for the assay method. Clearly, the established assay method is reliable and applicable for the stability assess-ment of CPF degraded under acidic, basic, or photo-irradiated conditions.
Kinetic studies of photochemical decomposition of CPF in nine different solvents
The influence on the photochemical decomposition of CPF was investigated in nine different solvent systems—methanol; ethanol; 2-propanol; dichloromethane; chloroform; and 80%, 60%, 40%, and 20% aqueous ethanol. Plots of the logarithm of the percentage parent compound remaining versus time Table V. Observed Apparent First-Order Rates of
Photochemical Decomposition of CPF in Nine Different Solvents Solvent kobs(h–1) × 103 t1/2(h) 2-Propanol 1.403 493.942 Ethanol 2.447 283.204 Methanol 4.912 141.083 Dichloromethane 5.125 135.220 Chloroform 10.096 68.641 80% Ethanol 43.483 15.937 60% Ethanol 75.500 9.179 40% Ethanol 133.608 5.187 20% Ethanol 197.253 3.513
Table VI. Relationship Between log k and the Kirkwood Function* Solvent ε fε kobs(h–1) × 103 Absolute ethanol 24.5 0.470 2.447 80% ethanol 35.3 0.479 43.483 60% ethanol 46.1 0.484 75.500 40% ethanol 56.8 0.487 133.608 20% ethanol 67.6 0.489 197.253 Chloroform 4.8 0.358 10.096 Dichloromethane 8.9 0.420 5.125 Methanol 32.7 0.477 4.912 2-Propanol 19.9 0.460 1.403 * fε= (ε – 1) / (2ε + 1).
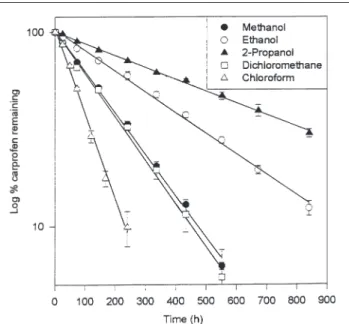
Figure 2. Apparent first-order rate plots of the photochemical decompo-sition of CPF in five organic solvents.
Figure 3. Apparent first-order rate plots of the photochemical decompo-sition of CPF in aqueous ethanolic solutions.
Figure 4. Correlation between log k and the Kirkwood function for the photochemical decomposition of CPF in aqueous ethanolic solutions.
Log
(Figures 2 and 3) were linear (r > 0.995), indicating that the decomposition followed an apparent first-order reaction. The rate constants (kobs) and the half-lives (t1/2) in nine solvents were calculated and are shown in Table V. The photodegrada-tion rates of CPF are in the decreasing order of chloroform > dichloromethane > methanol > ethanol > 2-propanol, which is irrelevant to the polarity or dielectric constant (ε) of the sol-vents, but is in good agreement with the order of their hydrogen-donating abilities. The influence of water contents on the decomposition rates in an aqueous ethanolic solution is shown in Figure 3. With an increase in water content, the photodegradation rate of CPF can be greatly accelerated. The formation of 2-(2-carbazolyl)propanoic acid via the abstrac-tion of chlorine could not occur in the absence of hydrogen-donor molecules such as water (12). In an attempt to correlate log k versus the Kirkwood function (Table VI) using the Kirk-wood–Onsager equation (22), a linear relationship was observed (Figure 4). Therefore, we expect that the degradation reaction in an aqueous medium proceeds by an ionic mecha-nism, which is quite different from that in hydrogen-donating organic solvents. The photochemical decomposition of CPF was previously reported to involve mainly a free radical pathway in order to produce 2-(2-carbazolyl)propanoic acid via the abstraction of chlorine in hydrogen-donating solvents accompanied by small amounts of oxidation products (12). CPF probably photodegrades via either the decarboxylation or abstraction of chlorine, which is in accordance with the apparent first-order kinetics found in the present study.
In conclusion, a solvent system with a stronger hydrogen-donating ability seems to dominate the photochemical decom-position rate of CPF. From a practical point of view, our findings suggest that using a solvent with a lower hydrogen-donating ability (such as 2-propanol) compounded with a decrease in water content when formulating pharmaceutical preparations of CPF would be an effective means of enhancing the photostability of the drug.
Acknowledgments
The authors thank Cheng’s Foundation for Pharmaceutical Sciences and the Tajen Institute of Technology for their finan-cial support.
References
1. T.F. Yu and J. Perel. Pharmacokinetic and clinical studies of carprofen in gout. J. Clin. Pharmacol. 20: 447–51 (1980). 2. R.L. Williams, D.E. Furst, H.G. Mandel, D. Nicoll, J.J. Konikoff,
and L.Z. Benet. Effects of indomethacin and carprofen on renal homeostasis in rheumatoid arthritis patients and in healthy indi-viduals. J. Clin. Pharmacol. 21: 493–500 (1981).
3. W.M. O’Brien and G.F. Bagby. Carprofen: a new nonsteroidal
antiinflammatory drug. Pharmacology, clinical efficacy and adverse effects. Pharmacotherapy 7(1): 16–24 (1987).
4. L.B. Katz, R.J. Capetola, D.C. Argentieri, L.E. Moore, T. Genna, M.C. Porter, V. Justy, R.E. Hartnagel, D. Abrutyn, and D.A. Shriver. Rioprostil prevents gastric bleeding induced by nonsteroidal anti-inflammatory drugs in dogs and arthritic rats. J. Rheumatol. 13(5): 887–94 (1986).
5. M. Schmitt and T.W. Guentert. Influence of the hydrophobicity of suppository bases on rectal absorption of carprofen, a lipophilic nonsteroidal anti-inflammatory drug. J. Pharm. Sci. 79(4): 359–63 (1989).
6. M. Schmitt and T.W. Guentert. Biopharmaceutical evaluation of carprofen following single intravenous, oral, and rectal doses in dogs. Biopharm. Drug. Dispos. 11(7): 589–94 (1990).
7. B. Liunggren. Propionic acid-derived non-steroidal anti-inflam-matory drugs are phototoxic in vitro. Photodermatology 2: 3–9 (1985).
8. B. Liunggren and K. Lundberg. In vivo phototoxicity of non-steroidal anti-inflammatory drugs evaluated by the mouse tail technique. Photodermatology 2: 372–77 (1985).
9. B. Scheuer and H. Kietzmann. Photoallergic reaction to carprofen. Allergologie 9: 131–36 (1986).
10. B. Przybilla, U. Schwab-Przybilla, T. Ruzicka, and J. Ring. Pho-totoxicity of non-steroidal anti-inflammatory drugs demonstrated in vitro by a photo-basophil-histamine-release test. Photoderma-tology 4: 73–78 (1987).
11. J. Ring, B. Przybilla, and T. Ruzicka. Non steroidal anti-inflam-matory drugs induce UV-dependent histamine and leukotriene release from peripheral human leukocytes. Int. Archs Allergy Appl. Immun. 82: 344–46 (1987).
12. G.D. Guidi, R. Chillemi, L.L. Costanzo, S. Giuffrida, and G. Con-dorelli. Molecular mechanism of drug photosensitization 4. Pho-tohemolysis sensitized by carprofen. J. Photochem. Photobiol. B: Biol. 17: 239–46 (1993).
13. L. Becker, B. Eberlein-konig, and B. Przybilla. Phototoxicity of non-steroidal anti-inflammatory drugs: in vitro studies with visible light. Acta Derm. Venereol 76: 337–340 (1996).
14. V. Kumar, N. Sunder, and A. Potdar. Critical factors in devel-oping pharmaceutical formulations—an overview, part I. Phar-maceut. Tech. 94–102 (1992).
15. C. Ho and G.L. Chen. Stability-indicating high-performance liquid chromatographic assay methods for drugs in pharmaceutical dosage forms: part I. J. Food Drug Anal. 4(4): 271–92 (1996). 16. C. Ho and G.L. Chen. Stability-indicating high-performance liquid
chromatographic assay methods for drugs in pharmaceutical dosage forms: part II. J. Food Drug Anal. 5(1): 1–24 (1997). 17. J.K. Stoltenborg, C.V. Puglisi, F. Rubio, and F.M. Vane.
High-per-formance liquid chromatographic determination of stereoselective disposition of carprofen in humans. J. Pharm. Sci. 70(11): 1207–1212 (1981).
18. A.J. Ross, M.D. Del-Mauro, H.K. Sokoloff, and D.L. Casey. Analysis of carprofen dosage forms and drug substance by high-performance liquid chromatography. J. Pharm. Sci. 79(9): 1211–15 (1984).
19. H.C. Hsu and C.S. Chen. Validation of analytical methods: a simple method for HPLC assay method. J. Food Drug Anal. 2(3): 161–76 (1994).
20. C.S. Lo, C.F. Wang, and H.C. Hsu. A stability-indicating HPLC assay method of indomethacin and the stability of indomethacin gels. Chin. Pharm. J. 45(4): 321–28 (1993).
21. D.C. Montgomery. Design and Analysis of Experiments, 3rd ed. John Wiley & Sons, New York, NY, 1991, pp 493–97.
22. N. Isaacs. Physical Organic Chemistry, 2nd ed. Longman Scien-tific & Technical, Essex, England, 1995, pp 208–13.