INTRODUCTION
Northern bluefin tuna, Thunnus thynnus, are found in the northern hemisphere, but very few are found in the southern hemisphere.1 In worldwide terms, three
bluefin tuna stocks are assumed for assessment and man-agement purposes, those are the western Atlantic stock, the eastern Atlantic and Mediterranean stock and the Pacific stock.
Since the 1970s, the International Commission for the Conservation of Atlantic Tunas (ICCAT) have con-ducted many studies on the two Atlantic stocks.2Those
studies have been published in the ICCAT Collective Volume of Scientific Papers. However, few studies have been done on the Pacific stock.3–7It is noted that the
Atlantic stocks have been assessed as over-exploited and have been managed by size limit, time and area closures and catch quota renewal year by year.2The stock status
of the Pacific bluefin tuna is still unknown, due to poor
knowledge of the biological parameters and statistics used for evaluating the stock.
Analytical assessment studies generally require the determination of the number of fish caught at suitable length and the length–weight conversion in the com-mercial fisheries.8,9In many cases, this is achieved by the
adjustment of length frequencies obtained by port sam-pling to the total reported catch in weight through the application of length–weight relationship. A formulation of the length–weight relationship is therefore essential not only in those assessment techniques, but in catch compilation from number into weight. Although many fork length–weight (eviscerated and round) relationships of eastern and western North Pacific bluefin tuna have been formulated for internal use by Japanese and American scientists, no length–weight relationship was provided for bluefin tuna from southwestern North Pacific, especially off the Taiwan coast.10This is because
weighing very large and valuable bluefin tuna on board is difficult, and most fish landed are eviscerated (gilled and gutted with intact head), which results in the diffi-culty of accurately measuring round weight. However, a fork length–weight relationship (LW) should give
valu-Original Article
New information on age composition and length–weight
relationship of bluefin tuna, Thunnus thynnus,
in the southwestern North Pacific
Chien-Chung HSU,1Hsi-Chiang LIU,1,* Chi-Lun WU,2Shih-Tsung HUANG2 AND Hsueh-Keng LIAO2
1
Institute of Oceanography, National Taiwan University, PO Box 23-13, Taipei, Taiwan 106 and 2
Taiwan Fisheries Research Institute, Keelung, Taiwan 202
SUMMARY: New information on catch-at-age composition and length–weight relationships is pre-sented for Pacific northern bluefin tuna caught by Taiwanese small-scale longliners in the south-western North Pacific. The fork length – eviscerated weight relationship of Pacific northern bluefin tuna, Thunnus thynnus, caught off southwestern North Pacific (off the Taiwan coast) was determined and compared with relationships previously reported by various studies for different waters. The best representative of this relationship is W= 0.000023058L2.9342
, where W is the eviscerated weight (kg) and L the fork length (cm). The eviscerated weights estimated from this relationship were multiplied by a scaling factor of 1.112 to obtain the estimated round weight. The visual comparison of weight-at-length showed that there were almost no differences between the relationships previously reported for the northwestern Pacific, the Sea of Japan and the present study. This indicated that Pacific north-ern bluefin tuna from those three waters could be of the same stock. Further assessment studies should combine information from those waters.
KEY WORDS: length–weight relationship, likelihood ratio test, northern bluefin tuna, Thunnus thynnus.
*Corresponding author: Tel: 886-2-2362-2987. Fax: 886-2-2366-1198. Email: [email protected]
(Thunnus albacares), bigeye tuna (T. obesus) and albacore (T. alalunga). A trip is about 7 days on average. Nonethe-less, some of the fleets operate to target bluefin tuna during April and June each year. Other fisheries have never targeted bluefin tuna until recently. Tungkang, located at southwestern Taiwan, is the largest landing port and Suao at northeastern Taiwan is the next biggest (Fig. 1). The fishes caught were chilled in ice, and most bluefin tuna were gilled and gutted on board to maintain the meat quality. All the processed bluefin tuna were then exported directly to Japan by air immediately they were unloaded at those two ports. For the present study, some of the longline fleets were asked for weight mea-surements as they unloaded.
The fish were then measured at landing ports (Tungkang and Suao in Fig. 1) as they were unloaded. The fork length (from the tip of snout to tail fork) was measured by steel calipers to the nearest cm, and the weight was determined to the nearest kg by scales (a Chinese steelyard, Nankuang Measurement Instruments, Inc., Taipei, Taiwan). Only fork length was measured for over 90% of the gilled and gutted samples. The sexes were not distinguished because the fish had been eviscerated on board.
Size/age composition
Because fork lengths of almost all bluefin tuna caught were measured at landing ports, the length frequencies may be sufficient to represent the size distributions of the studied population. If the normality of actual size distri-bution was met, the annual actual size distridistri-bution was tested for having a similar dispersion from 1993 to 1998 before any statistical comparison was made. The normal distribution of annual actual size distribution was exam-ined by g1and g2statistics for its skewness and kurtosis,
respectively.11Then, to investigate the changes of major
age-class in the annual catch, the difference of age com-positions of the annual catch was examined by separat-ing the catch-at-length based on the growth equation: FL= 320.5(1–e–0.1305t–0.0728) into catch-at-age.12
Statistical analyses
Examining scatter plots of the LW relationship, a power function, W = aLb, where W is the weight (kg) and L is
the fork length (cm), seems appropriate for deriving the LW relationship. Thus, least squares linear regressions of eviscerated weight on fork length were derived for samples after natural logarithmic transformation of the two variables.
To test the equality that samples are collected from the same population, the LW relationships were first derived by monthly samples. The likelihood ratio test was carried out to test the null hypothesis that the esti-mated parameters are constant across the monthly able insights both into the most appropriate catch
con-version between number and weight and management units.
Therefore, the objectives of this study are to analyze the age-class variation derived from size composition, and to formulate the length–weight relationship in order to contribute new useful information for the stock assess-ment of Pacific northern bluefin tuna stock caught off the Taiwan coast.
MATERIALS AND METHODS Data collection
Two kinds of data, length only and length and weight combined, were collected for Pacific northern bluefin tuna from the southwestern North Pacific (off the Taiwan coast) (Fig. 1) during the fishing seasons from 1993 to 1998. All length measurements were made as fork length in the present study.
Fork lengths (FL) were measured for almost all the catches from 1993 to 1998. However, fork lengths with eviscerated weight of bluefin tuna were collected only during 1997–1998 from Taiwanese longline fleets oper-ating in the waters of the southwestern North Pacific (Fig. 1). In addition to these samples, a significant amount of small bluefin tuna (FL <170 cm) was measured and weighed at various times.
In Taiwan, the small-scale longline fleets (<100 gross register tons, GRT) operate offshore in the southwestern North Pacific near the Taiwan coast throughout the year, and they target various tunas, mainly yellowfin tuna
Fig. 1 Location of the fishing area for Taiwanese small-scale longline fleets targeting Pacific northern bluefin tuna. The two major landing ports, Tungkang and Suao, for unloading Pacific northern bluefin tuna are also shown.
sample data sets with different variances.12,13The test was
made on combining the slope and the intercept together with a likelihood ratio test.13
Test of equality of parameters between data sets based on the theory of likelihood ratio tests have been intro-duced by several scientists (e.g. Kimura (1980)14; Cerrato
(1990)15and Quinn and Deriso (1999).13The likelihood
ratio tests can be used to compare full models with a reduced model for two or more data sets. By assuming a normal distribution with additive errors for five data sets, the maximum likelihood estimation (MLEi) of
parame-ters Qˆi, and standard deviation sˆi, for data set i, Yiwith sample sizes, niresults in:
(1) and
(2) The joint maximum log likelihood lnLF for the full model is obtained by:
(3) Meanwhile, the maximum log likelihood for reduced model, lnLR, is then from (3) with niand sˆi2replaced by n and sˆ2. Therefore, the likelihood ratio test statistics is:
(4) The asymptotic distribution is a chi-square distribu-tion with degrees of freedom equal to the distribudistribu-tion in the degrees of freedom between the full model and reduced model.
The hypothesis test is H0: Qi= Qjfor all pairs (i,j) vs Ha: Qiπ Qjfor at least one pair (i,j). There are f = Rp–p = (R–1)p degrees of freedom, where R is the number of data sets and p is the number of parameters. A significant ratio indicates a reduced model is not statistically similar to the full model.
If the equality of those LW relationships obtained from different temporal scales was satisfied, all the samples were combined to derive the LW relationship for the whole samples. The resultant LW relationship was compared graphically with other studies.10 However,
statistical analyses were not applied to the comparison because only mean values were available for all of the other studies.
RESULTS
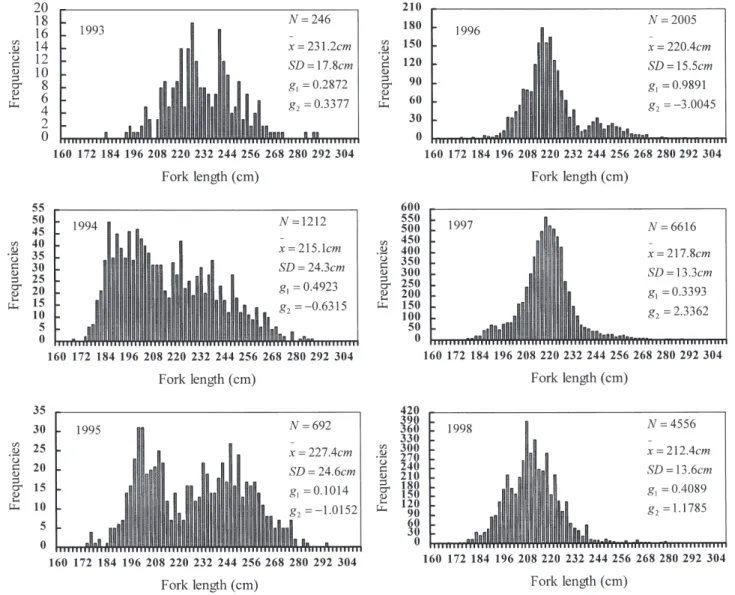
The annual length compositions (Fig. 2) of Pacific northern bluefin tuna taken by Taiwanese longline fleets were examined for normality. The results of the
c 2 2 = - lnÊËL ˆ¯ L R F lnLF max lnLi. i R = =
Â
1 ˆ ˆ . si ij i i j n Y Y n i 2 2 1 =(
-)
=Â
max ln ˆ , ˆ ln ˆ , Li i i Yi n i i Q s { } ps(
)
= - 2[
(
2 2)
+1]
ity examination for the 1993–1998 annual actual size dis-tributions show either skewness or kurtosis to depart from a normal distribution: skewness to the right and lep-tokurtosis in 1993, 1997 and 1998, and platy-kurtosis in 1994, 1995 and 1996 catch-at-size distributions. Hence, the normality test was not met so that the test of dis-persion was not necessary for size composition examina-tion, because there were different age-classes caught from year to year.
Furthermore, the catch-at-size (Fig. 3), which was compiled from annual actual size composition, was sepa-rated out using the Yukinawa and Yabuta (1967) growth equation.12 As previously reported, the reproduction
period for the study species is during June.16 Then, the
age was taking account from July to June of the next year instead of from January to December as is usual. There-fore, the catch-at-age was obtained as shown in Fig. 3, revealing that the major age-classes of Pacific northern bluefin tuna caught by Taiwanese small-scale longline fleets varied from year to year. The major age-classes are 8-year-old in 1993, 6-year-old in 1994, 6- and 7-year-old in 1995, 7- and 8-year-old in 1996, 8-year-old in 1997 and 7-year-old in 1998.
Five sets of LW measurements were made on 1774 Pacific northern bluefin tuna collected off the eastern Taiwan coast from May and June, 1997 and 1998, and one set on 318 samples collected irregularly at various times. The latter samples have most fork lengths smaller than 170 cm, but the former samples ranged between 170 and 290 cm. Due to the different sampling time period, five data sets sampled were separately fitted by the power function, W = aFLb. The likelihood ratio test was used
to examine the equality of parameters of the LW rela-tionships derived from those different data sets.
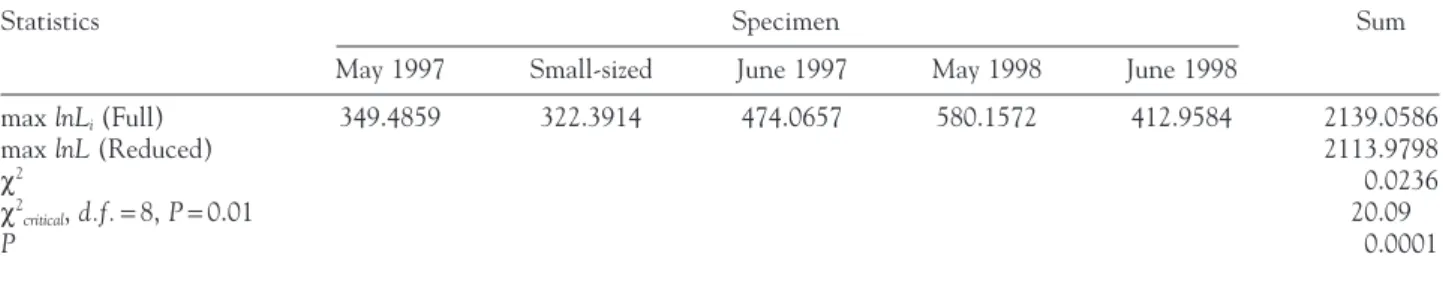
All of the derived LW relationships are highly signifi-cant (P <0.001) among five regression lines (Table 1). The residual analysis (Fig. 4) illustrates those current fits are appropriate, assuming that the normal distribution with an additive error for the LW relationship was met. Furthermore, to take account of two parameters together for the LW relationship model, the likelihood ratio test was pursued as Eqns 1–4 for comparing five LW rela-tionships. The result of likelihood ratio test (Table 2) indicates no significant difference (P <0.001) among the five samples collected. It may indicate that those five LW relationships are identical in their tendency and those five data sets of the samples could be combined for the derivation of a LW relationship for Pacific northern bluefin tuna.
The relationship between fork length (L) and evis-cerated weight (W) could be derived from 1774 com-bined individuals (Fig. 5). The relationship yielded an R2
of 0.987 (r = 0.993, P <0.001):
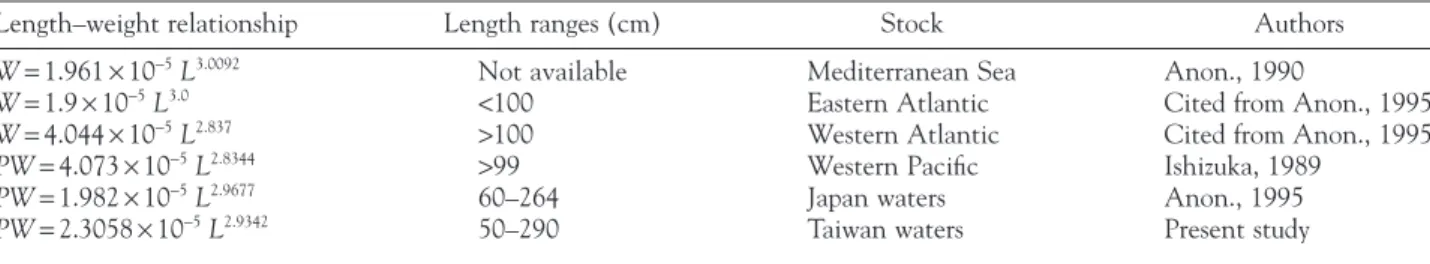
Comparison of the LW relationship derived here with those from various studies (Table 3) suggested very little
Fig. 2 Fork length distribution of Pacific northern bluefin tuna caught by Taiwan small-scale longline fleets operating in the south-western North Pacific (off the Taiwan coast) from 1993 to 1998, where N is the individuals measured, x is the mean and SD is the standard deviation, g1and g2statistics are used to examine the skewness and kurtosis of the normal distribution, respectively.
Table 1 Regression parameters and statistics for the fork length (FL, cm)–eviscerated weight (W, kg) relationships, W = aFLbof
Pacific northern bluefin tuna collected from the different seasons of May and June, 1997 and 1998, respectively, and the small-sized specimen from various times before 1993
Fishing seasons Ln - Ln regression
Sx2 Sxy Sy2 n b a ¥ 10-5 Residual F r SS May 1997 1.9267 5.2794 16.4306 313 2.7401 6.6400 1.9644 1145.13** 0.938 June 1997 2.6666 8.0564 26.0430 372 3.0212 1.3960 1.7028 2644.43** 0.967 May 1998 1.4871 4.3009 14.1481 431 2.8922 2.9899 1.7093 1560.94** 0.938 June 1998 1.5954 4.6505 15.3099 340 2.9149 2.5174 1.7540 1306.14** 0.941 Small-sized 8.4819 24.3450 72.3274 318 2.8702 3.1206 2.4511 4504.22** 0.983
or no difference from that reported by Ishizuka (1989)3
and Anon. (1995),10 but different to Anon. (1990)17
(Fig. 6). Ishizuka (1989)3 and Anon. (1995)10 also used
eviscerated weights to estimate the LW relationship for Pacific northern bluefin tuna from the northwestern
Pacific, and Anon (1995)10used round weights of
north-ern bluefin tuna from the Atlantic. The LW relationship collected off the Sea of Japan,10 northwestern Pacific
waters3 and off the Taiwan coast (the present study)
shows that there is no significant difference in visual Fig. 3 The age composition of the catches of Pacific northern bluefin tuna by Taiwanese small-scale longline boats in the south-western North Pacific waters from 1993 to 1998, where the catch-at-age was sliced from catch-at-length raised to catch with the growth equation of Yukinawa and Yabuta (1967).12
Fig. 4 The residual plot of fitting length–weight relationships derived from five data sets for assuming a normal additive error, in which (a) is from the data sample in May 1997, (b) in June 1997, (c) in May 1998, (d) in June 1998 and (e) the small-sized fish. Results show that residual distributions seem coincident to the error assumption.
Fig. 5 The fork length (L) – eviscerated weight (W) relation-ship of Pacific northern bluefin tuna collected from south-western North Pacific (off Taiwan Coast).
Fig. 6 Comparisons of the length–weight relationships derived from the present study with some previously reported curves, where PW is the eviscerated weight (kg), W is the round weight (kg) and L is the fork length (cm). The curves correspond to equations from the top down, and curves num-bered 1 and 2, 3 and 5 are too similar to be distinguishable.
Table 2 The likelihood ratio tests for the parameter equality of the length–weight relationships of Pacific northern bluefin tuna derived from five different data sets collected from the southwestern North Pacific
Statistics Specimen Sum
May 1997 Small-sized June 1997 May 1998 June 1998
max lnLi(Full) 349.4859 322.3914 474.0657 580.1572 412.9584 2139.0586 max lnL (Reduced) 2113.9798 c2 0.0236 c2 critical, d.f. = 8, P = 0.01 20.09 P 0.0001
comparison, and the similar LW relationship may suggest that these data sets were sampled from the same stock. However, the result obtained from the current study provides samples from a wider range of fork length to derive the LW relationship, and provides a LW relationship of Pacific northern bluefin tuna from the southwestern North Pacific region that is different from the traditional areas of the northwestern North Pacific.
DISCUSSION
The current study contributes two important features for further assessment on Pacific northern bluefin tuna.
First, the variation of age-classes derived from the annual catch of Taiwanese small-scale longliners may reveal that the presence of the species around Taiwan waters is on route for spawning migration. The exact migratory route for this species is not very clear, but the two assumed spawning grounds are in the Sea of Japan and around the waters off Yaeyama Islands. The latter spawning aggregation was fished by tuna longliners.16,18
Also the progressive larvae surveys show that sizes of larvae of Pacific northern bluefin tuna are smaller caught from the southwestern than the northwestern North Pacific (TS Chiu, Department of Zoology, National Taiwan University, pers. comm.1996). This survey may indicate that the species spawn somewhere in the waters off eastern and/or northeastern Taiwan and the larvae gradually drift northward to the waters around Japan by the kuroshio current. Therefore the age composition obtained in the current study may partially support this prediction, because almost all the Taiwan catches are mature adults fished from the southwestern North Pacific. To provide evidence for this prediction, a spatial and temporal study on ovary development is currently being conducted by our staff.
Second, the current study provides a new LW rela-tionship derived from a wider fork length range (FL = 50–290 cm; Table 3) than previously reported. The equa-tion could be used in catch conversion from number into
weight and in the assessment analyses, if the stock in southwestern North Pacific caught by Taiwanese small-scale longliners is from similar stock to those from the waters around Japan caught by Japanese fisheries. Reviewing the size/age composition, very large fish were rare in the catches of northwestern North Pacific,7but
this was also found in the present study. The adult fish distribute in the southwestern North Pacific and Nansei Shoto area.16Traditionally, two stocks were assumed for
informally managing the study species, but a preliminary study using micro-satellite loci showed no difference among the samples from the North Pacific.19 If the
Pacific northern bluefin tuna belong to one stock, the current LW relationship result will be useful in future assessment work. To consider all Pacific northern bluefin tuna as a unit stock from the western North Pacific is essential as large- and small-sized fish can be pooled together in an analysis. Accordingly, it seems insufficient that only the LW relationship comparison be used to indirectly depict the possibility of classifying stock. Also from a biological point of view, it would be possi-ble to classify a stock as similar to the northwestern Pacific because of the actual small differences in weight at length.3,10 Based on management purposes, two
stocks were primarily assumed; however, we suggest the biological viewpoint needs to be created in future to identify the stock structure.
Although there were differences in time for sampling data sets used to derive the LW relationship, the result obtained by likelihood ratio test shows no statistical significance (P <0.0001) for the model used. Thus, it is reasonable to combine five data sets to estimate the LW relationship. However, robust regression procedures, such as the least median of squares were used to diagnose outliers within the data sets.20,21It is difficult to identify
outliers from a residual plot, as shown in Fig. 4, because the outliers always pull the regression line towards them-selves.22Thus the outlier detection was made for some
regression analyses.23,24However, we have not proceeded
with this procedure because the likelihood ratio test shows no difference among data sets (Table 2) and the outlier detection may not always make the LW relation-ship fitting different.24
Table 3 Some representatives of the length–weight relationship of northern bluefin tuna
Length–weight relationship Length ranges (cm) Stock Authors
W= 1.961 ¥ 10-5L3.0092 Not available Mediterranean Sea Anon., 1990
W= 1.9 ¥ 10-5L3.0
<100 Eastern Atlantic Cited from Anon., 1995
W= 4.044 ¥ 10-5L2.837
>100 Western Atlantic Cited from Anon., 1995
PW= 4.073 ¥ 10-5L2.8344 >99 Western Pacific Ishizuka, 1989
PW= 1.982 ¥ 10-5L2.9677 60–264 Japan waters Anon., 1995
PW= 2.3058 ¥ 10-5L2.9342 50–290 Taiwan waters Present study
(L), the length used is fork length; PW, indicates the eviscerated weight that was measured after gilled and gutted processing; and W, the round weight.
3. Ishizuka Y. Estimates of Catch and Age Compositions for North-ern Bluefin Tuna (Thunnus Thynnus) Caught by Japanese Fisheries in the Pacific Ocean During 1966 to 1986. National Research Institute of Far Seas Fisheries, Shimizu, Shizuoka, Japan. 1989. 4. Bayliff WH. Status of northern bluefin tuna in the Pacific Ocean.
Inter-American Tropical Tuna Commission, Special Report 1991; 7:
29–88.
5. Bayliff WH. A review of the biology and fisheries for northern bluefin tuna, Thunnus thynnus, in the Pacific Ocean. FAO Fisheries
Report 1994; 336: 244–295.
6. Bayliff WH, Ishizuka Y, Deriso RB. Growth, movement, and attri-tion of northern bluefin tuna, Thunnus thynnus, in the Pacific Ocean, as determined by tagging. Inter-Am. Trop. Tuna Comm.
Bull. 1991; 20: 1–94.
7. Nishida T. Preliminary attempt to standardize catch rate of Pacific northern bluefin tuna (Thunnus thynnus) based on the Japanese longline fisheries data. Paper prepared for the Pacific Northern Bluefin Tuna Workshop, held in the Inter-American Tropical Tuna Commission, La Jolla, CA. 1997; May 23–24.
8. Hsu CC, Lin MC. The recent catch estimating procedures of Taiwanese longline fisheries. International Commission for the Conservation of Atlantic Tunas. Collective Volume of Scientific
Papers 1996; 43: 175–177.
9. Hsu CC. The length–weight relationship of albacore, Thunnus
alalunga, from the Indian Ocean. Fish. Res. 1999; 41: 87–92.
10. Anon. Review of length–weight and age-length relationship on Pacific northern bluefin tuna. In: Report on Pacific Northern Bluefin
Tuna Survey Around Japan. National Research Institute of Far Seas
Fisheries, Shimizu, Shizuoka, Japan. 1995; 371–386 (in Japanese). 11. Yukinawa M, Yabuta Y. Age and growth of bluefin tuna, Thunnus
thynnus (Linnaeus), in the north Pacific Ocean. Nankai Regional Fish. Res. Lab. Rep. 1967; 25: 1–18.
12. Sokal RR, Rohlf FJ. Biometry, 3rd edn. W. H. Freeman and Company, New York. 1995.
13. Quinn TJ, Deriso RB. Quantitative Fish Dynamics. Oxford Univer-sity Press, New York. 1999.
14. Kimura DK. Likelihood models for the von Bertalanffy growth curve. Fish. Bull. 1980; 77: 765–776.
15. Cerrato RM. Interpretable statistical tests for growth comparisons using parameters in the von Bertalanffy equation. Can. J. Fish.
Aquat. Sci. 1990; 47: 1416–1426.
16. Tanaka S. Spawning season of Pacific bluefin tuna estimated from histological examination of the ovary. Manuscript submitted to NRIFSF/IATTC Joint Workshop on Pacific Northern Bluefin Tuna. December 8–9, 1999. Shimizu, Japan. 1999.
17. Anon. Report of GFCM/ICCAT Expert Consultation on Evalua-tion Stocks of Large Pelagic Fishes in the Mediterranean Area. International Commission for the Conservation of Atlantic Tunas.
Collective Volume of Scientific Papers 1990; 33: 44.
18. Shimizu H, Yano K. The fishing of bluefin tuna in spawning ag-gregations around Yaeyama Islands. Paper submitted to the NRIFSF/IATTC Joint Workshop on Pacific Northern Bluefin Tuna, December 8–9, 1999, Shimizu, Japan. 1999.
19. Tagaki M, Okamura T, Chow S, Taniguchi N. PCR primers for microsatellite loci in tuna species of the genus Thunnus and its application for population genetic study. Fisheries Sci. 1999; 65: 571–576.
20. Rousseeuw PJ. Least median of squares regression. J. Am. Stat.
Assoc. 1984; 79: 871–880.
21. Rousseeuw PJ, Leory AM. Robust Regression and Outlier Detection. Wiley, New York. 1987.
Accurately weighing very large northern bluefin tuna caught by longline fleets is difficult; however, counting individuals caught and measuring fork lengths are pos-sible. Therefore, the round weight-at-length can be esti-mated from this LW relationship multiplying a scaling factor of 1.112.10 Moreover, the widest range of fork
lengths was used to derive the LW relationship in the present study (cf. Table 3). As usual, the annual catch of Taiwan longline fleets was based on landings reported by trade agencies and logbooks recorded in numbers and submitted by captains.8There may be under-reporting in
the trade reports, and inaccuracy can exist with on-board weighing, especially for this very large and valuable northern bluefin tuna. Hence, the LW relationship derived here is thought to be a useful tool for estimating the numbers of fish caught at length or age, and for com-piling the catch from individuals to total biomass in the Taiwan commercial longline fisheries.
Stock assessments for Pacific northern bluefin tuna were not available. Although Nishida7 and Watters25
have derived standardized catch rates of Pacific northern bluefin tuna, actual implementations were not begun due to lack of catch data integration, biological charac-teristic parameters estimation and fundamental fisheries knowledge. In Taiwan, the Pacific northern bluefin tuna fishery began in the early 1950s using small-scale longline fleets (<100 GRT), but became seasonally targeted from 1990 during April–June each year. The annual catch of the species was according to the migra-tory age-classes off the Taiwan coast. To date, Pacific northern bluefin tuna is becoming one of the most economically important species for Taiwan small-scale longline fleets. Therefore, fishery-dependent data collection and biological studies are being pursued. Moreover, further virtual population analysis assessment is in progress for Pacific northern bluefin tuna using the LW relationship derived here and size compositions col-lected in the present study.
ACKNOWLEDGMENTS
This study was fully supported by the Council of Agri-culture, Taiwan in contract no. 88-AST-1.4-FID-06(06). We also thank the critical comments of two anonymous referees for their valuable advice.
REFERENCES
1. Smith PJ, Conroy AM, Taylor P. Biochemical-genetic identifica-tion of northern bluefin tuna Thunnus thynnus in the New Zealand fishery. NZ. J. Mar. Freshwater Res. 1994; 28: 113–118. 2. Anon. Detailed report – bluefin tuna. International Commission
for the Conservation of Atlantic Tunas. In: Collective Volume of
22. Sen AK, Srivastava MS. Regression Analysis: Theory, Methods and
Applications. Springer, New York. 1990.
23. Chen Y, Jackson DA, Paloheimo JE. Robust regression approach to analyzing fisheries data. Can. J. Fish. Aquat. Sci. 1994; 51: 1420–1429.
24. Hsu CC. The length–weight relationship of albacore, Thunnus
alalunga, from the Indian Ocean. Fisheries Res. 1999; 41: 87–92.
25. Watters G. CPUEs of Pacific bluefin tuna in a core fishing area extending from the coast of Japan to 150°W: using regression trees to hypothesize about CPUEs times and areas in which there was no fishing. Paper submitted to the NRIFSF/IATTC Joint Work-shop on Pacific Northern Bluefin Tuna, December 8–9, 1999, Shimizu, Japan. 1999.