公司治理機制對個別類型投資人交易行為之影響性 - 政大學術集成
67
0
0
全文
(2) Abstract This paper discuss the issue of how corporate governance variables affect the cognitions of groups of investors to lead they separate their investment strategies in 1997-2011 sample period, the results indicate that firms with higher management stockholdings, lower blockholders’ shareholdings, smaller board size, more outside independent supervisors, CEO duality, and one of ultimate controllers served as chairman would be appealing to individual investors; the robust test from 2007 to 2011 only positively affects th e investment strategies for foreign institutional. 政 治 大. investors. Moreover, we explore that lower blockholders’ stockings and smaller board. 立. size are favorable characteristics for investors to increase firms’ trading volumes but. ‧ 國. 學. also the trading volatilities. Finally, we compute the corporate governance score for every sample company called CG-Index, and discover a perfect corporate governance. ‧. mechanism would inspire investing motivations of domestic individuals and foreign. y. Nat. io. sit. institutions, after considering the information disclosure ranking in 5 years sample. n. al. er. period, the stockholding of whole individual investors is indicated positive related to the corporate governance degree.. Ch. engchi. i n U. v.
(3) Contents I.. Introduction ................................................................................................................ 1. II.. Literatures and Hypotheses ....................................................................................... 4. III.. Data and Variables ..................................................................................................... 9. A.. Data .............................................................................................................................. 9. B.. Variables ................................................................................................................... 11. IV.. A. B.. Methodology and Empirical Results ....................................................................... 15. 政 治 大 Correlation Analysis立 ................................................................................................. 23 Descriptive Statistics ............................................................................................. 16. Investors’ Investment Behaviors ........................................................................ 28. D.. Trading Volumes and Trading Volatilities ............................................................ 39. E.. The Effect of Corporate Governance Index on Trading Activities ...................... 47. ‧. ‧ 國. 學. C.. y. Nat. VI.. References ................................................................................................................. 62. n. al. er. sit. Conclusions ............................................................................................................... 59. io. V.. Ch. engchi. i n U. v.
(4) I.. Introduction There are innumerable literatures getting research on Corporate governance. mechanisms, prior research examines how internal corporate governance as board structure, managerial compensation, and charter provisions; external corporate governance as legal or regulatory environments and markets for corporate control affect firm value, cost of capital, and stock returns. We can see Shleifer and Vishny (1997), La Porta et al. (2000), Gompers et al. (2003), Bebchuk et al. (2005), Ashbaugh et al. (2006), and Masulis et al. (2008), and Gillan (2006) is a clear recent. 政 治 大. survey of corporate governance literature.. 立. Much of the contemporary interest in corporate governance is concerned with. ‧ 國. 學. mitigation of the conflicts of interests between stakeholders, the impact of stock. ‧. returns and market liquidities, or the quality of audit so far, with no doubt, that an important theme of corporate governance is the nature and extent of accountability of. y. Nat. io. sit. people in the business. But there are few of researches to explore the relationship. n. al. er. between investors’ beliefs or behaviors and corporate governance, not to mention that. Ch. i n U. v. separating the behaviors of individual investors and institutional investors, therefore,. engchi. in this article, we wish to discuss the issue of how corporate governance affects investors’ cognition to lead they have different investment behaviors, moreover, we want to explore that whether corporate governance is an effective index to affect trading volumes even trading volatilities, in another word, whether corporates’ trading activities would be more stable by a series of better corporate governance variables. Most of the researches about corporate governance focused on internal corporate governance, because of several hot issues and problems are all derived from it, for example, in large firms where there is a separation of ownership and management 1.
(5) with. no. controlling. shareholder,. the principal–agent. issue arises. between. upper-management (the agent) and shareholders (the principals), which may have very different interests, and the management considerably know more information than shareholders, then the danger arises that rather than overseeing management on behalf of shareholders, the board of directors may become insulated from shareholders and beholden to management, this aspect is particularly present in contemporary public debates especially after the famous ENRON, WorldCom Group events, and other related scandals happened sequentially. Besides, another important. 政 治 大 described by the Organization. issue obtained from internal corporate governance is a company’s financial and operational transparency, as. 立. for Economic. Co-operation and Development (OECD) Principles of Corporate Governance,. ‧ 國. 學. involves the timely disclosure of adequate information concerning a company’s. ‧. financial performance, as well as commercial objectives, ownership structures,. sit. y. Nat. remuneration, related party transactions, governance structures, and internal controls.. n. al. er. io. As we know, the principle-agent issue and transparency problem are probably the. i n U. v. most significant concerns while investors putting themselves into the investment. Ch. engchi. activities. Therefore, we choose to explore the impact of internal corporate governance on investors’ behaviors in our article, also, we are interested in discuss the individual investors’ investment choices, because a number of literatures prove that individual investors are irrational and impulsive, which is incorporating several of behavioral biases such as investors’ overconfidence, one of the simplest and commonest bias, Barber and Odean (2000) is a classic article in attributed investors’ behavioral bias to overconfidence, they verify the high costs associated with the average household turns over approximately 75 percent of its common stock portfolio annually for the six years ending in January 1997, which is caused the poor 2.
(6) performance of household portfolio, they believe people are overconfident so as to too much trading. There is a problem due to exploring the relationship between investor’s behavior and corporate governance extent investors’ perceptions of corporate governance effectiveness, especially individual investors. Because we are not sure about how well investors understand the corporate governance and board mechanism, we also can not sure how much investors make decisions depend on these mechanisms and variables, or how much the bias occur under their consideration of investment behaviors, so. 政 治 大 investment amount are maybe 立 invalid indicators to discussing corporate governance their judgments on companies’ investment risk, investment holding period, and. ‧ 國. 學. problem. But the objective of this article is straightly forward to discuss the relationship between investors’ behaviors and corporate governance mechanisms, so. ‧. we will review some literatures in next part, and then construct some assumptions. sit. y. Nat. based on them.. n. al. er. io. Few researches explore the relationship between types of investors’ behaviors and. i n U. v. corporate governance variables, so we are interested in discuss how corporate. Ch. engchi. governance lead investors to allocating their stockholdings, especially individual investors, because individual investors are generally seemed irrational and impulsive by kinds of behavioral biases. Moreover, we want to explore that whether corporate governance is an effective index to affect trading volumes even trading volatilities through a corporate governance index.. 3.
(7) II. Literatures and Hypotheses The capital market situation has been more disordered after the Asia monetary crush in 1997, the financial crisis events of Taiwan listed companies in last-half 1998 to market investors, and American large enterprise fraud cases in the end of 2001, these events not only make the investors lose their confidence in plunging their money into investment activities but also let the official authorities and investors realize that the sound corporate governance mechanism is one of the key factors to stabilize the capital market and appeal international funds. According to the report by. 政 治 大 corporate立 governance is an important. McKinsey & Company in 2002, it indicates that many institutional investors have recognized that. indicator for investment. ‧ 國. 學. decisions. Following the huge damage caused by loosely internal corporate governance, people intend on discuss the related issues, the problem seems more. ‧. serious in emerging markets. Klapper and Love (2003) explore the determinants of. sit. y. Nat. firm level governance and find that governance is correlated with the extent of the. n. al. er. io. asymmetric information and contracting imperfections that firms face. They also find. i n U. v. that firm-level corporate governance provisions matter more in countries with weak. Ch. engchi. legal environments. Finally, they provide evidence that better corporate governance is highly correlated with better operating performance and market valuation. One of the classic firm level governance issues is discussing the relationship of firm level governance and equity prices, such as Gompers, Ishii and Metrick (2003), they use 24 distinct corporate-governance provisions for a sample of about 1500 firms per year during the 1990s to build a Governance Index, and find that corporate governance is strongly correlated with stock returns, and the weak shareholder rights caused poor performance in the 1990s. They summarize that firms with stronger. 4.
(8) shareholder rights had higher firm value, higher profits, higher sales growth, lower capital expenditures, and made fewer corporate acquisitions. Griffin, Nardari and Stulz (2007) is also a hot issue research by exploring whether investors trade more when stocks have performed well in the past, they get the evidence from 46 Countries to investigating the dynamic relation between market-wide trading activity and returns in 46 markets, and find many stock markets exhibit a strong positive relation between turnover and past returns. Finally, Chung, Elder, and Kim (2010) touch the important issue of corporate Governance and liquidity, they show that companies with better. 政 治 大 narrower quoted and effective spreads, higher market quality index, smaller price 立 corporate governance generally have greater stock market liquidity as measured by. impact of trades, and lower probability of information based trading. They also find. ‧ 國. 學. that changes in their liquidity measures are significantly related to changes in. ‧. governance index over time, suggesting that firms can improve stock market liquidity. sit. y. Nat. by adopting better governance standards.. n. al. er. io. Hypothesis 1. The better corporate governance performance would lead to higher. i n U. v. trading volume level and lower trading volatility.. Ch. engchi. We then take a look of some other corporate governance issues which are more concerned in our article, Ting (2009) try to identify whether the corporate governance mechanism is a major determinant for IPO firms which intend to attract the institutional investors, the result indicates that firms with higher blockholder shareholdings, more control shareholders on the board, and better information disclosure attract institutional shareholdings despite of the poor performance, because more control shareholders on the board could loosen expropriation and draw more institutional shareholdings. And after the rule's requiring setting the independent. 5.
(9) directors, the influence of corporate governance on institutional investors does change, however, the effect of the independent directors on the institutional investors exists only when the interaction term of control shareholders on the board and independent directors is concerned in the model. In this article, we consider shareholders on the board and independent directors as two corporate governance variables to observe the investors’ behaviors. We think exploring the corporate governance issue by investors’ view is interested, as shown by Hsiao (2008), it indicate that among previous studies regarding the issue. 政 治 大 perspective, however, the relationship 立. of board of directors, the majority of researchers focused their studies on the board’s operations from firm’s. between board. ‧ 國. 學. effectiveness and investor’s behavior is relatively unexplored. Therefore, they examine whether the investment behavior of the investors will be influenced by the. ‧. effectiveness of the board of directors and whether the relationship between. sit. y. Nat. effectiveness of the board and investment behavior will be moderated by the type of. n. al. er. io. investors through survey questionnaires. They separate their researched objectives. i n U. v. into two groups, which are professional and non-professional, and the result indicate. Ch. engchi. the investors’ perceptions of board effectiveness significantly influence their evaluation, when investors perceive strong-form of the effectiveness of the board, the investors tend to believe the investment risk of the company is lower, they would like to invest larger amount of money and to hold the investment longer. Then, investors’ perceptions of board effectiveness affect the amount of assets they are willing to invest according to different types of the investors, professional investors are willing to invest larger amount than non-professional. Yang (2008) investigate general and institutional investors’ satisfaction on. 6.
(10) corporate governance for Taiwan listed companies and find the institutional investor's satisfaction is much lower than the general investor's satisfaction. Besides, both general investors (74.8%) and institutional investors (87.1%) are willing to pay a premium for well-governed companies, while the institutional investors pay double percentage than the general investors. Lin, and Lin (2008) investigate investors’ perceptions on corporate governance for Taiwan listed common stock through out questionnaires, and find almost all the investors keep negative views of listed companies’ corporate governance, they also find the relationship between investors’. 政 治 大 controlling shareholders are positive. 立. views and functions of the board, information transparency, and the reliability of. ‧ 國. 學. Hypothesis 2. The governance variables in ownership structures, firm structures, board structures, audit structures, information transparency, and. ‧. management style make an impact on investors, especially individual. sit. y. Nat. investors.. n. al. er. io. Behind the satisfactions of different parties and the investors’ views of companies’. i n U. v. corporate governance, we should think about the investors’. Ch. engchi. perception and. conviction to corporate governance mechanism, even if professional fund managers making investment decisions, the bias exist sometimes, not to mention people could put the money in or out the markets depend on complicated factors, the investors’ cognition deficit with corporate governance mechanism is apodeictic, and we could not be sure if investors take the superficial or even wrong perceptions with corporate governance mechanism into consideration while engaged in investment activities, if so, then our estimation based on investors care about corporate governance extent would be null, therefore we assume that people have at least correct cognition with. 7.
(11) corporate governance mechanism here. There is a study focused on investigating the relationship between corporate governance characteristics and corporate cash holdings of Taiwanese listed companies, and further explores how corporate governance characteristics impact a firm’s value through the value of its cash holdings, Li (2007) shows that board size and insider dominance of the board are important determinants of cash holdings, in addition, the duality of chairman and CEO, insider dominance of the board, percentage of equity ownership held by directors, the ratio of institution stockholdings, family-control of a. 政 治 大 a firm’s cash holdings, these 立 findings are consistent with the agency view of cash. firm, the divergence between control rights and cash-flow rights all affect the value of. ‧ 國. 學. holdings. That is, managers in the firms with poor corporate governance have more incentive to influence corporate cash policies for their own benefits, and the core. ‧. agency problem between controlling shareholder and minority shareholders affect the. io. sit. y. Nat. value of cash holdings negatively.. n. al. er. Some others believe corporate governance is the most important factor in affecting. i n U. v. companies’ value that executive should pay attentions, Lin (2003) approves the. Ch. engchi. positive effects of corporate governance to firm performance, and firm performance to institutional behavior as well, the paper addresses the importance of corporate governance under poorer economic conditions, higher agency costs, and a more complicated company structure. They believe corporate governance could work effectively when the executives of companies realize the importance of the corporate governance. Hypothesis 3. The corporate governance mechanism (CG-Index) does affect the investors’ stockholdings. 8.
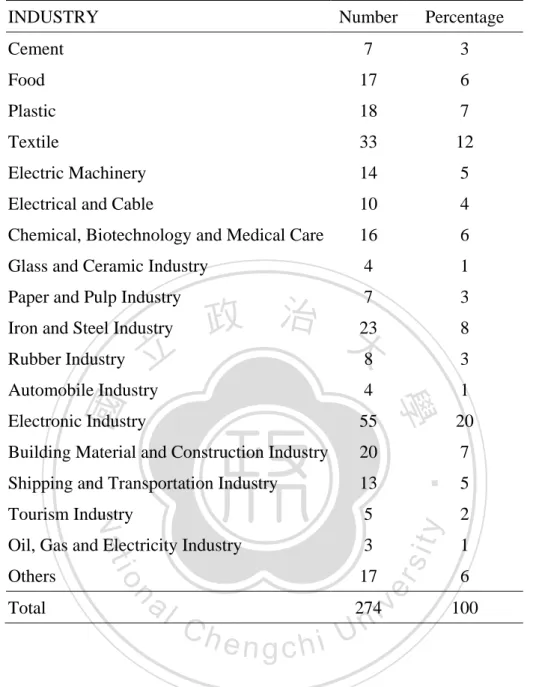
(12) III. Data and Variables In this section, we discuss our data sources and variable measurement procedures in order to make empirical tests after. A.. Data We set Taiwan stock market as our researching scope and choose Taiwanese. stock-listed companies as our researching sample, because our purpose here is to examine the effect of corporate governance on different types’ investors, especially. 政 治 大 private company transform itself to public company, companies also make the stock 立 individual investors, as we know, the information disclosure is necessary when a. ownership dispersion throughout the process, hence promoting the importance of. ‧ 國. 學. corporate governance, so we use the listed companies from 1997 to 2011 in Taiwan as. ‧. our researching sample, eliminating the companies of delisted stock, Taiwan full. sit. y. Nat. delivery stock and incomplete financial information within our sample period, the. io. n. al. er. financial industry is out of our sample range too.. i n U. v. Our sample data acquired from the Corporate Governance database, Company. Ch. engchi. database and Equity database of Taiwan Economic Journal (TEJ), also we pick the adequate sample companies by referring to Taiwan Stock Exchange Corporation (TWSE)-Securities Trading Monthly Statistics, we choose the companies from 18 different industries and get 274 sample companies, the number and percentage of each industry are showed in Table 1.. 9.
(13) Table 1. The Industrial Percentage of Sample Companies Number. Percentage. Cement. 7. 3. Food. 17. 6. Plastic. 18. 7. Textile. 33. 12. Electric Machinery. 14. 5. Electrical and Cable. 10. 4. Chemical, Biotechnology and Medical Care. 16. 6. Glass and Ceramic Industry. 4. 1. Paper and Pulp Industry. 政 治 大23. 7. 3. 8. 3. Automobile Industry. 4. 1. Electronic Industry. 55. Building Material and Construction Industry. 20. Shipping and Transportation Industry. 13. Tourism Industry. 5. Oil, Gas and Electricity Industry. 3. io. 17. 立. 7. er. al. n. Total. Ch. i n U 274. engchi. 20. ‧. Nat. Others. 學. ‧ 國. Rubber Industry. 8. y. Iron and Steel Industry. sit. INDUSTRY. v. 5 2 1 6. 100. The sample period comes over 15 years from 1997 to 2011, we find the corporate governance variables update by monthly frequency, so we separate the data into monthly frequency and yearly frequency to observe, besides, we notice some regulations about corporate governance mechanism are announced and revised following the governance much more attention in recent years, like the announcement of Regulations Governing Appointment of Independent Directors and Compliance Matters for Public Companies in 2006 and the amendment of Criteria for Review of 10.
(14) Securities Listings in 2002, and these regulations make a strict rule setting independent directors and supervisors for IPO companies, therefore, we examine the sample period only from 2007 to 2011 (5 years) also, expecting to find if governance policies affect investors’ strategy or the changes of investors’ views on corporate governance latest years.. B. i.. Variables. 政 治 大 The board of directors is立 the core mechanism for corporate governance, the board Independent Variables. ‧ 國. 學. supervises the corporate management and its operation on behalf of all shareholders and asks the management to maximize the firm’s profit, even though there exist. ‧. arguments on whether separating the CEO and chairman of the board early days,. sit. y. Nat. Brickley, Coles, and Jarrell (1997) argue the separation has potential costs, as well as. n. al. er. io. potential benefits, in contrast to most of the previous empirical work, their evidence. i n U. v. suggests that the costs of separation are larger than the benefits for most large firms,. Ch. engchi. but the state of separating the CEO and chairman of the board has been deep-rooted in global enterprise culture latest years, so we select our corporate governance variables surrounded by the related variables to board of directors. The measure of the corporate governance is referring to prior literatures and governance standards of Institutional Shareholder Service (ISS), we sort those governance standards in different categories that are most closely related to our theme, select one to two variables from each category, and conduct six aspects of corporate governance variables including ownership structures, board structures, audit structures,. 11.
(15) firm structures, information transparency, and management style. These variables are showed below, also, for the goal of easily observe, we substitute simpler codes for corporate governance variables in after tables: 1. Ownership structures . Management stockholdings (%) - The management do affect corporate policy tremendously, we define management stockholdings as the percentage of corporate management stockholdings to outstanding shares.. . 政 治 大 the percentage of corporate blockholders’ stockholdings to outstanding shares 立. Blockholders’ stockholdings (%) – According to TEJ’s definition, it is defined as. without the shares held by blockholders who serve as management or supervisors.. ‧ 國. 學. Blockholder is defined to the top ten or more than 5% shares holding. ‧. shareholders in companies, but it is possible that some shareholders holding. y. sit. io. n. al. er. can’t avoid.. Nat. more than 5% stock are included to the institutional investors, this is a flaw we. Ch. engchi. i n U. v. 2.. Board structures. . Board size – The number of board of directors.. 3.. Audit structures. . Independent outside directors – The number of independent outside supervisors in audit committee.. 12.
(16) 4.. Firm structures. . Investments in asset (%) – We define it as the ratio of the sum of long run and short run investments to asset.. 5.. Information Transparency. . Information transparency and disclosure ranking – According to the appraisal made by Securities and Futures Institute from 2003, the information disclosures. 政 治 大 the digital proxies of立 these levels to change them into continuous variables, 7. extent is judged in seven levels which is A++, A+, A, A-, B, C, and C-, we make. ‧. ‧ 國. C-.. 學. grade substitutes for A++, 6 grade substitutes for A+, …, 1 grade substitutes for. sit. y. Nat. . CEO Duality – The CEO serves in the chairman’s position concurrently, we. n. al. er. Management style. io. 6.. Ch. engchi. i n U. v. measure it by using a dummy variable, if there is a positional duality, it is represented by 1; if not, 0. . Inside dominance of chairman of the board - The controlling shareholder serves in the chairman’s position concurrently, we measure it by using a dummy variable, if there is a part management, it is represented by 1; if not, 0.. . Inside dominance of CEO - The controlling shareholder serves in the CEO’s position concurrently, we measure it by using a dummy variable, if there is a part management, it is represented by 1; if not, 0. 13.
(17) ii.. Dependent Variables. 1.. Investors’ stockholdings (%) – To explore the investors’ investment strategies, we measure the investors’ ratio of shares holding to a company’s outstanding shares. We separate investors into five types, which are individual, domestic individual, foreign individual, institutional, and foreign institutional investors. Based on TWSE – Sources of Capital of Listed Companies (by year), the sources of capital of listed companies including government agency, domestic financial institution, domestic corporation, domestic individual etc. are classified into ten. 政 治 大 domestic individuals and 立foreign individuals.. types, we define the institutional investors consist of all investors except for. ‧ 國. 學 ‧. 2. Trading volumes – To explore whether corporate governance mechanism. sit. y. Nat. impacting the trading activities of companies, we pick trading proxies as trading. io. er. value (million dollars), return (%), turnover ratio (%) to examine the effect; also, we wish to discuss whether corporate governance mechanism mitigating the. al. n. v i n C h activities, so weUexamine the standard deviation volatility occurred by the trading engchi of these variables too.. iii.. Controlling Variables There are some other variables we need to add to our models, as shown by Fama. and French (1993), the corporate size is a primary factor to affecting the stock returns, so we take it into account by using corporate asset as proxy when computing the extent of trading behaviors’ impacts; the factor of leverage ratio is under 14.
(18) consideration too, leverage is quite a decisive factor to affect the firm structure of a company, and firm structure always directly affect the strategies taking by management, shareholders, or investors, we use the ratio of long run and short run debt to asset as proxy. The past returns probably affecting the investors’ views of a corporation or the liquidity level, as shown by Griffin et al. (2007), market turnover (a liquidity proxy) is strongly and positively related to past returns in many markets, so we bring the returns of past one period and past two periods respectively into the models.. 政 治 大. 立. IV. Methodology and Empirical Results. ‧ 國. 學. In this section, first we take analyses of descriptive statistics to our researched. ‧. objectives by illustrating the mean and standard deviation of whole research samples.. sit. y. Nat. Second, in order to diagnose the co-linearity problem among the independent. n. al. er. io. variables, we adopt Pearson correlation test to measure the correlated extent among. i n U. v. each variable, and use simple Hausman-Taylor estimator to control for the potentially. Ch. endogenous explanatory variable.. engchi. After examining the relationships among variables, third, we verify Hypothesis 1 by setting an OLS Linear Regression Model between corporate governance variables and investors’ shares holding, and we pay attention to whether there is a difference between 15 and 5 years’ data due to the implement of Information transparency and disclosure ranking. Fourth, we verify Hypothesis 2 by measuring trading volume proxies imported OLS Regression Model again, and then compare the difference between 15 and 5 years’ data. Finally, we utilize the corporate governance variables. 15.
(19) used before to compute the corporate governance score for every sample company called CG-Index here, hereby we examine Hypothesis 3 by adding CG-Index into the model, the results of this test would be sufficient to let us discuss whether a company’s corporate governance extent affect all its investors investment strategies and trading activities.. A.. Descriptive Statistics. 政 治 大 behavior, and companies’ trading volume, we use the listed companies’ stocks from 立. In order to examine the connections existed among corporate governance, investors’. 1997 to 2011 in Taiwan as research sample, total is 274 firms.. ‧ 國. 學. Here we replace all of variables with clearer codes in our models and tables for the. ‧. convenience of observing, the codes as showed below:. y. Nat. MGT2: The square of Management stockholdings. n. al. Ch. engchi. BLOCK: Blockholders’ stockholdings (%). i n U. BOARD: Board size BOARD2: The square of Board Size OUTDTR: Independent outside directors INV: Investments in asset (%) ABC: Information transparency and disclosures level CEOCHR: CEO duality 16. er. io. sit. MGT: Management stockholdings (%). v.
(20) PARTCHR: Inside dominance of chairman of the board PARTCEO: Inside dominance of CEO MGTPARTCEO: The cross item of management stockholdings and inside dominance of CEO CG-Index: Corporate governance scores SIZE: Ln of asset LVG: Leverage ratio. 政 治 大 RTN (t-x) : The Return of (t-x) period, where x=1, 2 立 i. ‧ 國. 學. INDIV: Individuals Stockholdings DOINDIV: Domestic Individuals Stockholdings. ‧ sit. y. Nat. FOINDIV: Foreign Individuals Stockholdings. n. al. er. io. INSTI: Institutions Stockholdings FOINSTI: Foreign Institutions Stockholdings. Ch. LnValue: Ln of Trading Value. engchi. i n U. v. LnSDValue: Ln of Standard Deviation of Trading Value Ratio: Turnover Ratio SDRatio: Standard Deviation of Turnover Ratio Rtn: Returns SDRtn: Standard Deviation of Returns. 17.
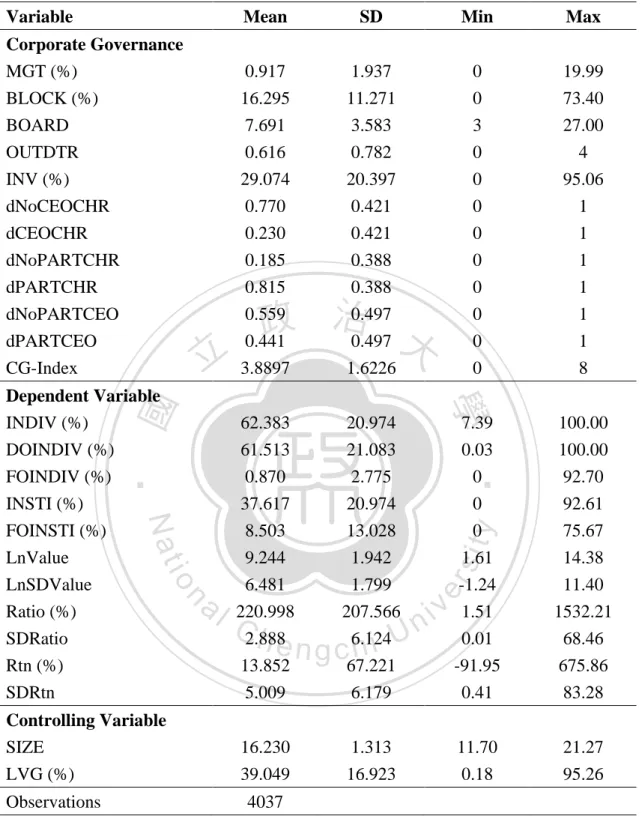
(21) Table 2. Descriptive Statistics- Results for 15 years, yearly frequency Variable. Mean. SD. Min. Max. Corporate Governance MGT (%) BLOCK (%) BOARD OUTDTR INV (%) dNoCEOCHR dCEOCHR dNoPARTCHR dPARTCHR dNoPARTCEO dPARTCEO CG-Index. 0.917 16.295 7.691 0.616 29.074 0.770 0.230 0.185 0.815 0.559 0.441 3.8897. 1.937 11.271 3.583 0.782 20.397 0.421 0.421 0.388 0.388 0.497 0.497 1.6226. 0 0 3 0 0 0 0 0 0 0 0 0. 19.99 73.40 27.00 4 95.06 1 1 1 1 1 1 8. Dependent Variable INDIV (%) DOINDIV (%) FOINDIV (%). 62.383 61.513 0.870. 20.974 21.083 2.775. INSTI (%) FOINSTI (%) LnValue LnSDValue Ratio (%) SDRatio Rtn (%) SDRtn. 37.617 8.503 9.244 6.481 220.998 2.888 13.852 5.009. 20.974 13.028 1.942 1.799 207.566 6.124 67.221 6.179. 16.230 39.049. 1.313 16.923. n. Observations. engchi. 100.00 100.00 92.70. 0 0 1.61 -1.24 1.51 0.01 -91.95 0.41. 92.61 75.67 14.38 11.40 1532.21 68.46 675.86 83.28. 11.70 0.18. 21.27 95.26. y. sit er. io. Controlling Variable SIZE LVG (%). Ch. 7.39 0.03 0. ‧. Nat. al. 學. ‧ 國. 立. 政 治 大. i n U. v. 4037. CG-Index denotes the governance index, we obtain CG-Index for each firm by awarding one point for each governance standard that is met, the standard would be explained later. The dependent variable evaluated is separated into two parts, which are investors’ shares holding ratio and companies’ trading volume, besides, we measure the variability of trading volume for 15 years, yearly frequency.. 18.
(22) The results of descriptive statistics for 15 years data are showed in Table 2 and Table 3. The extreme values of blockholders’ stockholdings (BLOCK) are very large (73.40, 77.16), and the mean of independent outside directors (OUTDTR) are below 1 (0.616, 0.616), somehow it indicate corporations centralizing the ownership rights at a few shareholders, and this reflect the enterprise culture in Taiwan even other Asia countries, like Claessens and Fan (2002) address, the lack of protection of minority rights has been the major corporate governance issue in Asia. The extreme values of investment in asset (INV) are quite large (95.06, 95.42), indicating some firms may. 政 治 大 CG-Index denotes the governance index, we obtain CG-Index for each firm by 立. need to manage their firm structures as well to avoid occurring financial crisis.. awarding one point for each governance standard that is met, the standard would be. ‧. ‧ 國. 學. explained later.. The individuals Stockholdings is almost concentrated at domestic investors,. sit. y. Nat. however, there is about twenty percent shares holding by foreign institutional. n. al. er. io. investors of all the institutional stockholdings. It shows the trading volume related. i n U. v. variables here, we use trading value, trading turnover ratio, and stocks return as. Ch. engchi. factors to measure the impact of corporate governance extents to firms’ trading activity, we adopt yearly frequency data to test firms’ trading persistence especially. Two clear firm characterized variables - firm size and leverage level are included to our models, also for monthly frequency data, we add past one and two month returns to the models in order to increasing the credibility of the results.. 19.
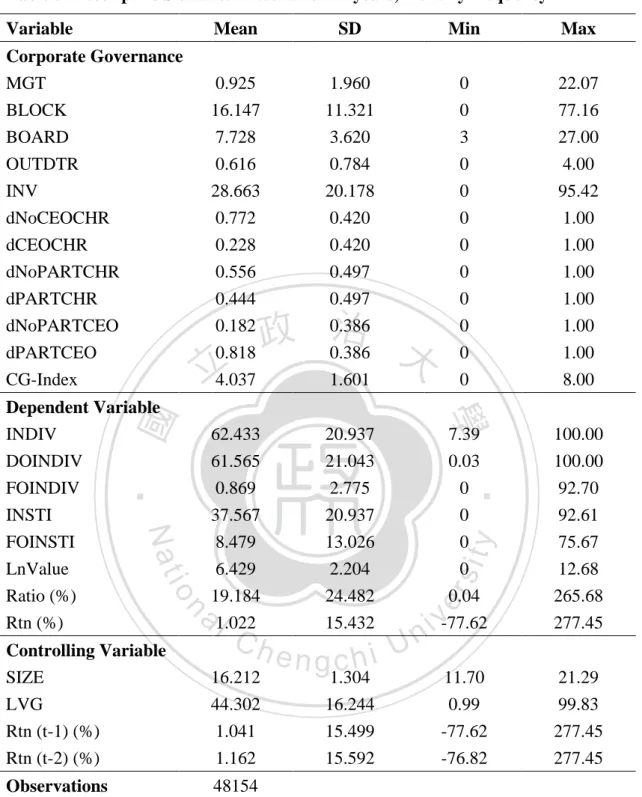
(23) Table 3. Descriptive Statistics- Results for 15 years, monthly frequency Variable. Mean. SD. Min. Max. Corporate Governance MGT BLOCK BOARD OUTDTR INV dNoCEOCHR dCEOCHR dNoPARTCHR dPARTCHR dNoPARTCEO dPARTCEO CG-Index. 0.925 16.147 7.728 0.616 28.663 0.772 0.228 0.556 0.444 0.182 0.818 4.037. 1.960 11.321 3.620 0.784 20.178 0.420 0.420 0.497 0.497 0.386 0.386 1.601. 0 0 3 0 0 0 0 0 0 0 0 0. 22.07 77.16 27.00 4.00 95.42 1.00 1.00 1.00 1.00 1.00 1.00 8.00. Dependent Variable INDIV DOINDIV FOINDIV. 62.433 61.565 0.869. 20.937 21.043 2.775. INSTI FOINSTI LnValue Ratio (%) Rtn (%). 37.567 8.479 6.429 19.184 1.022. 20.937 13.026 2.204 24.482 15.432. 政 治 大. n. 16.212 44.302 1.041 1.162. Observations. 48154. engchi 1.304 16.244 15.499 15.592. 100.00 100.00 92.70. 0 0 0 0.04 -77.62. v. 92.61 75.67 12.68 265.68 277.45. 11.70 0.99 -77.62 -76.82. 21.29 99.83 277.45 277.45. y. sit. er. io. Ch. Controlling Variable SIZE LVG Rtn (t-1) (%) Rtn (t-2) (%). 7.39 0.03 0. ‧. Nat. al. 學. ‧ 國. 立. i n U. CG-Index denotes the governance index, we obtain CG-Index for each firm by awarding one point for each governance standard that is met, the standard would be explained later. The dependent variable evaluated is separated into two parts, which are investors’ shares holding ratio and companies’ trading volume. The controlling variables include past returns for 15 years, monthly frequency.. 20.
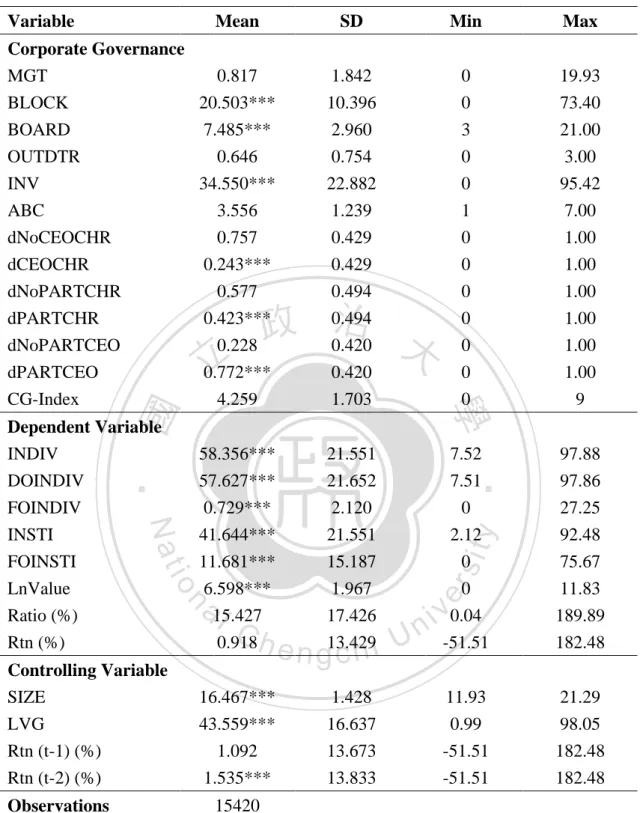
(24) To reinforce the research results, we test the corporate governance impact for shorter sample period from 2007 to 2011, as we know, the regime of information transparency and disclosure ranking (ABC) is carried out for only nine years from 2003, so we add this variable in shorter period model. The information transparency and disclosure ranking is classified into seven levels, but the mean of it is below 4 (3.556) in Table 4, indicating many firms got the level below “A-”. CG-Index included the new variable (ABC) sum up the grades of nine corporate governance variables resulting in higher statistic values in mean, standard deviation, and. 政 治 大 The t-statistics showed in 立the second column of Table 4 denote that the mean value. maximum value.. ‧ 國. 學. of the variable for 5 years data is significantly different from the corresponding value for 15 years data in Table 3 except for two incomparable variables - ABC and. ‧. CG-Index. We find several values existing differences between two sample periods,. sit. y. Nat. the values indicate block shareholders’ stockholdings and investments in asset. n. al. er. io. increased, board size down, the phenomenon of CEO duality grew up and part. i n U. v. management decreased recent years. There’s a tendency of declining individual. Ch. engchi. stockholdings and raising institutional stockholdings close years, furthermore the trading value has been risen up, and so as the firm size, but leverage level cut down.. 21.
(25) Table 4. Descriptive Statistics- Results for 5 years, monthly frequency Mean. SD. Min. Max. Corporate Governance MGT 0.817 BLOCK 20.503*** BOARD 7.485*** OUTDTR 0.646 INV 34.550*** ABC 3.556 dNoCEOCHR 0.757 dCEOCHR 0.243*** dNoPARTCHR 0.577 dPARTCHR 0.423*** dNoPARTCEO 0.228 dPARTCEO 0.772*** CG-Index 4.259. 1.842 10.396 2.960 0.754 22.882 1.239 0.429 0.429 0.494 0.494 0.420 0.420 1.703. 0 0 3 0 0 1 0 0 0 0 0 0 0. 19.93 73.40 21.00 3.00 95.42 7.00 1.00 1.00 1.00 1.00 1.00 1.00 9. Dependent Variable INDIV DOINDIV. 58.356*** 57.627***. 21.551 21.652. 7.52 7.51. 97.88 97.86. FOINDIV INSTI FOINSTI LnValue Ratio (%) Rtn (%). 0.729*** 41.644*** 11.681*** 6.598*** 15.427 0.918. 2.120 21.551 15.187 1.967 17.426 13.429. 0 2.12 0 0 0.04 -51.51. 27.25 92.48 75.67 11.83 189.89 182.48. 11.93 0.99 -51.51 -51.51. 21.29 98.05 182.48 182.48. 政 治 大. n. engchi. 16.467*** 43.559*** 1.092 1.535***. 1.428 16.637 13.673 13.833. y. sit. io. Observations. Ch. ‧. Nat. Controlling Variable SIZE LVG Rtn (t-1) (%) Rtn (t-2) (%). al. 學. ‧ 國. 立. er. Variable. i n U. v. 15420. CG-Index denotes the governance index, we obtain CG-Index for each firm by awarding one point for each governance standard that is met, the standard would be explained later. The dependent variable to be evaluated is separated into two parts, which are investors’ shares holding ratio and companies’ trading volume. The controlling variables include past returns for 5 years, monthly frequency. *** denotes that the mean value of the variable for 5 years data is significantly (at the 1% level) different from the corresponding value for 15 years data. 22.
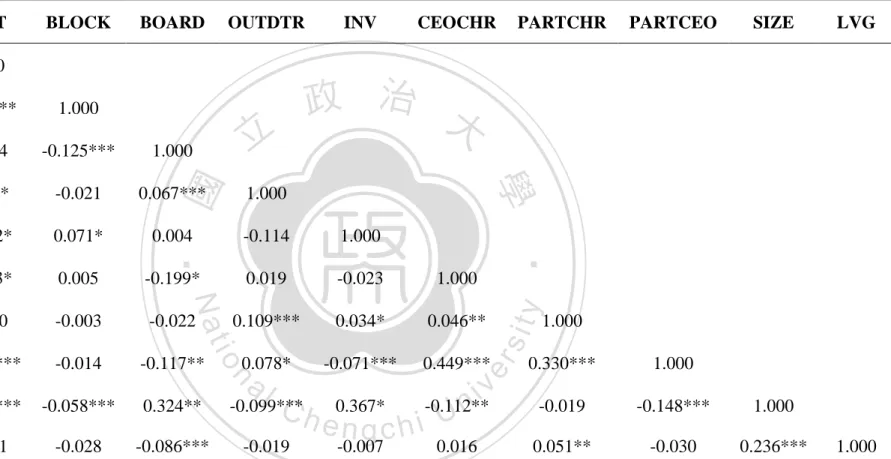
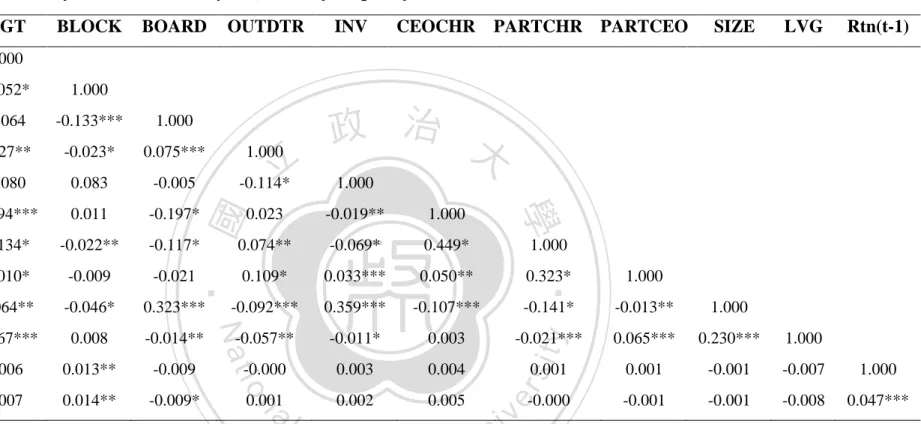
(26) B.. Correlation Analysis There is a possibility of high correlation existed among research variables affecting. the research result, therefore we employ Pearson correlation test to measure the correlated extent and co-linearity problem among the independent variables, the results are showed respectively in Table 5, Table 6, and Table 7. In generally, there is an interaction effect in a manner among corporate governance related variables, we can see a most obvious example in all three tables, blockholders’ stockholdings (BLOCK) is always negative at the 1% level related to the board size. 政 治 大. (BOARD) in either long or short sample period, indicating that blockholders’ hold. 立. fewer shares as board size expanded. Management stockholdings (MGT) is negative. ‧ 國. 學. related to blockholders’ stockholdings (BLOCK) and part management of CEO (PARTCEO) in either long or short sample period, indicating that management hold. ‧. fewer shares as blockholders’ more shares holding or the situation of inside. y. Nat. er. io. sit. dominance of CEO.. There is a common status that independent outside directors (OUTDTR) is positive. al. n. v i n C h which is mean that related to the board size (BOARD), larger is the board, more the engchi U independent outside directors would be employed; independent outside directors is positive related to inside dominance of chairman (PARTCHR) too, indicating that if firms have a state of inside dominance of chairman, then numbers of independent outside directors would be more. CEO duality (CEOCHR) is positive related to both inside dominance of chairman (PARTCHR) and inside dominance of CEO. (PARTCEO), it shows that firm with CEO duality would hire the ultimate owners of company as chairman or CEO. The controlling variables - firm size and leverage extent do not have fixed 23.
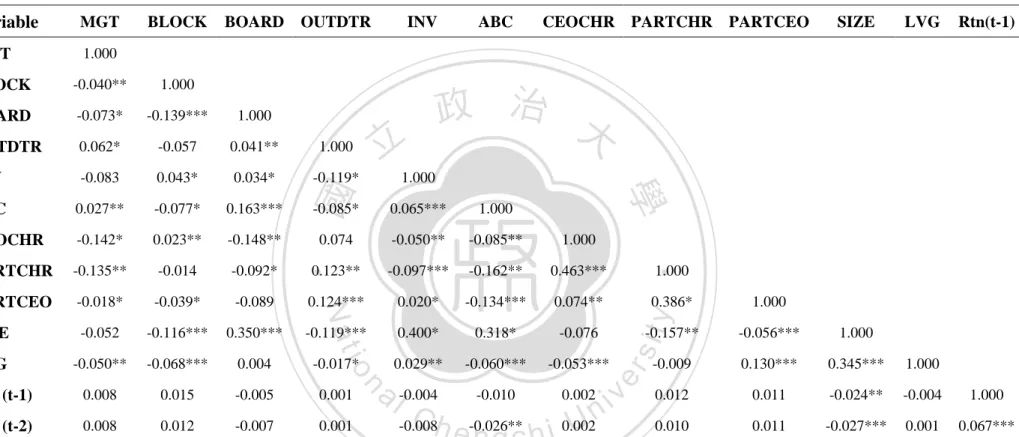
(27) relationship with corporate governance variables in either long or short sample period, despite two variables are significantly related to some governance variables. The returns were conscious of make interactive effects within different periods, so we put one period past return into the model at one time. Finally, in Table 7, we can find the information transparency and disclosure ranking (ABC) is significantly related to every governance variables, as we know, the ranking is measured by a series of governance factors even if not as same as variables we concern, so there exist an avoidless relationship between information disclosure ranking and governance. 政 治 大 For the particular character 立 of governance variables, we examine the potential. variable.. ‧ 國. 學. endogeneity among explanatory variables by Hausman-Taylor test, and find that no explanatory variables we picked are endogenous to each other. Finally, we check the. ‧. exogenous relationships between dependent and independent variables by. n. al. er. io. sit. y. Nat. Hausman-Taylor test again, the results are clear for our following tests.. Ch. engchi. 24. i n U. v.
(28) Table 5. Correlation Analysis - Results for 15 years, yearly frequency Variable. MGT. MGT. 1.000. BLOCK. BOARD. OUTDTR. INV. CEOCHR. PARTCHR. PARTCEO. SIZE. 政 治 大. -0.057**. 1.000. BOARD. -0.064. -0.125***. 1.000. OUTDTR. 0.123*. -0.021. 0.067***. 1.000. INV. -0.082*. 0.071*. 0.004. -0.114. 1.000. CEOCHR. -0.093*. 0.005. -0.199*. 0.019. -0.023. 1.000. PARTCHR. -0.010. -0.003. -0.022. 0.109***. 0.034*. 0.046**. PARTCEO. -0.135***. -0.014. -0.117**. -0.071***. 0.449***. 0.330***. 1.000. SIZE. -0.069***. -0.058***. 0.324**. -0.099***. 0.367*. -0.112**. i n U. -0.019. -0.148***. 1.000. LVG. -0.001. -0.028. -0.086***. -0.019. -0.007. 0.016. 0.051**. -0.030. 0.236***. n. Ch. y. sit. io. er. Nat. 0.078*. ‧. ‧ 國. 立. 學. BLOCK. al. LVG. engchi. v. 1.000. 1.000. The measurement of correlated extent among each independent variable (Corporate Governance related variable) and Controlling Variable by Pearson correlation test, five different dimensions of corporate governance variables included ownership, board, audit, firm, information transparency, and management style are adopted, also two controlling variables are took into account. The value is significant at * p<0.1, ** p<0.05, *** p<0.01.. 25.
(29) Table 6. Correlation Analysis - Results for 15 years, monthly frequency. MGT. 1.000. BLOCK. BOARD. OUTDTR. INV. CEOCHR. PARTCHR PARTCEO. SIZE. LVG. Rtn(t-1). BLOCK. -0.052*. 1.000. BOARD. -0.064. -0.133***. 1.000. 0.127**. -0.023*. 0.075***. 1.000. -0.080. 0.083. -0.005. -0.114*. -0.094***. 0.011. -0.197*. 0.023. -0.019**. 1.000. PARTCHR. -0.134*. -0.022**. -0.117*. 0.074**. -0.069*. 0.449*. PARTCEO. -0.010*. -0.009. -0.021. 0.109*. 0.033***. 0.050**. 0.323*. SIZE. -0.064**. -0.046*. 0.323***. -0.092***. 0.359***. -0.107***. ‧. 1.000. -0.141*. -0.013**. 1.000. LVG. -0.067***. 0.008. -0.014**. -0.057**. -0.011*. 0.003. y. MGT. -0.021***. 0.065***. 0.230***. 1.000. Rtn (t-1). 0.006. 0.013**. -0.009. -0.000. 0.003. 0.004. sit. Variable. 0.001. -0.001. -0.007. 1.000. Rtn (t-2). 0.007. 0.014**. -0.009*. 0.002. 0.005. -0.001. -0.001. -0.008. 0.047***. Nat. io. al. n. 0.001. 1.000. 學. CEOCHR. 立. 1.000. 0.001. er. INV. ‧ 國. OUTDTR. 政 治 大. iv. -0.000. n U i e h ownership, n g cincluded governance variables. Ch. The measurement of correlated extent among each independent variable (Corporate Governance related variable) and Controlling Variable by Pearson correlation test, five different dimensions of corporate. board, audit, firm, information transparency, and. management style are adopted, also two controlling variables are took into account. The value is significant at * p<0.1, ** p<0.05, *** p<0.01.. 26.
(30) Table 7. Correlation Analysis - Results for 5 years, monthly frequency MGT. MGT. 1.000. BLOCK. BOARD. OUTDTR. 1.000. BOARD. -0.073*. -0.139***. 1.000. OUTDTR. 0.062*. -0.057. 0.041**. 1.000. INV. -0.083. 0.043*. 0.034*. -0.119*. ABC. 0.027**. -0.077*. 0.163***. CEOCHR. -0.142*. 0.023**. -0.148**. PARTCHR. -0.135**. -0.014. -0.092*. PARTCEO. -0.018*. -0.039*. SIZE. -0.052. LVG. ‧ 國. 立. CEOCHR PARTCHR PARTCEO. SIZE. LVG. Rtn(t-1). 政 治 大. 1.000 0.065***. 1.000. 0.074. -0.050**. -0.085**. 1.000. 0.123**. -0.097***. -0.162**. 0.463***. -0.089. 0.124***. 0.020*. -0.134***. 0.074**. -0.116***. 0.350***. -0.119***. 0.400*. 0.318*. -0.076. -0.050**. -0.068***. 0.004. -0.017*. 0.029**. -0.060***. -0.053***. Rtn (t-1). 0.008. 0.015. -0.005. 0.001. Rtn (t-2). 0.008. 0.012. -0.007. 0.001. 1.000. 0.386*. 1.000. y. Nat. -0.085*. ‧. -0.040**. ABC. 學. BLOCK. INV. a l -0.004 -0.010 0.002 v i n C -0.008h -0.026** 0.002 engchi U. n. -0.056***. 1.000. -0.009. 0.130***. 0.345***. 1.000. 0.012. 0.011. -0.024**. -0.004. 1.000. 0.010. 0.011. -0.027***. 0.001. 0.067***. er. io. -0.157**. sit. Variable. The measurement of correlated extent among each independent variable (Corporate Governance related variable) and Controlling Variable by Pearson correlation test, five different dimensions of corporate governance variables included ownership, board, audit, firm, information transparency, and management style are adopted, also two controlling variables are took into account. The value is significant at * p<0.1, ** p<0.05, *** p<0.01.. 27.
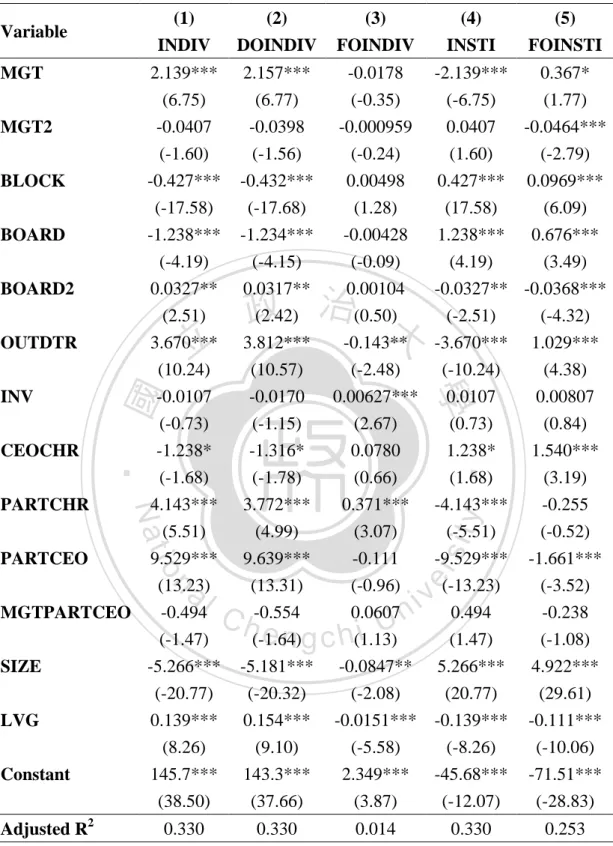
(31) C.. Investors’ Investment Behaviors We verify Hypothesis 1 by setting an OLS Linear Regression Model between. corporate governance variables and investors’ shares holding after examining the relationships among variables, than we pay attention to whether there is a difference between 15 and 5 years’ data due to the probability of investors’ advanced realization in investing activity and implement of Information transparency and disclosure ranking.. 政 治 大 yearly frequency, model (1-1) is showed below: 立. To examine Hypothesis 1, we conduct model (1-1) to test the 15 years data in. ‧. ‧ 國. 學. n. er. io. sit. y. Nat. al. (1-1). Where Yi,t : The investors’ stockholdings ;. Ch. engchi. i n U. v. (1). INDIV: individuals Stockholdings,. (2). DOINDIV: domestic Individuals Stockholdings,. (3). FOINDIV: foreign Individuals Stockholdings,. (4). INSTI: institutions Stockholdings,. (5). FOINSTI: foreign Institutions Stockholdings. In model (1-1), we consider about there may exist non-linear relationship between investors’ stockholdings and management stockholdings (MGT) or board sizes 28.
(32) (BOARD), therefore, adding the square items of management stockholdings and board sizes to the model respectively. In fact, the class of corporate governance is depend on the cognition of management, so we think of the inside dominance of CEO (PARTCEO) may reduce the effect of management stockholdings (MGT) to our dependent variable, therefore adding the cross item of inside dominance of CEO and management stockholdings, and anticipating the coefficient is negative.. 立. 政 治 大. ‧. ‧ 國. 學. n. er. io. sit. y. Nat. al. Ch. engchi. 29. i n U. v.
(33) Table 8. Regression Results for the Percentage of Investors Stockholdings - 15 years, yearly frequency (1) INDIV. (2) DOINDIV. (3) FOINDIV. 2.139*** (6.75) -0.0407 (-1.60) -0.427*** (-17.58) -1.238*** (-4.19) 0.0327** (2.51) 3.670*** (10.24) -0.0107 (-0.73) -1.238*. 2.157*** (6.77) -0.0398 (-1.56) -0.432*** (-17.68) -1.234*** (-4.15) 0.0317** (2.42) 3.812*** (10.57) -0.0170 (-1.15) -1.316*. -0.0178 -2.139*** 0.367* (-0.35) (-6.75) (1.77) -0.000959 0.0407 -0.0464*** (-0.24) (1.60) (-2.79) 0.00498 0.427*** 0.0969*** (1.28) (17.58) (6.09) -0.00428 1.238*** 0.676*** (-0.09) (4.19) (3.49) 0.00104 -0.0327** -0.0368*** (0.50) (-2.51) (-4.32) -0.143** -3.670*** 1.029*** (-2.48) (-10.24) (4.38) 0.00627*** 0.0107 0.00807 (2.67) (0.73) (0.84) 0.0780 1.238* 1.540***. (-1.68) 4.143*** PARTCHR (5.51) 9.529*** PARTCEO (13.23) -0.494 MGTPARTCEO (-1.47) -5.266*** SIZE (-20.77). (-1.78) 3.772*** (4.99) 9.639*** (13.31) -0.554 (-1.64) -5.181*** (-20.32). (0.66) 0.371*** (3.07) -0.111 (-0.96) 0.0607 (1.13) -0.0847** (-2.08). (1.68) -4.143*** (-5.51) -9.529*** (-13.23) 0.494 (1.47) 5.266*** (20.77). (3.19) -0.255 (-0.52) -1.661*** (-3.52) -0.238 (-1.08) 4.922*** (29.61). 0.139*** (8.26) 145.7*** (38.50). 0.154*** (9.10) 143.3*** (37.66). -0.0151*** -0.139*** (-5.58) (-8.26) 2.349*** -45.68*** (3.87) (-12.07). -0.111*** (-10.06) -71.51*** (-28.83). 0.330. 0.330. BOARD BOARD2 OUTDTR. Nat. io. n. al. LVG Constant Adjusted R2. Ch. engchi. t -statistics in parentheses * p<0.1, ** p<0.05, *** p<0.01. 30. ‧. CEOCHR. 學. INV. 立. (5) FOINSTI. 政 治 大. y. BLOCK. sit. MGT2. ‧ 國. MGT. (4) INSTI. er. Variable. i n U. 0.014. v. 0.330. 0.253.
(34) In next part, we are going to forecast that the direction corporate governance variables affect investors’ shares holding and trading volume, and conduct a CG-Index by grading the variables, but before that, we analyse the effect of each variable to investors’ stockholdings first. The results of model (1-1) are showed in Table 8, whole individual investors’ stockholdings (INDIV) and domestic individual investors’ stockholdings (DOINDIV) are positive related to several governance variables we picked, such as management stockholdings, independent outside directors, and inside dominance of chairman or. 政 治 大 or part management of ultimate 立 owners would raise individual investors’ faith in firms; CEO, indicating that management stockholdings increasing, more outside supervisors,. ‧ 國. 學. besides, leverage is positive related to domestic individual investors’ stockholdings too, but negative related to foreign individual investors’ stockholdings, representing. ‧. that domestic investors prefer investing firms with higher leverage ratio, and foreign. sit. y. Nat. opposite. Domestic individual investors’ stockholdings is negative related to. n. al. er. io. blockholders’ stockholdings, board size (but with non-linear relation), CEO duality,. i n U. v. and firm size, indicating that individual investors would lose their interests in. Ch. engchi. investment with blockholders’ stockholdings increasing, larger board sizes (but only a limit valid), CEO serves as the chairman, and larger firm sizes. We find that despite for whole institutional investors’ stockholdings (INSTI) or foreign institutional investors’ stockholdings (FOINSTI), the results of governance variables are being opposite at all, illustrating that institutional investors prefer blockholders holding more shares, larger board sizes (but only a limit valid), and larger firm size, but not management holding more shares, more outside supervisors, part management of ultimate owners, or higher leverage ratio, nevertheless, management stockholdings and board sizes are in a non-linear relation with foreign 31.
(35) institutional investors’ holdings. We conduct model (1-2) to test the 15 years data in monthly frequency to examine Hypothesis 1 again, model (1-2) is showed below:. (1-2). 政 治 大 (1) INDIV: individuals Stockholdings, 立. Where Yi,t : The investors’ stockholdings ;. ‧ 國. 學. (2) DOINDIV: domestic Individuals Stockholdings,. (3) FOINDIV: foreign Individuals Stockholdings,. ‧. (4) INSTI: institutions Stockholdings,. Nat. sit. y. (5) FOINSTI: foreign Institutions Stockholdings. n. al. er. io. RTN (t-x)i,t : The Return of (t-x) period, where x=1, 2. Ch. engchi. i n U. v. As last model, we consider about there may exist non-linear relationship between investors’ stockholdings and management stockholdings or board sizes, so adding the square items of management stockholdings and board sizes to model (1-2) respectively; furthermore, thinking of the inside dominance of CEO may reduce the effect of management stockholdings to our dependent variable, therefore adding the cross item of inside dominance of CEO and management stockholdings, and anticipating the coefficient is negative. The returns of past periods are took into account, we adopt the returns of one and two months earlier than other variables respectively. 32.
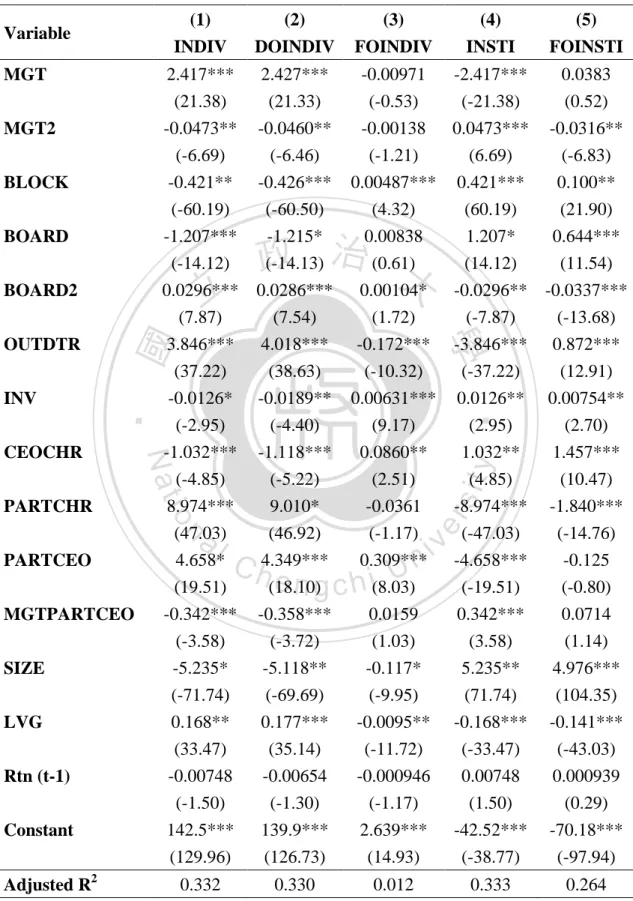
(36) Table 9. Regression Results for the Percentage of Investors Stockholdings – 15 years, monthly frequency Panel a. Return of Past One Period (1) INDIV. (2) DOINDIV. (3) FOINDIV. 2.417*** 2.427*** (21.38) (21.33) -0.0473** -0.0460** (-6.69) (-6.46) -0.421** -0.426*** (-60.19) (-60.50) -1.207*** -1.215* (-14.12) (-14.13) 0.0296*** 0.0286*** (7.87) (7.54) 3.846*** 4.018*** (37.22) (38.63) -0.0126* -0.0189**. -0.00971 (-0.53) -0.00138 (-1.21) 0.00487*** (4.32) 0.00838 (0.61) 0.00104* (1.72) -0.172*** (-10.32) 0.00631***. BLOCK BOARD. 政 治 大. 立. OUTDTR. (9.17) 0.0860** (2.51) -0.0361 (-1.17) 0.309*** (8.03) 0.0159 (1.03). -5.235* (-71.74) 0.168** (33.47) -0.00748 (-1.50) 142.5***. -5.118** (-69.69) 0.177*** (35.14) -0.00654 (-1.30) 139.9***. (129.96) 0.332. io. PARTCHR. (-4.40) -1.118*** (-5.22) 9.010* (46.92) 4.349*** (18.10) -0.358*** (-3.72). Nat. CEOCHR. (-2.95) -1.032*** (-4.85) 8.974*** (47.03) 4.658* (19.51) -0.342*** (-3.58). al. n. PARTCEO MGTPARTCEO SIZE LVG Rtn (t-1) Constant 2. Adjusted R. ‧. INV. 學. ‧ 國. BOARD2. (2.95) 1.032** (4.85) -8.974*** (-47.03) -4.658*** (-19.51) 0.342*** (3.58). (2.70) 1.457*** (10.47) -1.840*** (-14.76) -0.125 (-0.80) 0.0714 (1.14). -0.117* (-9.95) -0.0095** (-11.72) -0.000946 (-1.17) 2.639***. 5.235** (71.74) -0.168*** (-33.47) 0.00748 (1.50) -42.52***. 4.976*** (104.35) -0.141*** (-43.03) 0.000939 (0.29) -70.18***. (126.73). (14.93). (-38.77). (-97.94). 0.330. 0.012. 0.333. 0.264. Ch. engchi. t- statistics in parentheses * p<0.1, ** p<0.05, *** p<0.01 33. y. MGT2. (5) FOINSTI. -2.417*** 0.0383 (-21.38) (0.52) 0.0473*** -0.0316** (6.69) (-6.83) 0.421*** 0.100** (60.19) (21.90) 1.207* 0.644*** (14.12) (11.54) -0.0296** -0.0337*** (-7.87) (-13.68) -3.846*** 0.872*** (-37.22) (12.91) 0.0126** 0.00754**. er. MGT. (4) INSTI. sit. Variable. i n U. v.
(37) Panel b. Return of Past Two Periods (1) INDIV. BLOCK BOARD BOARD2 OUTDTR. LVG Rtn (t-2) Constant Adjusted R2. ‧ 國. (33.47) -0.00910* (-1.82) 142.5*** (129.96). (35.13) -0.00803 (-1.60) 139.9*** (126.74). 0.333. 0.330. al. n. SIZE. -0.0362 (-1.18) 0.309** (8.02) 0.0160 (1.03) -0.117** (-9.96) -0.0095**. io. MGTPARTCEO. 9.011*** (46.91) 4.342*** (18.06) -0.360*** (-3.73) -5.119* (-69.69) 0.177**. Nat. PARTCEO. 8.974*** (47.02) 4.651*** (19.47) -0.344*** (-3.59) -5.236*** (-71.75) 0.168***. Ch. -8.974*** (-47.02) -4.651*** (-19.47) 0.344*** (3.59) 5.236*** (71.75) -0.168***. -1.840*** (-14.75) -0.118 (-0.76) 0.0736 (1.17) 4.977*** (104.37) -0.141***. (-11.73) -0.00107 (-1.32) 2.642*** (14.94). (-33.47) 0.00910* (1.82) -42.54*** (-38.78). (-43.02) 0.00181 (0.55) -70.21*** (-97.98). 0.012. 0.333. 0.264. engchi. t- statistics in parentheses * p<0.1, ** p<0.05, *** p<0.01. 34. ‧. PARTCHR. 政 治 大. 學. CEOCHR. (5) FOINSTI. 2.416** 2.426*** -0.00974 -2.416** 0.0397 (21.36) (21.31) (-0.53) (-21.36) (0.54) -0.0471*** -0.0457** -0.00138 0.0471** -0.0319*** (-6.65) (-6.41) (-1.21) (6.65) (-6.89) -0.421*** -0.426*** 0.00487*** 0.421*** 0.100*** (-60.19) (-60.50) (4.32) (60.19) (21.89) -1.205*** -1.213** 0.00863 1.205*** 0.643* (-14.10) (-14.11) (0.63) (14.10) (11.52) 0.0296* 0.0285** 0.00103* -0.0296*** -0.0336*** (7.84) (7.52) (1.69) (-7.84) (-13.67) 3.849*** 4.021*** -0.172*** -3.849*** 0.869*** (37.24) (38.65) (-10.29) (-37.24) (12.87) -0.0127* -0.0190*** 0.00630*** 0.0127** 0.00762* (-2.97) (-4.41) (9.15) (2.97) (2.73) -1.038*** -1.124* 0.0863** 1.038*** 1.459*** (-4.87) (-5.25) (2.52) (4.87) (10.49). 立. INV. (4) INSTI. y. MGT2. (3) FOINDIV. sit. MGT. (2) DOINDIV. er. Variable. i n U. v.
(38) The results of model (1-2) are showed in Table 9, Panel a is inputted the returns of past one period; Panel b is past two periods. The results show correspondences to several variables with yearly frequency data in Table 8, the domestic individual investors prefer firms with more outside independent directors, ultimate owners acting as management, blockholders holding a few shares, small board size, no CEO duality as well. However, there are some differences with yearly frequency data, management stockholdings is showed a non-linear relation with individual investors, but still positive related; investment in asset is negative related to domestic individual. 政 治 大 domestic individuals like to put their funds in firms with higher ratio of investment in 立. investors but positive related to foreign individuals and institutions, representing. asset, and foreign individuals and institutions opposite.. ‧ 國. 學. Outside independent directors is a variable have reverse effect on domestic and. ‧. foreign institutional investors, it’s negative related to domestic institutional investors’. sit. y. Nat. stockholdings but positive to foreign in either Panel a or Panel b, showing that foreign. n. al. er. io. investors think highly of major outside independent directors. By observing the. i n U. v. variables return (t-1) and return (t-2) in two panels, we find that only the return of past. Ch. engchi. two periods is significant at 10% level on entirely individual and institutional investors market but with reverse directional impacts, individuals is negative related to the past returns, however, institutions is positive related to the past returns. While examining whether the investors’ behaviors changed follow by the implement of governance mechanism, finally we use model (1-3) to test the 5 years data in monthly frequency to recheck our results before. In five years data, the variable of information transparency and disclosure ranking (ABC) is added into the model, because a series of corporate governance scandals happened after 2000, resulted in governance pay much attention to this area and proceeded establishing the 35.
(39) ranking. The model (1-3) is showed below:. (1-3) Where Yi,t : The investors’ stockholdings ; (1) INDIV: individuals Stockholdings,. 治 政 (2) DOINDIV: domestic Individuals Stockholdings, 大 立. (3) FOINDIV: foreign Individuals Stockholdings,. ‧ 國. 學. (4) INSTI: institutions Stockholdings,. ‧. (5) FOINSTI: foreign Institutions Stockholdings. n. al. er. io. sit. y. Nat. RTN (t-x)i,t : The Return of (t-x) period, where x=1, 2. Ch. engchi. 36. i n U. v.
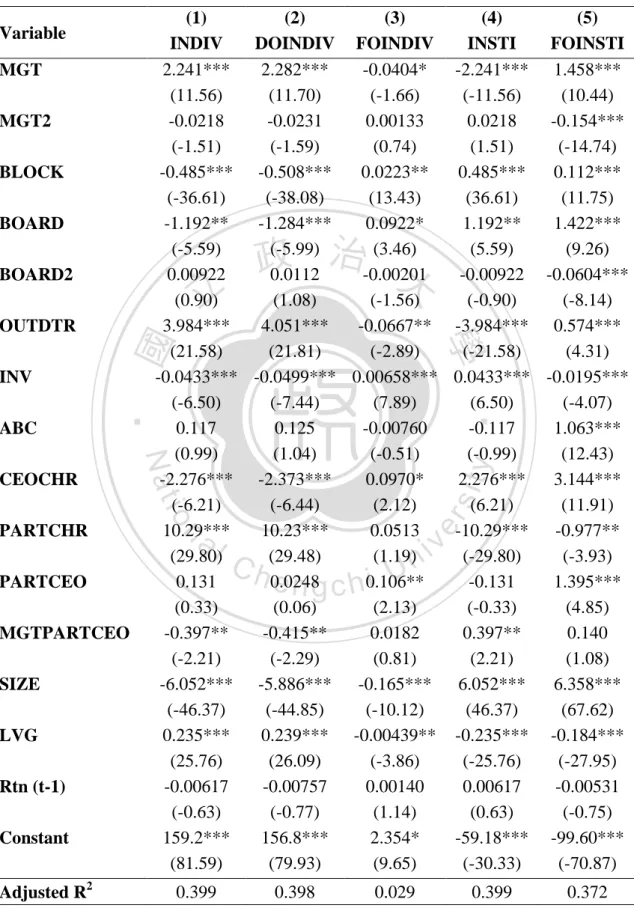
(40) Table 10. Regression Results for the Percentage of Investors Stockholdings – 5 years, monthly frequency Panel a. Return of Past One Period (1) (2) (3) (4) (5) Variable INDIV DOINDIV FOINDIV INSTI FOINSTI 2.241*** 2.282*** -0.0404* -2.241*** 1.458*** MGT (11.56) (11.70) (-1.66) (-11.56) (10.44) -0.0218 -0.0231 0.00133 0.0218 -0.154*** MGT2 (-1.51) (-1.59) (0.74) (1.51) (-14.74) -0.485*** -0.508*** 0.0223** 0.485*** 0.112*** BLOCK (-36.61) (-38.08) (13.43) (36.61) (11.75) -1.192** -1.284*** 0.0922* 1.192** 1.422*** BOARD (-5.59) (-5.99) (3.46) (5.59) (9.26) 0.00922 0.0112 -0.00201 -0.00922 -0.0604*** BOARD2 (0.90) (1.08) (-1.56) (-0.90) (-8.14) 3.984*** 4.051*** -0.0667** -3.984*** 0.574*** OUTDTR (21.58) (21.81) (-2.89) (-21.58) (4.31) -0.0433*** -0.0499*** 0.00658*** 0.0433*** -0.0195*** INV (-6.50) (-7.44) (7.89) (6.50) (-4.07) 0.117 0.125 -0.00760 -0.117 1.063*** ABC (0.99) (1.04) (-0.51) (-0.99) (12.43) -2.276*** -2.373*** 0.0970* 2.276*** 3.144*** CEOCHR (-6.21) (-6.44) (2.12) (6.21) (11.91) 10.29*** 10.23*** 0.0513 -10.29*** -0.977** PARTCHR (29.80) (29.48) (1.19) (-29.80) (-3.93) 0.131 0.0248 0.106** -0.131 1.395*** PARTCEO (0.33) (0.06) (2.13) (-0.33) (4.85) -0.397** -0.415** 0.0182 0.397** 0.140 MGTPARTCEO (-2.21) (-2.29) (0.81) (2.21) (1.08) -6.052*** -5.886*** -0.165*** 6.052*** 6.358*** SIZE (-46.37) (-44.85) (-10.12) (46.37) (67.62) 0.235*** 0.239*** -0.00439** -0.235*** -0.184*** LVG (25.76) (26.09) (-3.86) (-25.76) (-27.95) -0.00617 -0.00757 0.00140 0.00617 -0.00531 Rtn (t-1) (-0.63) (-0.77) (1.14) (0.63) (-0.75) 159.2*** 156.8*** 2.354* -59.18*** -99.60*** Constant (81.59) (79.93) (9.65) (-30.33) (-70.87). 立. 政 治 大. ‧. ‧ 國. 學. n. er. io. sit. y. Nat. al. Adjusted R2. 0.399. Ch. engchi. 0.398. t -statistics in parentheses * p<0.1, ** p<0.05, *** p<0.01 37. i n U. 0.029. v. 0.399. 0.372.
(41) Panel b. Return of Past Two Periods (1) (2) Variable INDIV DOINDIV. BOARD BOARD2. -0.0404*. -2.241***. 1.458***. (11.56). (11.70). (-1.66). (-11.56). (10.44). -0.0218. -0.0231. 0.00134. 0.0218. -0.154***. (-1.51). (-1.59). (0.74). (1.51). (-14.74). -0.485***. -0.508***. 0.0223***. 0.485***. 0.112***. (-36.62). (-38.08). (13.44). (36.62). (11.74). -1.191***. -1.284***. 0.0922***. 1.191***. 1.422***. (-5.59). (-5.99). (3.46). (5.59). (9.26). 0.00921. 0.0112. -0.00201. -0.00921. -0.0604***. (-0.89). (-8.14). -3.984***. 0.574***. (-21.58). (4.31). 3.984***. 立. ‧ 國. -0.0433*** -0.0499***. (7.89). 0.116. 0.123. -0.00737. (0.98). (1.03). (-0.50). -2.275**. -2.372**. 0.0970**. (-6.21). (-6.44). (2.12). 10.29***. 10.23***. 0.0516. (29.79). (29.48). (1.19). n. a 0.130l. (0.33) MGTPARTCEO SIZE LVG Rtn (t-2) Constant Adjusted R2. 0.00658***. (-7.45). io. PARTCEO. (-2.89). (-6.50). Nat. PARTCHR. (21.81). -0.397**. 0.0433*** -0.0196*** (6.50). (-4.07). -0.116. 1.062***. ‧. CEOCHR. (1.08) (-1.56) 治 政 4.051*** -0.0667*** 大. 學. ABC. FOINSTI. 2.282***. (21.58) INV. INSTI. 2.241***. (0.89) OUTDTR. FOINDIV. (-0.98). (12.42). 2.275***. 3.144***. y. BLOCK. (5). (6.21). (11.91). -10.29***. -0.978*. sit. MGT2. (4). er. MGT. (3). 0.0239 0.106** i v n C h (0.06) U (2.13) engchi. (-29.79). (-3.93). -0.130. 1.395***. (-0.33). (4.85). -0.415**. 0.0182. 0.397**. 0.140. (-2.20). (-2.29). (0.81). (2.20). (1.08). -6.051***. -5.886***. -0.165***. 6.051***. 6.358***. (-46.36). (-44.84). (-10.13). (46.36). (67.63). 0.235***. 0.239***. -0.00440**. -0.235***. -0.184***. (25.76). (26.09). (-3.86). (-25.76). (-27.95). -0.00414. -0.00531. 0.00117. 0.00414. -0.00445. (-0.43). (-0.54). (0.96). (0.43). (-0.64). 159.2***. 156.8***. 2.354***. -59.17***. -99.60***. (81.58). (79.92). (9.65). (-30.33). (-70.86). 0.399. 0.398. 0.029. 0.399. 0.372. t -statistics in parentheses * p<0.1, ** p<0.05, *** p<0.01 38.
(42) The results showed in Table 10 are similar with Table 9, several governance variables like management stockholdings, and blockholders’ stockholdings take opposite influence between individual and institutional investors. In addition, to judge whether the variable of information disclosure be took account of investment behaviors, we find that the grade of information disclosure only affect foreign institutional investors’ stockholdings, it shows a positive relation in Table 10. The variable MGTPARTCEO is negative related to individual investors’ shares holding, illustrating that inside dominance of CEO may reduce the effect of. 政 治 大 discover individual investors 立always prefer to invest in small firms, and larger firms. management stockholdings to dependent variables, and vice versa. Finally, we. ‧ 國. Trading Volumes and Trading Volatilities. Nat. sit. y. ‧. D.. 學. do institutional investors so far.. io. er. In this part, we examine Hypothesis 2 by measuring trading volume proxies with OLS Regression Model, separating data as yearly frequency of 15 years, monthly. al. n. v i n C hfrequency of 5 years frequency of 15 years, and monthly to discuss how the impact on engchi U. trading volume or volatility caused by governance variables, then comparing the difference between 15 and 5 years’ data. We refer trading volume to trading value (in million) and turnover rate in individual stocks, besides, trading returns (in percentage) is fitted into the analysis as well. We aim at discussing whether the trading volatilities varied follows by degrees of corporate governance in yearly frequency data of 15 years, therefore we build the model (2-1) to examine, which is showed below:. 39.
(43) (2-1) Where Yi,t: Trading volumes and trading volatilities ; (1) LnValue: Ln of Trading Value,. 政 治 大 (3) Ratio:立 Turnover Ratio,. (2) LnSDValue: Ln of Standard Deviation of Trading Value,. ‧ 國. 學. (4) SDRatio: Standard Deviation of Turnover Ratio,. ‧. (5) Rtn: Returns,. n. al. y. er. io. sit. Nat. (6) SDRtn: Standard Deviation of Returns. Ch. engchi. 40. i n U. v.
(44) Table 11. Regression Results for the Trading Volume and Trading Stability – 15 years, yearly frequency Variable MGT. (1). (2). (3). (4). (5). (6). LnValue. LnSDValue. Ratio. SDRatio. Rtn. SDRtn. 0.120***. 0.0958***. 16.90***. -0.196*. 1.651. -0.420***. (4.84). (3.94). (4.60). (-1.77). (1.34). (-3.83). 0.00712. -0.0643. 0.0213**. (0.80). (-0.65). (2.42). -0.00734*** -0.00582*** -1.218***. MGT2. (-3.69). (-2.99). -0.0299***. -0.0289***. (-15.72). (-15.47). (-15.19). (-3.89). (3.71). (-1.37). BOARD. -0.0415*. -0.0448**. -5.923*. -0.602***. -0.789. -0.585***. (-0.69). (-5.72). BOARD2. (-1.73) (-5.82) 治 政 -0.000934 -0.000482 -0.118 大 0.0253*** (-0.92) 立 (-0.48) (-0.78) (5.55). 0.00321. 0.0260***. (0.06). (5.77). BLOCK. 0.0633**. 0.0270. -5.856. -0.145. 1.128. -0.371***. (2.26). (0.98). (-1.41). (-1.15). (0.81). (-3.00). -0.000848. -0.00171. -0.200. -0.0113**. 0.0583. -0.0197***. (-0.74). (-1.52). (-1.18). (-2.19). (1.02). (-3.89). 0.109*. 0.0985*. 7.419. -0.528**. y. 1.182. 0.109. (1.89). (1.74). (0.87). (-2.05). sit. (0.41). (0.43). 0.0934. 10.67. -0.438*. er. Nat. CEOCHR. io. 0.124** (2.10). PARTCEO. MGTPARTCEO. SIZE. LVG. Constant. Adjusted R. 2. al. n. PARTCHR. -0.0115. ‧. INV. 學. OUTDTR. -4.280*** -0.0331*** 0.351***. (-1.98). ‧ 國. (-1.80). (-4.14). -0.165***. (1.22) C(1.62) h e n g c-11.99 hi U -0.128**. iv n(-1.66). -0.182. -1.236***. (-0.06). (-4.75). -0.423*. -0.539. -0.875***. (-2.93). (-2.31). (-1.44). (-1.68). (-0.19). (-3.52). -0.0137. -0.0195. -6.181. -0.0923. -0.302. -0.0772. (-0.52). (-0.76). (-1.59). (-0.79). (-0.23). (-0.67). 1.129***. 0.967***. 1.733. -0.281***. 2.274**. -0.570***. (57.03). (49.69). (0.59). (-3.16). (2.31). (-6.51). -0.0177***. -0.0139***. 0.310. 0.0254***. -0.0903. 0.0630***. (-13.41). (-10.68). (1.59). (4.30). (-1.38). (10.79). -7.669***. -7.890***. 299.2***. 11.03***. -23.01. 17.09***. (-25.96). (-27.19). (6.84). (8.34). (-1.57). (13.08). 0.533. 0.464. 0.075. 0.027. 0.005. 0.072. t - statistics in parentheses * p<0.1, ** p<0.05, *** p<0.01 41.
(45) The results of model (2-3) shown in Table 11 included six dependent variables, we discuss the effect of corporate governance factors to trading volume related variables first. After checking the ownership structured factors, we find that management stockholdings, blockholders’ stockholding, and board size are significantly affecting trading value and turnover ratio, where larger management stockholdings (although in a non-linear relation) would lead to larger trading value and turnover ratio, but larger blockholders’ stockholdings and board size would make them down; in general, we always deem the trading turnover ratio as a proxy of trading liquidity, so we can see. 政 治 大 liquidity of trading. It display the trading value is changed by outside independent 立 from Table 11 that management stockholdings is maybe an only factor to promote the. directors, inside dominance of chairman and CEO, firm size, and leverage ratio in. ‧ 國. 學. Table 11, however, only more outside directors, one of the ultimate controllers serves. ‧. as chairman of the board, and larger firm size can raise the trading value.. sit. y. Nat. We choose the standard deviation of trading value and turnover ratio as the proxies. n. al. er. io. of trading stability, the standard deviation is computed by the monthly data of trading. i n U. v. value and turnover ratio, and we anticipate that better corporate governance. Ch. engchi. mechanism will lead the trading activities tending to be more stable, that is to say the coefficients of them are expected to be negative. Both the increases of management stockholdings and CEO duality lead the turnover ratio more stable, yet fluctuate the trading value. Nevertheless, there are three factors show completely help with stabilities of trading value and turnover rate – blockholders’ stockholdings, board sizes, and the inside dominance of CEO, which are indicating more part of shares kept by blockholders, larger board size, or one of the ultimate controllers acting as CEO would be ways to lower the trading volatilities. Next, we examine the changes of trading volume resulted by degrees of corporate 42.
(46) governance in monthly frequency data of 15 years, the model (2-2) built to examine the effect is showed below:. (2-2) Where Yi,t : Factors of trading volume;. 政 治 大 (1) LnValue: Ln of Trading Value, 立. ‧ 國. 學. (2) Ratio: Turnover Ratio, (3) Rtn: Returns. ‧ sit. y. Nat. n. al. er. io. Table 12 shows the impacts on trading values, turnover ratios, and trading returns. i n U. v. with model (2-2), by illustrated in table, we notice almost all the governance variables. Ch. engchi. are significant to the trading volume proxies except the duality of CEO, meaning that corporate governance variable do affect the trading volume of firms, in addition, the past returns either one period or two periods are positive related to trading value and turnover ratio, exhibiting past returns would make trading activities vigorous. We make a rough estimate of whether the governance factors generate impacts on stock returns also, however we find only blockholders’ stockholding is positive related to the returns, meaning that if block shareholders expand their stockholdings then the stock returns would increase.. 43.
(47) Table 12. Regression Results for the Trading Volume and Trading Stability – 15 years, monthly frequency (1) LnValue. Variable. (3) Rtn. 0.0375*** 0.0371*** 0.817*** 0.812*** -0.0185 -0.0337 (3.74) (3.63) (5.38) (5.22) (-0.18) (-0.33) -0.00566*** -0.00569*** -0.107*** -0.108*** -0.000800 -0.000953 (-9.01) (-8.89) (-11.28) (-11.05) (-0.13) (-0.15) -0.0282*** -0.0281*** -0.382*** -0.379*** 0.0174*** 0.0186*** (-45.34) (-44.47) (-40.68) (-39.39) (2.76) (2.95) -0.0435*** -0.0437*** -0.419*** -0.426*** -0.00107 -0.00793 (-5.73) (-5.66) (-3.66) (-3.62) (-0.01) (-0.10) -0.000791** -0.000792** -0.0162*** -0.0162*** -0.00115 -0.000916 (-2.36) (-2.33) (-3.21) (-3.12) (-0.34) (-0.27) 0.0622*** 0.0611*** -0.232* -0.242* 0.0000726 0.00227 (6.79) (6.56) (-1.68) (-1.71) (0.00) (0.02) -0.00185*** -0.00182*** -0.0394*** -0.0393*** 0.00142 0.00162 (-4.88) (-4.72) (-6.88) (-6.69) (0.37) (0.42) 0.0765*** 0.0770*** 0.290 0.313 0.144 0.100. BOARD BOARD2. 立. 學. INV CEOCHR. io. PARTCEO. Nat. PARTCHR. (4.05) -0.163*** (-9.64) 0.114*** (5.39) 0.0667*** (7.83) 1.229*** (189.86). SIZE LVG Rtn (t-1) (%). -0.0283*** (-63.38) 0.0244*** (54.92). 2. (1.02) -1.292*** (-5.05) 0.732** (2.28) 0.826*** (6.41) 0.504*** (5.16). -0.0283*** (-62.38). -0.0293*** -0.0302*** -0.00417 (-4.34) (-4.37) (-0.92) 0.405*** 0.0466*** (60.37) (10.33) 0.227*** (32.96) 22.69*** 22.96*** 0.467. Ch. engchi. (1.07) -1.279*** (-4.87) 0.720** (2.19) 0.849*** (6.42) 0.500*** (4.98). i n U. v. (0.75) -0.0251 (-0.15) -0.0571 (-0.27) 0.101 (1.17) 0.0261 (0.40). (0.52) -0.0260 (-0.15) -0.0894 (-0.41) 0.123 (1.42) 0.0222 (0.34) -0.00444 (-0.98). -11.50***. 0.0165*** (36.52) -11.49***. (-118.28). (-116.22). (15.44). (15.23). (0.47). (0.63). 0.523. 0.507. 0.112. 0.067. 0.002. 0.001. Rtn (t-2) (%) Constant. (4.02) -0.163*** (-9.45) 0.113*** (5.25) 0.0678*** (7.81) 1.229*** (186.69). al. n. MGTPARTCEO. ‧. ‧ 國. OUTDTR. 政 治 大. y. BLOCK. sit. MGT2. er. MGT. Adjusted R. (2) Ratio. t- statistics in parentheses * p<0.1, ** p<0.05, *** p<0.01 44. 0.0109** (2.42) 0.623.
(48) In order to compare with results of model (2-2), we examine the changes of trading volume resulted by degrees of corporate governance in monthly frequency data of 5 years and build the model (2-3) by adding the factor of information disclosure, the model (2-3) is presented below and results are showed in Table 13:. Where Yi,t. (2-3). 治 政 大 : Factors of trading volume 立. ‧ 國. 學. (1) LnValue: Ln of Trading Value (2) Ratio: Turnover Ratio. ‧. (3) Rtn: Returns. n. er. io. sit. y. Nat. al. Ch. engchi. 45. i n U. v.
(49) Table 13. Regression Results for the Trading Volume and Trading Stability – 5 years, monthly frequency (1) (2) (3) Variable LnValue Ratio Rtn -0.0208 -0.0207 0.299 0.300 0.0143 0.0145 MGT (-1.43) (-1.38) (1.61) (1.55) (0.09) (0.09) -0.00215** -0.00200* -0.0442*** -0.0415*** 0.0111 0.0110 MGT2 (-1.98) (-1.79) (-3.19) (-2.86) (0.95) (0.95) -0.0188*** -0.0186*** -0.253*** -0.248*** 0.0166 0.0168 BLOCK (-18.91) (-18.08) (-19.93) (-18.69) (1.56) (1.57) 0.00129 0.000358 -0.598*** -0.618*** -0.0651 -0.0632 BOARD (0.08) (0.02) (-2.93) (-2.89) (-0.38) (-0.37) -0.00334*** -0.00326*** -0.0104 -0.00893 0.00503 0.00493 BOARD2 (-4.31) (-4.09) (-1.06) (-0.87) (0.61) (0.60) 0.0537*** 0.0533*** 0.134 0.125 0.0201 0.0208 OUTDTR (3.87) (3.73) (0.76) (0.68) (0.14) (0.14) 0.000420 0.000503 -0.000104 0.00119 0.00355 0.00363 INV (0.84) (0.97) (-0.02) (0.18) (0.66) (0.68) 0.0864*** 0.0902*** 0.767*** 0.811*** 0.113 0.123 ABC (9.68) (9.81) (6.75) (6.82) (1.18) (1.29) 0.161*** 0.159*** 1.406*** 1.383*** -0.0411 -0.0423 CEOCHR (5.83) (5.61) (4.01) (3.77) (-0.14) (-0.14) -0.125*** -0.120*** -0.197 -0.123 0.111 0.117 PARTCHR (-4.80) (-4.48) (-0.60) (-0.36) (0.40) (0.42) -0.125*** -0.121*** -1.221*** -1.152*** 0.266 0.266 PARTCEO (-4.17) (-3.92) (-3.20) (-2.88) (0.83) (0.83) 0.0582*** 0.248 0.229 -0.0918 -0.0918 MGTPARTCEO 0.0592*** (4.38) (4.17) (1.44) (1.27) (-0.64) (-0.64) 1.049*** 1.046*** -0.726*** -0.785*** -0.210** -0.209** SIZE (106.96) (103.50) (-5.81) (-6.00) (-2.00) (-2.00) -0.0142*** -0.0142*** 0.0724*** 0.0727*** -0.00158 -0.00176 LVG (-20.67) (-20.06) (8.30) (7.97) (-0.22) (-0.24) 0.0301*** 0.426*** 0.0456*** Rtn (t-1) (40.66) (45.20) (5.76) 0.0195*** 0.225*** 0.0534*** Rtn (t-2) (25.85) (23.04) (6.84) -9.764*** -9.732*** 31.76*** 32.52*** 3.439** 3.348** Constant (-66.58) (-64.40) (17.00) (16.63) (2.19) (2.14). 立. 政 治 大. ‧. ‧ 國. 學. n. er. io. sit. y. Nat. al. Adjusted R2. 0.593. Ch. engchi. 0.568. 0.158. t- statistics in parentheses * p<0.1, ** p<0.05, *** p<0.01 46. i n U. v. 0.078. 0.002. 0.003.
數據
+7
相關文件
Reading Task 6: Genre Structure and Language Features. • Now let’s look at how language features (e.g. sentence patterns) are connected to the structure
Register, tone and style are entirely appropriate to the genre and text- type. Text
Using this formalism we derive an exact differential equation for the partition function of two-dimensional gravity as a function of the string coupling constant that governs the
This kind of algorithm has also been a powerful tool for solving many other optimization problems, including symmetric cone complementarity problems [15, 16, 20–22], symmetric
(2007) demonstrated that the minimum β-aberration design tends to be Q B -optimal if there is more weight on linear effects and the prior information leads to a model of small size;
Key words: theory of the nature of the mind, the Buddha nature, one who possesses a gotra, non-resultant activity which is neither positive nor negative and is able
The study explore the relation between ownership structure, board characteristics and financial distress by Logistic regression analysis.. Overall, this paper
That is to say, while the building with the Chinese character ‘工’ shaped architectural plan is the common building type in the northern part of Vietnam, building layout in
