國 立 交 通 大 學
電機與控制工程學系
博 士 論 文
腦神經人機界面及應用
Neural Human Machine Interface and Its
Applications
研 究 生: 柯 立 偉
指導教授: 林 進 燈 教授
腦神經人機界面及應用
Neural Human Machine Interface and Its
Applications
研 究 生:柯立偉 Student:Li-Wei Ko
指導教授:林進燈 博士
Advisor:Dr. Chin-Teng Lin
國立交通大學
電機與控制工程學系
博士論文
A Dissertation
Submitted to Department of Electrical and Control Engineering
College of Electrical Engineering
National Chiao Tung University
in partial Fulfillment of the Requirements
for the Degree of
Doctor of Philosophy
in
Electrical and Control Engineering
September 2007
Hsinchu, Taiwan, Republic of China
腦神經人機界面及應用
研究生:柯立偉 指導教授:林進燈 博士
國立交通大學 電機與控制工程學系 博士班
摘 要
近年來在醫學診斷和神經生物學研究中,腦電波訊號(Electroencephalogram, EEG)已成為非常有用的非侵入式生理訊號工具,主要因為它能在千分之一秒 (milliseconds)的時間裡提供極高的生理訊號解析度,直接反映出細胞群體中動態 的變化。在所有量測大腦造影的醫療工具中,量測腦電波訊號最不受任何限制, 因為在量測過程中,受試者不需受到固定身體和保持頭不動等限制。然而,若將 現今市面上的腦波監測系統應用到日常生活中卻會深深受到許多限制,例如:需 在頭皮上塗抹導電膠才能量測腦電波訊號,系統缺乏高精確度的量測,即時訊號 處理和有效去除雜訊等功能,皆是主要腦波監測系統的缺失。因此,為了解決這 些缺失,本論文主要目的在開發,設計和測試一可直接應用於日常生活環境裡的 腦神經人機界面,可讓使用者在日常生活的自然情況下方便使用生理訊號監測系 統,即使是在多變的環境中做不同的工作任務,亦能直接擷取大腦活動變化。更 重要的是,本論文為了探討此創新的移動式無線腦神經人機界面的應用,我們亦 建構一環繞式虛擬實境動態駕駛環境,此環境可真實的模擬日常生活的駕駛情 境,無論是應用於神經科學基礎研究上或是應用於日常生活中的警示提醒,皆能 有效地測試此腦神經人機界面的效能。在本論文中,我們提出三個與日常生活相 關的應用研究,但絕不僅侷限於這些而已,這三個研究分別為:(1) 在虛擬實境 動態駕駛環境裡探討受試者駕車時的認知狀態的變化;(2) 探討利用聲音回饋來維持駕駛員的精神狀態和注意力是否集中的腦神經變化;(3) 在虛擬實境動態駕 駛環境裡探討動態刺激對身體感覺和知覺的腦神經變化。對目前許多探討複雜腦 功能的研究來說,本論文探討的應用能在生活環境裡受限最小並提出許多重要新 穎的發現,這些研究成果亦可有效提升正常人每天在反覆工作任務環境下的工作 能力表現,也可應用於腦傷、生病或身體不健全等病人更細部的動態認知狀態研 究。否則這些成果至今僅能請受試者來傳統腦波實驗室參與實驗,並要求受試者 固定身體,頭不能亂動,眼睛不能亂瞄等限制受試者行為。一旦有了創新的可攜 式無線腦神經人機界面,這些限制將能一一破除,我們相信這能為認知神經科學 和人機界面互動等研究開啟另一新的頁章。
Neural Human Machine Interface and Its
Applications
Student: Li-Wei Ko Advisor: Dr. Chin-Teng Lin
Department of Electrical and Control Engineering
National Chiao Tung University
Abstract
Electroencephalogram is a powerful non-invasive tool widely used by for both medical diagnosis and neurobiological research because it provides high temporal resolution in milliseconds which directly reflects the dynamics of the generating cell assemblies, and it is the only brain imaging modality that does not require the head/body to be fixed. However, the lack of availability of EEG monitoring system capable of high-definition recording, online signal processing and artifact cancellation, without use of conductive gels applied to the scalp, has long thwarted the applications of EEG monitoring in the workplace. This dissertation describes a design, development and testing of a neural human machine interface that allows assessment of brain activities of participants actively performing ordinary tasks in natural body positions and situations within a real operational environment. More importantly, this dissertation also discuss the implications of this innovative mobile wireless brain imaging technology in neuroscience and neuro-technology, through three sample studies: (1) cognitive-state monitoring of participants performing realistic driving tasks in the virtual-reality-based dynamic driving simulator; (2) the efficacy and neural correlates of auditory feedback delivered to participants to maintain
participants attention and alertness; (3) the neural correlates of kinesthetic sensation and perception in the dynamic driving simulator. Results of these studies provide many new insights into the understanding of complex brain functions of participants performing ordinary/routine tasks in a minimum constrained environment. These results also allow a better appreciation of the limitations of normal human performance in repetitive task environments, and may allow more detailed study of changes in cognitive dynamics in brain-damaged, diseased, or genetically abnormal individuals. Furthermore, these findings might be difficult, if ever possible, to obtain in a standard EEG laboratory where participants are asked to limit their eye blinks, teeth clinching, head/ body movements. We, thus, believe this work opens a new chapter in neuro-cognitive human-machine interface/interaction.
誌 謝
此博士論文的完成,首先感謝指導教授 林進燈老師在我博士班二年級時鼓勵我轉往生醫 工程領域發展,他認為生醫工程是下一世代的新興領域,未來將有無限發展空間,因此我選 擇加入腦科學研究中心團隊。在過去兩年多研究期間,林進燈老師辛勤地對外為腦科學研究 中心爭取許多豐富的研究資源和實驗環境,並利用閒暇時間從旁指導研究,加入腦中心的同 時也因此認識許多國際,國內知名研究團隊,例如:UCSC 的劉文泰教授,NASA JPL 的方偉 騏教授、UCSD 的鍾子平教授和段正仁博士,MPIB 的李淑珍博士等。 在此要特別感謝 UCSD 鍾子平教授,在我撰寫博士論文期間提供許多建議和校閱博士論 文,並在口試前幾日不眠不休地指導我如何完整有條理的簡報,使我在眾多大師級的口試委 員面前表現受肯定,將腦中心的研究向外宣傳發揚。亦感謝段正仁博士從旁給予研究上的協 助,從實驗設計、實驗分析、實驗結果討論到如果撰寫論文,皆具專業的意見與想法。 在參與腦科學研究的兩年多期間,感謝梁勝富老師對我的研究教學和經驗傳承,使得我 在面對許多事情時能更加得心應手,亦感謝蕭富仁老師從神經科學角度來指正研究,有了他 們的指導,無論是研究上的疑難解答、研究方法、寫作方式、經驗分享等惠我良多,亦非常 感謝腦科學研究中心所有全體成員,沒有大家的協助配合,許多事情就無法順利完成。 最後,我要感謝我的妻子培真在我求學期間對我的照顧和忍讓,替我分擔許多研究上的 壓力與挫折,經常早出晚歸的我,常忽略了她孤獨的感受;在此亦感謝我的父母過去對我的 栽培和鼓勵,教導我做人品德為最,強調人格健全之發展與學習生活之態度,由於他們辛勞 的付出和細心的照顧,才有今天的我。謹以本文獻給我親愛的家人與親友們,以及關心我的 師長,願你們共享這份榮耀與喜悅。 柯立偉 敬上 2007/10/11Contents
摘要...i
Abstract... iii
誌謝...v
Contents ...vi
List of Tables ... viii
List of Figures...ix
1. Introduction...1
1.1 Motivation...1
1.2 Statement of the Problem ...2
1.3 Notation...4
2. Materials and Methods...6
2.1 Virtual-reality-based Dynamic Driving Environment...6
2.2 Electroencephalogram Signal Acquisition System...9
2.3 Independent Component Analysis... 11
2.4 Event-Related Potential...12
2.5 Event-Related Spectral Perturbation...13
3. EEG Activation of Kinesthetic Perception ...15
3.1 Introduction...15
3.2 Experimental Setup ...19
3.3 Experimental Results...24
3.4 Discussion...32
4. EEG Activation under Different Cognitive States...36
4.1 Introduction...36
4.2 Experimental Setup ...37
4.3 Experimental Results...44
4.4 Discussion...51
5. Portable Brain Computer Interface in Detecting Drowsiness ...52
5.1 Introduction...52
5.2 System Architecture ...54
5.4 Experimental Results and Discussion ...66 6. Conclusions...73 References...78
List of Tables
Table 3-1: The response time (RT) of motion and motionless deviation events...
...25
Table 4-1: Correlation spectra between smoothed driving errors and ICA power spectra of first 2 ICA components of each subject...47
Table 4-2: Performance of testing patterns for electrode-skin-electrode impedance (ESEI) measurement ...50
Table 5-1: The Comparison of the Bluetooth and RF 3100/3105 ...58
Table 5-2: The Comparison of the Performance ...68
Table 5-3. The comparisons of the Estimation Performance...70
List of Figures
Figure 2-1: (a) Kinesthetic virtual reality (VR) driving environment, (b) The driving cabin simulator mounted on a 6-DOF dynamic Stewart motion platform ...7 Figure 2-2: Flowchart of the VR-based highway scene developed environment
...…7 Figure 2-3: The width of highway is equally divided into 256 units and the width of the car is 32 units ...8 Figure 2-4: The 32 channel EEG electrode cap ontents ...10 Figure 2-5: The International 10-20 system of electrode placement ist of Tables ...10 Figure 2-6: The scalp topographies and the corresponding log bandpower
spectra of all ICA components.st of Figures...12 Figure 2-7: Event-related spectral perturbation plot.ntroduction...14 Figure 3-1: Illustration of the design for Stop-Go events in diving ...20 Figure 3-2: The vehicle was randomly drifted away from the cruising position,
which was defined as a deviation event, and the subjects were instructed to steer the vehicle back to the center of the cruising la as quickly as possible...21 Figure 3-3: The ICA components from 11 subjects are clustered into 9 groups ...
...24 Figure 3-4: A right mu component shows mu characteristic 10 Hz and 22 Hz
peaks in the activity spectrum (lower left)...26 Figure 3-5: The mean ERSP of the mu component following deviation events ...
...27 Figure 3-6: Single-trial Event-Related Potentials (ERPs) of the central midline
(CM) component following deviation events under 4 different conditions ...28 Figure 3-7: Mean (N=29) component map and mean power spectra of a left-mu
component cluster. Individual component maps resembled the averaged scalp map...29 Figure 3-8: The group-averaged ERSP shows the component activations
following Stop-Go events under the motion (left panels) and motionless (right panels) conditions ...30 Figure 3-9: The group-averaged ERSP images following deviation events under motion and motionless conditions...31
Figure 3-10: The differences between mu blocking in motion and motionless conditions, which were obtained by subtracting motionless ERSP (right panels of Figure 3-9) from the motion ERSP (left panels of Figure 3-9) ...32 Figure 4-1: Flowchart of the drowsiness detection system...38 Figure 4-2: A VR-based dynamic driving environment for interactive driving
experiments...39 Figure 4-3: Flowchart for processing the EEG signals ...40 Figure 4-4: Forehead positions of conventional wet electrodes (circle) and MEMS
EEG sensors (square)...42 Figure 4-5: An example of the deviation event...43 Figure 4-6: An example of the driving performance that represented by the
digitized vehicle deviation trajectories...43 Figure 4-7: Raw EEG Data Recording by MEMS sensors and Standard Wet
Sensors ...44 Figure 4-8: The EEG power spectra of 5 MEMS / Wet sensor pairs ...45 Figure 4-9: Correlation of driving performance and EEG power spectra from the
different two subjects...46 Figure 4-10: Estimated and actual driving error of Session #2 of Subject 1 using
the EEG signals ...48 Figure 4-11: Estimated and actual driving error of Session #1 Subject 1 using the EEG signals...48 Figure 4-12: Estimated and actual driving error of Session #2 of Subject 2 using the EEG signals ...49 Figure 4-13: Estimated and actual driving error of Session #1 of Subject 2 using the EEG signals ...49 Figure 5-1: The block diagram of the proposed Brain Computer Interface ...55 Figure 5-2: The detail architecture of the Brain Computer Interface...57 Figure 5-3: Software structure of the embedded system and the data processing flow ...60 Figure 5-4: Time series diagram of multi-task scheduling mechanism ...61 Figure 5-5: Flowchart of the proposed EEG signal analysis procedure ...65 Figure 5-6: Testing results of the acquisition/amplifying unit and the developed
GUI monitoring interface...67 Figure 5-7: The training and testing results of the drowsiness level estimation
1. Introduction
1.1 Motivation
Drivers’ fatigue has been implicated as a causal factor in many accidents. Preventing accidents caused by drowsiness has become a major focus of active safety driving in recent years. During the past years, driving safely has received increasing attention of the publics due to the growing number of traffic accidents because of the marked decline in the drivers’ abilities of perception, recognition and vehicle control abilities while sleepy. Therefore, it requires an optimal human estimation system to online continuously detect drivers’ cognitive state related to abilities in perception, recognition, and vehicle control. The difficulties in developing such a system are lack of significant index for detecting drowsiness and complicated noise interferences in a realistic and dynamic driving environment. Development of the drowsiness monitoring technology for preventing accidents behind the steering wheel has become a major interest in the field of safety driving. Thus, developing accurate and non-invasive real-time driver drowsiness monitoring system would be highly desirable, particularly if this system can be further integrated into an automatic warning system.
It is known that abundant information on physiological changes such as eye activity measures, heart rate variability (HRV), or particularly, the electroencephalogram (EEG) activities can relate with drowsiness (Vuckovic et al., 2002; Roberts et al., 2000). Previous studies (Stern et al., 1994; McGregor and Stern, 1996) showed that the eye blink duration and the blink rate typically increases while blink amplitude decreases as function of the cumulative time, and the saccade frequencies and velocities of electrooculogram (EOG) decline when people get drowsy. Although approaches based on EOG signals showed that eye-activity
variations were highly correlated with the human fatigue and can accurately and quantitatively estimate alertness levels, the step size (temporal resolution) of those eye-activity based methods is relatively long (about 10 seconds) to track slow changes in vigilance (Orden et al., 2000). Contrarily, the step size of the EEG-based methods can be reduced to about 2 seconds to track second-to-second fluctuations in the subject’s performance (Orden et al., 2001; Jung et al., 1997; Makeig and Jung, 1996). Since the computer power becomes faster and faster, it is practicable and appealing to know what information about human cognitive state and behavior are available through analyzing complex EEG signals. Hence, we constructed a virtual-reality (VR) based highway-driving environment to study drivers’ cognitive changes during a long-term driving. A lane-keeping driving experiment was designed to indirectly quantify the driver’s drowsiness level and a drowsiness estimation system combining the EEG power spectrum analysis, the principle component analysis (PCA) and the linear regression model was developed. Independent Component Analysis (ICA) was used in the similar experiments (Comon, 1994; Girolami, 1998; Lee et al., 1999) to locate the optimal electrode placements for each individual. A total of 10 frequency bands in 2 ICA components are selected and fed to the linear regression models to estimate driver’s performance.
1.2 Statement of the Problem
Biomedical signal monitoring systems have been rapidly advanced with electronic and information technologies in recent years. Electroencephalogram (EEG) recordings are usually obtained by placing electrodes on the scalp with a conductive gel or paste, each of which is attached to a wire that is then connected to an external signal acquisition device. The tethering caused by this method of recording prohibits experiments in real operational environments. Furthermore, most of the existing
physiological signal monitoring systems can only record the signals without the capability of automatic analysis. In this study, we develop a portable and real-time Brain Computer Interface (BCI) that can acquire and analyze EEG signals in real-time to monitor human physiological as well as cognitive states and, in turn, provide warning signals to the users when needed. In order to widely application in the realistic environment, we should consider the effects of kinesthetic perception on the BCI system. Therefore, we first constructed the unique virtual reality-based dynamic driving environment to investigate EEG activation on kinesthetic perception and under different cognitive states. Then, the neural human machine interface/interaction in realistic environment will be well-established by combining the findings of EEG activation with the portable and real-time BCI system.
Kinesthetic perception is one of the most important sensations to human beings. The vestibular system thus plays an important role in our lives. We usually overlook the contributions of the vestibular system to our lives, simply because it doesn’t give us the sense of this vivid and harmonic world the way our eyes and ears do. However, we would not have a complete sensation without the perception of motion. Vestibular system is one of the most important sensory apparatus for detecting the perception of motion. One of the most experienced kinesthetic perceptions in our life is the motion associated with driving. Almost all of the existing EEG correlated research studies of perceiving kinesthetic stimuli focus on the brain dynamics of the subjects receiving visual and/or auditory stimulus, very few one focus on the subject perception of kinesthetic stimulus such as car drivers, airplane pilots, etc.
After the investigation of kinesthetic perception, we would use the portable real-time BCI system as the base platform and increase some actual functions such as low-power consumption for portability and high computational capability to process EEG signal. The portable and real-time BCI system consists of a 4-channel bio-signal
acquisition/amplification module, a wireless transmission module, a dual-core signal processing unit and a host system for display and storage. The embedded dual-core processing system with multi-task scheduling capability was proposed to acquire and process the input EEG signals in real-time. In addition, the wireless transmission module, which eliminates the inconvenience of wiring, can be switched between radio frequency (RF) and Bluetooth according to the transmission distance. Finally, the real-time EEG-based drowsiness monitoring and warning algorithms were implemented and integrated into the system to close the loop of the BCI system. The practical online testing demonstrates the feasibility of using the proposed system with the ability of real-time processing, automatic analysis and on-line warning feedback in real-world operation and living environments.
Based on the neural human machine interface/interaction in the future work, we will perform more realistic experiments on the unique VR-based dynamic driving environment which can simulate vehicle driving and 3D surrounded scenes to investigate the EEG correlated activities of the driver (such as, distraction, carsickness (motion sickness), etc.). It will widen the fundamental biomedical and brain science research and spawns new industry opportunities to provide the solutions of real-life problems.
1.3
Organization of Dissertation
This dissertation is organized as follows. Chapter 2 describes the virtual reality-based dynamic driving environment, electroencephalogram (EEG) signal acquisition system, Independent Component Analysis (ICA), event-related potential (ERP), and event-related spectral perturbation (ERSP). Chapter 3 explores EEG activation of kinesthetic perception under our unique virtual-reality-based dynamic driving environment. Chapter 4 investigates EEG activation under different cognitive
states and develops drowsiness estimation technology by using Micro Electro Mechanical Systems sensor (MEMS sensor). Based on the drowsiness estimation technology, Chapter 5 develops the portable brain computer interface to real-time detect drivers’ drowsiness. At last, we make some conclusions in Chapter 6.
2. Materials and Methods
2.1 Virtual-Reality-based Dynamic Driving Environment
In this study, we developed a VR-based 3D high-fidelity interactive highway scene, which was composed of seven identical PCs, synchronized by LAN, running the same VR program. The synchronized scenes were projected from seven projectors to constitute a surrounding vision (as shown in Figure 2-1. (a)). At the center of the projected scenes, we mounted a real vehicle (without the unnecessary weight of an engine and other components) on the motion platform to provide motion sensations as would be experienced in real driving (as shown in Figure 2-1. (b)). The vestibular cues, or motion cues, were delivered by a motion platform controlled by six hydraulic linear actuators. This hexapod configuration is also known as a Stewart Platform (Stewart, 1965). During driving in the real world, either deceleration or acceleration would occur even on smooth road. The platform generated accelerations in vertical, lateral, and longitudinal directions of a vehicle as well as pitch, roll, and yaw angular accelerations. To simulate a deceleration in driving motion, for instance, the driver would feel a force pushing him/her against the seat belt, and the platform would simultaneously tilt forward to change the gravity direction to simulate the deceleration force. Similarly, the platform would tilt backward to simulate an acceleration force. This (or comparable) technique has been used widely in driving simulation studies (Reymond and Kemeny, 2000).
In the VR-based dynamic environment and its emulation software, WorldToolKit (WTK) library and application programmer’s interface (API) (Cardoso and Souloumiac, 1993) were reported in our previous study (Lin et al., 2005 & 2006). The detailed development diagram of the VR-based scene is shown in Figure 2-2.
(a) (b)
Figure 2-1: (a) Kinesthetic virtual reality (VR) driving environment, (b) The driving cabin simulator mounted on a 6-DOF dynamic Stewart motion platform
Visual C++
WTK library
Dynamic
Model
Create 3D ModelVR Scene
Create Parameter ModelFigure 2-2: Flowchart of the VR-based highway scene developed environment. The dynamic models and shapes of the 3D objects in the VR scene are created and linked to the WTK library to form a complete interactive VR simulated scene
Firstly, we create models of various objects (such as cars, roads, trees and so on.) for the scene and set up the corresponding positions, attitudes, and other relative parameters. Then, we develop dynamic models among these virtual objects and build a complete simulated highway scene of full functionality with the aid of the high-level C-based API program. The VR-based four-lane highway scene is projected on a 120-surround screen (304.1-cm wide and 228.1-cm high), which is 350 cm away from
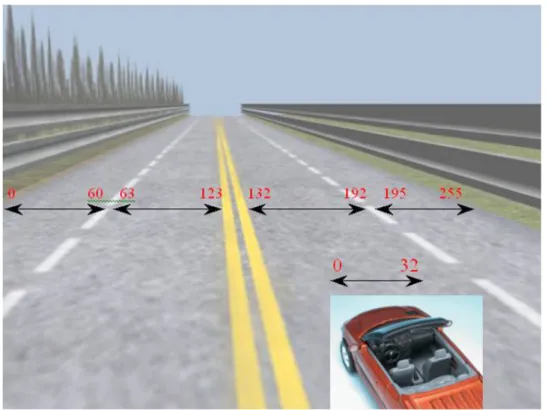
the driving cabin that is mounted on a 6-DOF Stewart motion platform. The four lanes from left to right are separated by a median stripe. The distance from the left side to the right side of the road is equally divided into 256 points (digitized into values 0-255, as shown in Figure 2-3), where the width of each lane and the car is 60 units and 32 units, respectively. These units can be converted to the real distance (for instance, the width of the real road is about 6 meters) in real-world applications. The refresh rate of highway scene is set properly to emulate a car driving at a fixed speed of 100 km/hr on the highway. The car is randomly drifted (triggered from the WTK program and the on-set time is recorded) away from the center of the cruising lane to mimic the consequences of a non-ideal road surface.
Figure 2-3: The width of highway is equally divided into 256 units and the width of the car is 32 units
To the best of our knowledge, the proposed environment setting is the first attempt at applying “kinesthetic” VR environment with motion platform techniques to
investigate brain activity in neuropsychological studies. The motion platform was conjugated with physiological and behavioral response recordings to offer more assessment options than the conventional neuropsychological studies could do. This was an innovative idea that provided an interactive, safe and realistic environment at very low cost. The VR technique allows subjects to interact directly with a virtual environment rather than passively responding to monotonic auditory and visual stimuli, and thus is an excellent setting for studying EEG dynamics in interactive and realistic tasks.
2.2 Electroencephalogram Signal Acquisition System
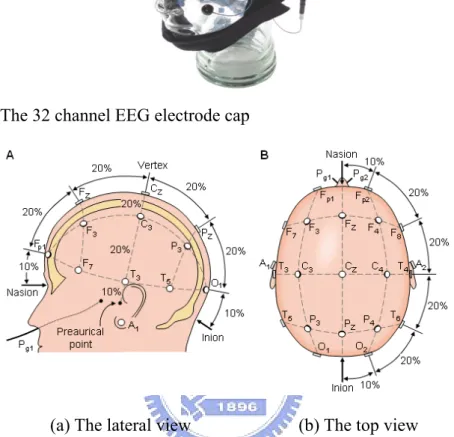
Subjects wore a movement-proof electrode cap with 36 sintered Ag/AgCl electrodes to measure the electrical activities of the brain. The physiological data acquisition used 2 bipolar ECG electrodes placed on the chest and 33 unipolar EEG/EOG electrodes placed based on a modified International 10-20 system (FP1/2, F3/4, F7/8, FZ, FC3/4, FT7/8, FCZ, C3/4, T3/4, CZ, CP3/4, TP7/8, CPZ, P3/4, T5/6, PZ, O1/2, OZ, VEOU, VEOL, A1) and refer to the mean of the left and right mastoid electrodes. Figure 2-4 shows the 32 channel EEG electrode cap. All EEG channels were located based on a modified International 10-20 system as shown in Figure 2-5 (Thakor, 1999). The 10-20 system is based on the relationship between the locations of an electrode and the underlying area of cerebral cortex.
Figure 2-4: The 32 channel EEG electrode cap
(a) The lateral view (b) The top view Figure 2-5: The International 10-20 system of electrode placement
Before data acquisition, the contact impedance between EEG electrodes and scalp was calibrated to be less than 5kΩ by injecting NaCl-based conductive gel. We used the Scan NuAmps Express system (Compumedics Ltd., VIC, Australia), a high-quality 40-channel digital EEG amplifier capable of 32-bit precision sampled at 1000 Hz, to simultaneously record the EEG/EOG/ECG data and the deviation between the center of the vehicle and the center of the cruising lane triggered by the VR program. The EEG data were band-passed between 0.5 and 100Hz with a 60Hz notch filter, and recorded with 16-bit quantization level at a sampling rate of 500 Hz and then down-sampled to 250 Hz for the simplicity of data processing.
2.3 Independent Component Analysis
Independent Component Analysis (ICA) is a signal processing technique that finds a linear mapping matrix or unmixing matrix W such that the unknown unmixed signals of the dimension N, U(t) = [u1(t), …, uN(t)]T could be separated from their
mixtures, X(t), that is Y(t) = W-1
X(t). The ICA methods were extensively applied to
blind source separation problem since 1990s (Jutten et al., 1991; Comon, 1994; Bell et al., 1995; Girolami, 1998, Lee et al., 1999). Subsequent technical reports (Jung et al., 1998, 2000, & 2001; Naganawa et al., 2005; Liao et al., 2005) demonstrated that ICA was a suitable solution to the problem of EEG source segregation, identification, and localization.
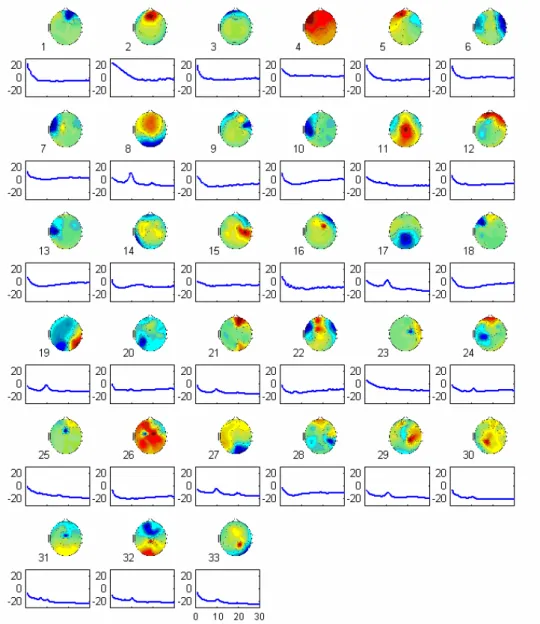
In this study, we used an extended version of informax algorithm of Bell and Sejnowski (1995) that can separate sources with either super- or sub-Gaussian distributions, to decompose distinct brain activities. After ICA training, we can obtain 33 ICA components decomposed from the measured 33-channel EEG data. It has also been used in our previous study (Lin et al., 2005). Figure 2-6 shows the scalp topographies of ICA back-projection matrix W-1 of one subject and the log bandpower
spectra of all ICA components, which provide information about the location of the sources. For instance, eye activity was projected mainly to frontal sites. Hence, most of the eye-movement artifacts are isolated to components 1-3, as shown in Figure 2-6. The drowsiness-related potential is on the parietal lobe to occipital lobe. We can observe that the ICA components 8, 17, and 27 may be considered as effective “sources” related to drowsiness in the VR-based dynamic driving experiment (based on the correlation analysis in chapter 4).
Figure 2-6: The scalp topographies and the corresponding log bandpower spectra of all ICA components.
2.4 Event-Related Potential
Single-trial event-related potential (ERP) data are usually averaged prior to analysis to increase their signal/noise relative to non-time and -phase locked EEG activity and non-neural artifacts. The ERP is much smaller than the amplitudes of ongoing EEG, and it is thus often buried in the EEG recordings. In order to extract the ERP from EEG signal, we need to increase the signal to noise ratio by presenting the same type of stimuli to the subject repeatedly. ERP is often obtained by averaging
EEG signals of accumulated single trails of the same condition. Ongoing EEG signals across signal trails are considered random and independent of the stimulus. However, it is assumed that the waveform and latency of ERP pattern are invariant to the same stimulus. Through phase cancellation, time- and phase-locked EEG signals will be more prominent.
Event-Related Potential (ERP) images directly visualized single event-related EEG trials and their contributions to the averaged ERP (Jung et al., 2001). An ERP image also makes visible relationships between subject behavior and amplitudes/latencies of individual event-related responses. The limitation of ERP is that it only measures coherent time-and-phase-locked activities. Averaging same response epochs would involve phase cancellation, brain activities not exactly synchronized in both time and phase are averaged out.
2.5 Event-Related Spectral Perturbation
The event-related spectral perturbation (ERSP) measures average dynamic changes in amplitudes of the broad band EEG spectrum as a function of time following cognitive events. The processing flow is shown in Figure 2-7. The time sequence of EEG channel data or ICA activations are subject to Fast Fourier Transform (FFT) with overlapped moving windows. Spectrums prior to event onsets are considered as baseline spectra. The mean baseline spectra were converted into dB power and subtracted from spectral power after stimulus onsets so that we can visualize spectral perturbation from the baseline. To reduce random error, spectrums in each epoch were smoothed by 3-windows moving-average. This procedure is applied to all the epochs, the results are then averaged to yield ERSP image. Through ERSP, we are able to observe time-locked but not necessarily phase-locked activities. ERSP thus can reveal aspects of event-related brain dynamics which might not be
measurable in ERP averages of the same response epochs (Makeig, 1993). In this study, we applied both ERP and ERSP analysis on the EEG data acquisition in our experiments.
Figure 2-7: Event-related spectral perturbation plot. ERSP plots the grand mean time course of changes from pre-stimulus baseline in log spectral power of a scalp-recorded EEG or ICA component activation time-locked to stimulus presentation or subject responses across frequencies.
3. EEG Activation of Kinesthetic Perception
3.1 Introduction
Kinesthetic perception -- the sensory apparatus that detects motion -- is one of the most important sensations to human beings, yet we usually overlook the contributions of the vestibular system to our lives, simply because it doesn’t give us the sense of this vivid and harmonic world the way our eyes and ears do. In addition, kinesthetic perception doesn’t involve taste or smell, making it less appreciated. But, we would not have a complete sensation of the world without the perception of motion. Vestibular system is one of the most important sensory apparatus for detecting the perception of motion. One of the most common kinesthetic perceptions in our life is the motion associated with driving. Almost all of the existing EEG correlated research studies of perceiving kinesthetic stimuli focus on the brain dynamics of the subjects receiving visual and/or auditory stimulus, very few one focus on the subject perception of kinesthetic stimulus such as car drivers, airplane pilots, etc.
In this chapter, we investigated EEG dynamics in response to kinesthetic stimuli by using the dynamic VR driving environment. This dynamic VR environment mimicked visual-vestibular co-stimulation during driving. Using simple driving behaviors such as deceleration, acceleration, and deviation, we studied brain responses of kinesthetic inputs by comparing subjects’ EEG differences in motion (while the motion platform is active) and motionless (while the motion platform is inactive) conditions of the dynamic platform.
3.1.1 Vestibular system and kinesthetic stimulus response
inner ears which detects the motion of the head and body in space (Berthoz, 2000). It is composed of two functional parts: the otolithic organs and the semicircular canals. The otolithic organs detect linear accelerations, while the semicircular canals detect rotary accelerations (Merfeld et al., 1999; Seidmann et al., 1998). Vestibular information plays an important role in perceptual tasks such as ego-motion estimation (Berthoz et al., 1995). In recent research, vestibular information was shown to disambiguate the interpretation of dynamic visual information during an observer’s movement (Wexler et al., 2001). Researchers have tried to measure evoked potentials of vestibular origin for 30 years. Elidan et al. (1991) reported the ERP response to high speed and transient vertical Z axis rotation. Subjects were rotated at the speed of 10,000°/sec2 for 2 ms. The reported negativity peaked at about 15 ms after the onsets of rotation from signals measured at a forehead mastoid electrode. Baudonniere et al. (1999) reported a biphasic negative wave, that is most prominent at central midline electrode (Cz) in subjects who received short (30 ms) linear displacements without co-stimulation of the semicircular canals.
Probst et al. (1993, 1996, & 1997) and Loose et al. (2002) observed bell-shaped negativity at central midline channels following roll up and down motion along the X axis. The Vestibular Evoked Potential (VESTEP) evoked by stimulating otolithic and semicircular canals with different orientations of rotations or directions of movements was investigated in depth. The experimental variables in these studies were well controlled; for instance, subjects were blindfolded in VESTEP investigations, or watched pixels moving or rotating on the screen. This might be desirable from the perspective of scientific research, but is less practical because we rarely experience vestibular stimulation without visual co-stimulation or watch pixels rotating or moving in the real world. We actually live in a visual-vestibular co-stimulation world and the visual cue is always a meaningful and continuous scene
-- in driving, for instance.
3.1.2 Kinesthetic perception during driving
One of the most experienced kinesthetic perceptions in our life is the motion associated with driving. Whenever our vehicle accelerates, decelerates, or curves around a corner, we experience a force pulling our body against the direction of motion. However, there are at least several major obstacles in investigating the driving perception in a real driving environment. First, the safety concerns dictate that experiments must be conducted in a safe driving environment, making it an ethic issue to conduct driving experiments on the road while experiments know the subject might experience attentions lapse during experiments. Second, appropriate data acquisition and monitoring are needed for studying the rapid physiological responses of kinesthetic stimuli. The stimulation should be simple enough and repeatable to keep the experiment under control. Last, objective evaluation should be assessed in the studies. A driver senses not only the pushing or pulling force, but also the scene changes related to the movement of the vehicle. The driving perception includes the co-stimulation of visual cue, vestibular stimulation, muscle reaction, and skin pressure.
This is indeed a complicated mechanism to understand. One of our solutions is to conduct driving experiments using a realistic simulator, which is widely used in driving-related research (Kemeny et al., 2003). Regarding the necessity of motion during driving, the literature shows that the absence of motion information increases reaction times to external movement perturbations and decreases safety margins in the control of lateral acceleration in curve driving (Reymond et al., 2001). In real driving, improper signals from disordered vestibular organs were reported to contribute to inappropriate steering adjustment (Page and Gresty, 1985). Groen et al. (1999) also
showed that the presence of vestibular information in driving simulators was important in the perception of illusory self-tilt and illusory self-motion. These studies emphasized the importance of motion perception during driving to the assessment of driving performance and behavior. However, assessing driving performance or behavior is not objective enough since the performance and behavior varies due to the subject’s training or learning effect. In this paper, we use a direct and objective method to evaluate human cognition during driving.
3.1.3 EEG studies under VR based dynamic driving
The EEG is a complex signal, the statistical properties of which depend on both time and space. Regarding the temporal characteristics, it is essential to note that EEG signals are ever-changing. The EEG has been used for 80 years in clinical practice as well as basic scientific studies. It is a popular method for evaluating human cognition today, which directly measures brain responses to external or internal stimulation. Much more information can be obtained from an EEG than from appearance behavior. Compared to another widely used neuro-imaging modality, functional Magnetic Resonance Imaging (fMRI), the greatest advantage of EEG is speed-it can record complex patterns of neural activity occurring within fractions of a second after a stimulus has been presented. EEG acquisition is also much less expensive, more portable and the only modality in which subjects allow to move their heads, thus it is applicable in operational environments such as driving in the moving vehicle.
In recent years, researchers have designed the Virtual Reality (VR) senses to provide appropriate environments for assessing brain activity during driving (Lin et al., 2005; Eoh et al., 2005). Lin et al. (2005) introduced the “dynamic” VR environment, that is, a VR scene with a motion platform, in conjunction with physiological and behavioral response recordings to offer more assessment options
than were available in traditional neuropsychological studies. This was an innovative idea that provided an interactive and realistic environment at very low cost and avoided the risks of operating an actual vehicle on the road. However, the EEG correlates of kinesthetic stimulations induced by the motion platform in the dynamic VR scene have not been fully assessed or appreciated.
To solve the aforementioned problems in studying kinesthetic perceptions during driving, using the realistic simulator is a good alternative used in driving-related research (Page and Gresty, 1985; Reymond et al., 2001; Groen et al., 1999; Eoh et al., 2005). Those studies primarily emphasized on the importance of motion perception during driving by assessing subjects’ driving performances and behaviors. But such evaluations may be not objective enough since the performances and behaviors could vary with the subject’s previous training or learning experiences. To simulate the more realistic driving condition, we have designed an interactive Virtual Reality (VR) scenes and a dynamic driving simulator to provide appropriate environments for assessing brain activity during kinesthetic driving (Lin et al. 2005). The “kinesthetic” VR environment is a VR scene with a motion platform controlled by the six hydraulic linear actuators. During the driving experiment, all scenes are continuously updated according to the displacement of the car and the subject’s wheel handling.
3.2 Experiment Setup
3.2.1 Driving Events
We designed three driving events: stop, go, and deviation in the development virtual reality-based dynamic driving environment. The stop and go events were paired into a Stop-Go event, which means a stop event was always followed by a go event. The deceleration and acceleration in a Stop-Go event was controlled by a computer program. Figure 3-1 shows the time course of a typical Stop-Go event.
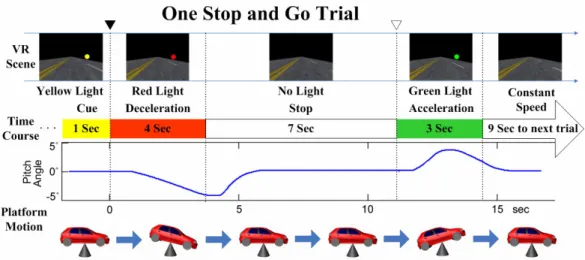
Figure 3-1: Illustration of the design for Stop-Go events in driving. The time course is cut into five sections. The top-panel pictures show the VR scenes in the sections, the blue trace shows the pitch angle of the hexapod motion platform, and the bottom panels depict the posture of the vehicle mounted on the motion platform. An event starts with a yellow-light cue displayed on the screen. One second later, the yellow light is replaced by a red light and a Stop-Go event begins in conjunction with a deceleration simulated by the motion platform. The car is slowed down to a complete stop in four seconds when the red light is out. Seven seconds later, a green light is shown on the screen, and a go event begins. The hexapod motion platform starts accelerating for 3 seconds. Then the green light goes off, and the vehicle is moving at a constant speed until the next event occurs.
Subjects were not required to take any action in the stop and go events during the experiment so that it can avoid the artifacts caused by the movement of the subjects. Moreover, the vehicle was randomly drifted away from the cruising position, which was defined as a deviation, and the subjects were instructed to steer the vehicle back to the center of the cruising lane as quickly as possible. The deviation events can keep subjects’ attention and we can estimate the subjects’ cognitive level from the reaction times. The driving behavioral information, such as the onsets of the deviation, subject reaction times, or steering angles, were recorded for further analysis.
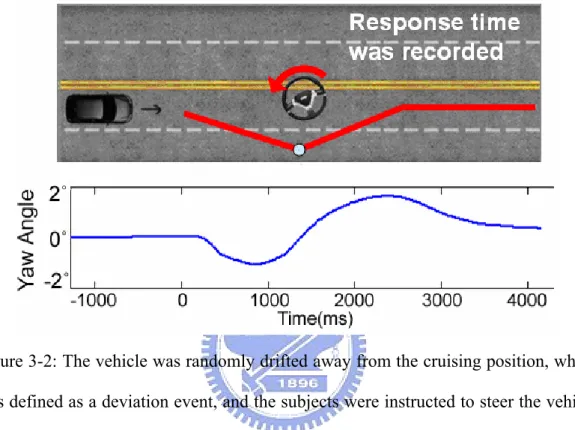
Figure 3-2 illustrates a deviation event in which the vehicle was moving forward in a straight line. The vehicle deviated either to the left or to the right. The Stop-Go event and deviation event occurred randomly with the probability of 50% and the inter-event interval was 9 seconds.
Figure 3-2: The vehicle was randomly drifted away from the cruising position, which was defined as a deviation event, and the subjects were instructed to steer the vehicle back to the center of the cruising lane as quickly as possible. The driving behavioral information, such as the onsets of the deviation, subject reaction times, or steering angles, were recorded for further analysis. In a deviation event, the vehicle was moving forward in a straight line. The vehicle deviated either to the left or to the right. The Stop-Go event and deviation event occurred randomly with the probability of 50% and the inter-event intervals were 9 seconds.
3.2.2 Subjects and EEG Data Acquisition
Ten right-handed, healthy subjects (aged between 20 and 28) participated in this study. All subjects had driving license and at least one-year driving experience. Subjects were instructed to keep the car at the center of the inside lane by controlling
the steering wheel, and to perform the driving task consciously. Each subject completed four 25-minute sessions of the driving experiment. Sessions were motion and motionless counterbalanced and each session included stop-go events and deviation events in random order. Thus we have six conditions: “Motion-Stop,” “Motion-Go,” “Motion-Deviation,” “Motionless-Stop,” “Motionless-Go,” and “Motionless-Deviation.” To prevent subjects from experiencing drowsiness during experiments, they rested for a few minutes after each session until they were ready for the next one. The entire driving experiment lasted about 2 hours. Subjects performed at least 2 driving experiments on different days for testing the cross-session consistency.
Subjects wore the movement-proof electrode cap with 36 sintered Ag/AgCl electrodes to simultaneously record the EEG/EOG/ECG data and the deviation between the center of the vehicle and the center of the cruising lane triggered by the VR program. In addition, an accelerometer recording 3-DOF (Degrees of Freedom) was placed on the center of the vehicle to record the platform movement. This accelerometer recorded orientations of the vehicle in pitch, roll, and yaw during the driving simulation, thus we could correlate physiological data with the orientation recording and investigate the relationship between human cognition and kinesthetic stimulus.
3.2.3 EEG Data Analysis
The recordings were down-sampled to 250 Hz for simplicity of data processing. Then the EEG data were preprocessed using a simple low-pass filter with a cut-off frequency of 50 Hz to remove the line noise (60 Hz and its harmonic) and other high-frequency noises for further analysis. The continuous EEG signals were first extracted into epochs whose lengths were designed to cover the whole platform
dynamics in single driving events. For stop events and go events, epochs contained EEG data from 4s before to 9s after the onsets of the red light. For deviation events, epochs contained signals from 1s before to 2s after the deviation onsets. We then applied ICA to concatenated epochs to decompose them into temporally statistical component activations.
To study the cross-subject component stability of ICA decomposition, components from multiple sessions and subjects were clustered based on their spatial distributions and EEG characteristics (Jung et al., 2001; Makeig et al., 2004).
Component clustering grouped massive components from multiple sessions and subjects into several significant clusters. Cluster analysis, k-means, was applied to the normalized scalp topographies and power spectra of all 930 (30 channels x 31 sessions) components from the 10 subjects. After ICA decomposition, noisy components were removed prior to cluster analysis. The cluster analysis, k-means, identified at least 9 clusters of components having similar power spectra and scalp projections. These component clusters also showed functionally distinct activity patterns. Nine distinct component clusters (as shown in Figure 3-3) accounted for eye blinks (upper left), horizontal eye movements (upper right), and other brain activities, respectively. Artifactual components accounted for such as eye blinks and horizontal eye movements were effectively removed from the activity of the other seven component clusters by the ICA decomposition and are not further considered here.
Figure 3-3: The ICA components from 11 subjects are clustered into 9 groups. The averaged scalp map and averaged baseline (before event onsets) power spectral density of each group are shown in the plot. The motion-related features are found in left-mu (middle-left), right-mu (middle-right), and central-midline (middle) components.
3.3 Experiment Results
The sessions in each experiment were divided into “motion” (when the motion platform was in action) and “motionless” (when the motion platform was not in action) sessions with stop, go, and deviation events. According to the behavioral data of the deviation events, all subjects’ response time are less than one second (as shown in Table 3-1). This indicated that all subjects were alert and attentive during the whole sessions. We get six conditions: “Motion-Stop,” “Motion-Go,” “Motion-Deviation,” “Motionless-Stop,” “Motionless-Go,” and “Motionless-Deviation” after the subjects have performed all the experiments. By comparing the motion and motionless pair, we hope to find some differences in brain responses between these two conditions.
Table 3-1: The response time (RT) of Motion-Deviation and Motionless-Deviation events. Overall, the RT in dynamic driving is 40~50 ms shorter than that in static driving. These results were obtained using PRISM.
3.3.1 Effects of Kinesthetic Stimuli in Mu Component Activations
Figure 3-4 shows the ERSP of a component from a typical subject that exhibited differential brain responses between motion and motionless conditions. The component scalp map exhibited the defining features of mu rhythms -- distinct spectral peaks near 10 Hz and 22 Hz, with equivalent dipoles located roughly over hand motor cortex (and/or adjacent post-central somatosensory areas), and oriented roughly orthogonal to the directions of the central sulci. The upper ERSP panels show the ERSP following stop events, while the lower two show go-event ERSP. Images on the left are brain responses under “motion” conditions and those on the right are under “motionless” conditions. The curves below the images are the time courses of the platform motion (pitching, rotate by Y axis). Mu power was strongly blocked (reduced) around the peak of platform motion in Motion-Stop and Motion-Go events. In contrast, no mu blocking occurred following either stop or go events in the motionless condition (Figure 3-4, right panels). Thus the mu blocking appears to be induced by the kinesthetic inputs in stop and go events.
Figure 3-4: A right mu component shows mu characteristic 10 Hz and 22 Hz peaks in the activity spectrum (lower left). The component mean ERSP shows mean event-related changes in (log) spectral power across data trials time-locked to the kinesthetic stimulus onsets (dashed line). Following the motion platform movement, this activity is blocked. The activity was unchanged from the baseline spectra if the motion platform was not in action (right).
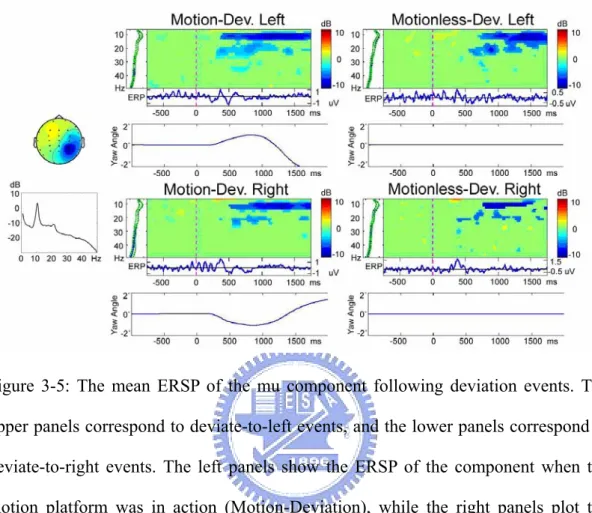
Mu blocking was also observed following deviation events. Figure 3-5 shows the ERSP of a right mu component following deviation events. The upper and lower panels show ERSPs of the component following “deviate-to-left” and “deviate-to-right” events, respectively. The curves below show the recorded platform motion. Notice that the motion platform tilted along different directions in Stop-Go and deviation events (cf. Figure 3-5). In deviation events, the platform rotated slightly along the vertical Z axis.
When deviation occurred, the subjects were instructed to maneuver the car back to the cruising position by steering the wheel. It is expected that mu activity would be blocked due to the hand movement (cf. Figure 3-5 ERSP) in both motion and motionless conditions. However, the latency of mu blocking in the motion condition
(Figure 3-5 left panels) was significantly shorter than that in the motionless condition (Figure 3-5 right panels).
Figure 3-5: The mean ERSP of the mu component following deviation events. The upper panels correspond to deviate-to-left events, and the lower panels correspond to deviate-to-right events. The left panels show the ERSP of the component when the motion platform was in action (Motion-Deviation), while the right panels plot the ERSP when the platform was not in action (Motionless-Deviation). Mu blocking appears in all four conditions, but the latencies of the activation were shorter in Motion-Deviation (left panels) than those in motionless conditions.
3.3.2 Effects of Kinesthetic Stimuli in Central Midline Component Activations
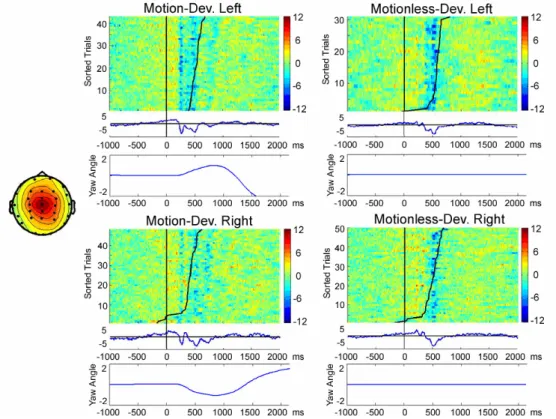
Figure 3-6 shows the scalp map and dynamic properties of an independent component from the same subject in Motion-Deviation and Motionless-Deviation conditions. The scalp map of the CM component (Figure 3-6 upper left) resembles scalp maps of the “P3a” or “P3novel” ERP peaks seen, for example, when unique and unexpected stimuli are included in a randomly alternating sequence of target and
non-target stimuli (Polich and Comerchero, 2003). In two-dimensional “ERP image” plots of single trials from the subject, potential fluctuations in single trials are shown as color-coded horizontal lines, here normalized by component activation baseline variability then sorted (across all trials) by response time (RT). The ERP images clearly show that the early kinesthetic response, peaked at ~250 ms, was time-locked to deviation onset. However, this sharp negativity was missing in the motionless condition (Figure 3-6 right panels). We suspect that the negativity was primarily induced by the platform motion.
Figure 3-6: Single-trial Event-Related Potentials (ERPs) of the central midline (CM) component following deviation events under 4 different conditions. The upper two panels plot ERSP in deviate-to-left events, and the lower two panels plot ERSP in deviate-to-right events. The left panels correspond to Motion-Deviation, while the right panels correspond to Motionless-Deviation. The averaged ERPs exhibit a strong negative peak 500 ms after deviation onsets in all 4 conditions, however the negativity peaks ~250 ms post-event are only evoked by the deviation events when the platform
is in action (Motion-Deviation).
3.3.3 Effects of Kinesthetic Stimuli in Component Clustering Results
Figure 3-7 shows the mean map and power spectrum of a large cluster of left mu components. The power spectra of the component cluster contained peaks near 11 and 20 Hz. In all 29 components from 10 subjects contributing to this cluster, the 11 Hz activity was blocked following kinesthetic stimuli in the motion condition, strongly suggesting that these represented mu activity. Scalp maps of individual left mu components in this cluster (Figure 3-7 right panels) strongly resembled the (left) cluster mean map.
Figure 3-7: Mean (N=29) component map and mean power spectra of a left-mu component cluster. Individual component maps resembled the averaged scalp map.
Figure 3-8 shows the component cluster mean ERSP of the component activations following Stop-Go events under the motion (left panels) and motionless (right panels) conditions. The ERSP images of motion sessions exhibited a strong mu
blocking and alpha rebound, which were completely missing from the ERSP images under motionless conditions, consistent with the results in a typical subject shown in Figure 3-4.
Figure 3-8: The group-averaged ERSP shows the component activations following Stop-Go events under the motion (left panels) and motionless (right panels) conditions. The ERSP images of motion sessions exhibited a strong mu blocking and alpha rebound, which were completely missing from the ERSP images under motionless conditions, consistent with the results in a typical experiment shown in Figure 3-4.
Similarly, Figure 3-9 shows averaged ERSP images following deviation events under motion and motionless conditions. Although the ERSP images in all four conditions exhibited similar mu blocking induced by the steering actions, the latencies of mu blocking differed considerably. Figure 3-10 shows the differences between mu blocking in motion and motionless conditions, which were obtained by subtracting the
motionless ERSP (right panels of Figure 3-9) from the motion ERSP (left panels of Figure 3-9). The dashed line marks average response time. A brief (~200 ms) alpha-band power suppression was evident in these two ERSP difference images, indicating that the mu blocking occurred earlier in Motion-Deviation events than in Motionless-Deviation events. No significant differences were found in the rest of the ERSP difference images. The subtracted images showed that mu blocking occurred 200 ms earlier in Motion-Deviation.
Figure 3-9: The group-averaged ERSP images following deviation events under motion and motionless conditions. Although the ERSP images in all four conditions exhibited similar mu blocking, the latencies of mu blocking differed considerably.
Figure 3-10: The differences between mu blocking in motion and motionless conditions, which were obtained by subtracting motionless ERSP (right panels of Figure 3-9) from the motion ERSP (left panels of Figure 3-9). The ERSP difference images show a brief (250~300 ms) alpha-band power suppression, indicating that the mu blocking occurred earlier in Motion-Deviation than in Motionless-Deviation.
3.4 Discussion
In this study, we recorded and analyzed un-averaged single-trial EEG data in 31 driving experiments from 10 volunteer drivers under two different driving conditions -- motion and motionless. The hexapod motion platform that simulated driving events allowed us to study neural correlates of kinesthetic stimuli, which is difficult, if possible, to study in regular EEG laboratories. We performed ICA to separate the EEG contributions of distinct brain processes to explore their individual and joint event-related dynamics following Stop-Go and deviation events through ERP differences and time-frequency analysis (ERSP). The 9 independent component clusters here identified by their similar scalp projections and activity spectra resemble classes of EEG phenomena long described by neurologists from observations of paper data displays such as central and lateral alpha, left and right mu, and frontal-midline theta rhythms. Alpha power of the mu component cluster was strongly blocked (~-5dB) around the peak of platform movement in Motion-Stop and Motion-Go events. A sharp negative was found in the central midline component cluster only in
Motion-Deviation events. We believe that these two features were induced by kinesthetic stimuli.
3.4.1 Phenomenon in Mu Component
Mu rhythm (μ rhythm) is an EEG rhythm recorded usually from the motor cortex of the dominant hemisphere. It is also called arciform rhythm given the shape of the waveforms. It is a variant of normality, and it can be suppressed by a simple motor activity such as clenching the fist of the contra lateral side, or passively moved (Thilo et al., 2003; Loose et al., 2002; Parker et al., 2001). Mu is believed to be the electrical output of the synchronization of large portions of pyramidal neurons of the motor cortex which control the hand and arm movement when it is inactive.
Deviation events involved subject responses to steer the vehicle back to the cruising position, thus it is expected that mu power would be blocked following deviation events. Our results also showed unexpected strong mu blocking in response to Motion-Stop and Motion-Go events in which no action was involved, suggesting kinesthetic stimuli could also induce mu blocking. Following deviation events, mu power was strongly blocked in both motion and motionless conditions (cf. Figures 3-9 and 3-10). Mean subject RT indexed by the first steering action in response to Motion-Deviation events leads that in response to Motionless-Deviation events by about 50 ms. Thus, we expect that the latency of mu blocking in Motion-Deviation events would lead that in Motionless-Deviation events by a comparable length. However, Figure 3-10 reveals that the mu-blocking latency discrepancy between the two conditions is about 250~300 ms, which could not be attributed entirely to the subject RT latency difference. Mu blocking thus appears associated with kinesthetic stimuli delivered to the drivers. In short, long-lasting mu blocking following deviation events began with the EEG brain dynamics induced by kinesthetic stimuli, followed
by marked mu power decrease associated with subject motor actions. Table 3-1 gives us the information that response time in Motion-Deviation events was only 50 ms faster than in Motionless-Deviation events. By these two results we discovered 200~250 ms duration which was not related to steering action.
3.4.2 Phenomenon in Central Midline Component
The central midline component cluster exhibits a sharp negativity in averaged ERP following Motion-Deviations, but the negativity is missing from the ERP following Motionless-Deviations. The mean ERP in deviate-to-right and deviate-to-left conditions was almost identical. ERP images also show a weaker negative ERP time-locked to subjects’ reactions (the black line in the ERP image), which again is comparable following Motion-Deviation and Motionless-Deviation events. Response time in Motion-Deviation events was approximately 50 ms shorter than that in Motionless-Deviation events (as shown in Table 3-1), consistent with a previous report (Wexler et al., 2001) which showed that the absence of motion information increased response times to external movement perturbations.
The sharp negativity in the ERP of the central midline component cluster is also consistent with previous VESTEP studies of Elidan et al. (1982, 1984, & 1987). They showed a negative potential near Cz or forehead, induced by external kinesthetic stimulus. They did not, however, report any mu blocking in response to the kinesthetic stimuli, which to the best of our knowledge has never been reported in the past. The reason is due at least in part to the fact that our experimental environment, which combined visual and vestibular interaction and driver response, was more complicated and realistic than the experimental setups used in previous studies.
3.4.3 EEG Alpha Activity related to Drowsiness
Traditionally, EEG alpha band was used as an indicator of drowsiness estimation during driving (Lin et al., 2005; Eoh et al., 2005). Alpha power has been reported to index the level of drowsiness in attention-sustained experiments in a laboratory setting. In this study, our results showed that alpha-band activity varies during driving, especially when the vehicle is moving and delivers kinesthetic stimuli to the drivers and passengers, which might confound the fatigue-related alpha power changes in driving. Thus, more care must be taken to examine the validity of using alpha power to index drowsiness level in real driving.
Our experiment results show that kinesthetic stimulus during driving induces (1) Mu blocking in the somatomotor components, and (2) Sharp negative ERP in central midline components. The mu blocking appeared to be induced by two types of stimuli successively. When the subjects received kinesthetic inputs, their alpha activities in the left and right mu components were blocked. After a short period, the subjects made an adjustment to balance them, inducing a secondary mu blocking. The alpha power variation induced by the motion of the vehicle might interfere with the estimation of the driving cognitive state based on the fluctuations in the alpha power spectra.
Furthermore, negative ERP was found in central midline components following kinesthetic stimulus onsets. These results demonstrate that multiple cortical EEG sources respond to driving events distinctively in dynamic and static/laboratory environments. A static driving simulator could not induce some cognitive responses that are actively involved in real driving. We also reported that the absence of driving motion will increase the reaction time to external perturbations by studying the response time in deviation events. Thus a driving simulator with a motion platform is crucial to studying event-related brain activities involved in real driving.
4. EEG Activation under Different Cognitive States
4.1 Introduction
The growing number of traffic accidents had become a serious concern to the society in recent years. Accidents caused by driver’s drowsiness behind the steering wheel have a high fatality rate because of the marked decline in the driver’s abilities of perception, recognition and vehicle control abilities while being sleepy. For instance, the National Highway Traffic Safety Administration (NHTSA) conservatively estimates that 100,000 police-reported crashes are the direct result of driver fatigue each year. This results in an estimated 1,550 deaths, 71,000 injuries and $12.5 billion in monetary losses. The National Science Foundation (NSF) also reported in 2002 that 51% of adult drivers had driven a vehicle while feeling drowsy and 17% had actually fallen asleep. Preventing traffic accidents caused by drowsiness is highly desirable but requires techniques for continuously monitoring, estimating, and predicting the level of alertness of drivers and delivering effective feedbacks to maintain their maximum performance (Pilutti and Ulsoy, 1999). Therefore, we demonstrated an EEG-based drowsiness estimation method in long-term driving in this chapter. In our past research, we had already found the parietal and occipital brain sources were highly correlated with drowsiness via ICA-based signal process (Lin et al., 2005 & 2006). The method combined ICA, EEG log band power spectrum, correlation analysis, and linear regression models to indirectly estimate driver’s drowsiness level. Here, we use the same method to estimate subject drowsiness level, except we employ MEMS sensors rather than conventional wet ones to acquire continuous EEG data to demonstrate the potential uses of the MEMS sensors during long and routine recordings in the VR-based dynamic driving environment.
signal with skin preparation even it had better performance. Using electrolytic gel is not only uncomfortable and inconvenience, but also can cause itchy feeling, and sometimes make skin red and swollen during long-term EEG-measurement. Hence, we also have developed an EEG-based drowsiness estimation algorithm that consisted of signal acquisition, power spectrum estimation, Principal Component Analysis (PCA)-based signal process, and multivariate linear regression to estimate the driver’s drowsiness level in the VR-based dynamic driving environment.
4.2 Experimental Setup
Ten subjects (ages from 20 to 40 years, 29.8±5.9 years old) participated in the VR-based highway driving experiments. To maximize the opportunities to get valuable data for our study, all driving experiments were conducted in the early afternoons after lunch. Statistics (Jung et al., 1997; Makeig and Jung, 1995) showed that people often get drowsy within one hour of continuous driving during these periods, indicating that drowsiness is not necessarily caused by long driving-hours. The driving speed is fixed as 100 km/hr and the car is randomly and automatically drifted away from the center of the cruising lane to mimic the consequences of a non-ideal road surface. On the first day, participants were told of the general features of the driving task, completed necessary informed consent material, and then started with a 15 to 30-minute practice to keep the car at the center of the cruising lane by maneuvering the car with the steering wheel. Subjects reported this amount of practice to be sufficient to reach a performance asymptote on the task. After practicing, participants wore wired EEG cap with electrodes and began 1-hour lane-keeping driving task. Participants returned on a different day to complete the other 1-hour driving session for cross-session test. While the subject was alert in the experiment, his/her response time was short and the deviation of the car was small; otherwise the
subject’s response time and the car deviation would be slow and long. In this driving experiment, the VR-based freeway scene showed only one car driven on the road without any other event stimuli to simulate a monotonous and unexciting task that could easily make drivers fallen asleep.
The flowchart of data analysis for estimating the level of drowsiness based on the EEG power spectrum is shown in Figure 4-1. For each subject, after collecting EEG signals and driving deviation in 1-hour simulated driving session, the EEG data were first preprocessed using a simple low-pass filter with a cut-off frequency of 50 Hz to remove the line noise and other high-frequency noise. Then, we applied ICA to decompose EEG-signals into temporally independent stationary sources and calculated the moving-averaged log power spectra of all ICA components.
33-channel EEG data ICA decomposition ICA components Power Spectra analysis Power spectra of ICA components Correlation analysis 2 ICA components with highest correlation coefficient Linear regression model Drowsiness estimation Adaptive Feature selection mechanism Effective frequency bands and ICA components 33-channel EEG data ICA decomposition ICA components Power Spectra analysis Power spectra of ICA components Correlation analysis 2 ICA components with highest correlation coefficient Linear regression model Drowsiness estimation Adaptive Feature selection mechanism Effective frequency bands and ICA components
Figure 4-1: Flowchart of the drowsiness detection system
In general, the drowsiness-related regions are mainly in the parietal and occipital lobes. If we acquire the EEG signal from these haired regions of the hindbrain to detect drowsiness level in realistic environment, it is uncomfortable and inconvenient