國
立
交
通
大
學
光電工程研究所
碩 士 論 文
互動演算法應用於三維觸碰顯示面板
Interactive Algorithm for 3-Dimentional Touch Panel
研 究 生:吳璧丞
指導教授:黃乙白 博士
互動演算法應用於三維觸碰顯示面板
Interactive Algorithm for 3-Dimentional Touch Panel
研 究 生: 吳璧丞 Student : Pi-Cheng Wu
指導教授: 黃乙白 Advisor : Yi-Pai Huang
國 立 交 通 大 學
光 電 工 程 研 究 所
碩 士 論 文
A Thesis
Submitted to Institute of Electro-Optical Engineering College of Electrical and Computer Engineering
National Chiao Tung University in partial Fulfillment of the Requirements
for the Degree of Master
in
Electro-Optical Engineering June 2010
Hsinchu, Taiwan, Republic of China
i
互動演算法應用於三維觸碰顯示面板
碩士研究生:吳璧丞 指導教授:黃乙白 副教授
國立交通大學電機學院 光電工程研究所
摘 要
近年來立體顯示器的發展,期望能夠提供給人們一個更接近真實生活的視覺 享受。然而,在既有的立體顯示器系統之下,如何達成人機的互動,也成為各家 廠商與研究單位爭相開發的技術。既有的立體顯示器人機互動界面大多採用外加 光學感測元件以達成互動機制,這個外加光學元件使得整體系統的體積增加。同 時,若是採用電荷耦合元件(CCD)作為光學感測元件,則會因為收光角度的影響, 使得在靠近面板附近的區域無法接收到影像,而導致無法互動。因此,如何達成 互動機制且同時又不增加整體系統的體積將會是開發立體互動顯示器必須要克 服的議題。本論文針對已提出的新式三維互動顯示器架構上,延伸討論互動的演 算方式與方法.新型三維互動顯示器主要特點為同時將面板的 TFT 與光感測器陣 列製作在同一塊玻璃機板上,因此不需要額外再裝置感應元件及可達到互動的功 能。由於光感測器元件是被植入在面板裡面,因此,靠近面板附近區域的影像能 夠被接收到,進而使得人機互動的工作範圍能夠延伸至靠近面板的區域,也可以 大大減少互動顯示器的體積。 在內植光感測器陣列的 2.83 吋面板架構下,利用外在光源(發散型光源) 做為此新型三維互動顯示器的互動裝置,且提出新的理論架構以及演算方式來計 算外在互動光源(使用者)在正向與斜向的三維空間座標資訊。最後,在硬體上 達到及時的影像擷取與運算。實際操作硬體的互動範圍大約在面板高度零公分到ii 四公分的距離,傾斜角度範圍從 0 度到 40 度。另外, 由於現有的小尺寸裸視 3D 立體顯示深度資訊大約在五公分的景深之內。因此,計算互動光源的空間三維座 標值在距離面板五公分高度和傾斜角 40 度以內的條件下,在小尺寸面板上的應 用是足夠的。未來,對於不同深度的 3D 影像,可以做到及時的位置計算並回傳 達到與立體影像互動的效果,真正落實 3D 互動的目標。不僅如此,在現今的 2D 觸碰面板上也可以增加與影像畫面互動的變化性。當互動光筆在距離面板不同的 高度或角度上變化時,對於影像的大小,形狀,方向都可以做到放大縮小或是旋 轉的效果,不再受限於只有觸碰到面板才能作互動的條件,增加互動的維度。
iii
Interactive Algorithm for 3-Dimentional Touch Panel
Student: Pi-Cheng Wu Advisor: Dr. Yi-Pai Huang Institute of Electro-Optical Engineering
National Chiao Tung University
Abstract
In order to achieve more natural 3D sensory images from displays, many studies have been devoted to 3D display technology developments. Furthermore, 3D interaction based on existing 3D display structure is a popular research topic. Most existing 3D interactive displays are composed of a 3D display and extra sensing components which increase interactive system volume. When 3D interactive displays use a camera as the sensing component, 3D interactive displays do not work in the region near the panel because of a limited capturing angle. Therefore, 3D interaction without increasing system volume is an important issue. In this thesis, according to a new structure of 3D interactive displays which proposed before, we developed a new algorithm and demonstrated it. The 3D interactive display is fabricated by combining TFTs with embedded optical sensors on the same glass. As a result, it‟s not need to extra tracking devices anymore and can do the interaction. By using an embedded optical sensors panel, the 3D interactive system can capture the image in the region near the panel. Consequently, the interactive range is widened to the region near panel and can reduce the whole interactive system volume.
In the experiment, we used extra light source as an interactive device on 2.83 interactive display panel. And proposed a new algorithm to detect the interactive
iv
device real (X,Y,Z) coordinate value. At last, we demonstrated it in hardware with real time demo. The interactive range was about 0cm~4cm and the inclined angle was about 0∘~40∘. Besides, the depth of current naked 3D display in small size panel is in 5cm range. Therefore, this interactive range is enough to apply to the small size touch panel applications. In the future, according to different depth of 3D images, a real time calculation can be achieved and feedback to system to realize the real interaction with 3D images. On the other hand, in 2D touch panel applications, it can improve the function of touch such as zooming image, rotating image and piling up the objects in image according to different input heights and inclined angles. Finally, the dimensional of interaction can be enhanced.
v
誌 謝
首先誠摯的感謝指導老師謝漢萍教授和黃乙白副教授,在這碩士兩年的求學 中對於研究態度及英文能力的教導,不僅提供豐富的資源與完善研究環境,使我 得以在碩士生涯提升了專業及英文的能力,並且順利完成此論文。此外,也感謝 各位口試委員所提供的寶貴意見,使本論文更加的完備。 在此特別感謝王國振學長對於論文的指導,其細心的指導方式,嚴謹的研究 態度,讓我不僅只在研究上的學習成長,更在做人處世上受益良多。此外我要感 謝友達光電諸位合作同仁提供我寶貴的意見及實作的協助,讓整個研究進展的更 順利。 在實驗室的日子裡,感謝有鄭榮安、林芳正、王國振、楊柏儒、陳均合、莊 喬舜、鄭裕國、許精益、蔡柏全、王奕智、廖凌堯、陳致維、張育誠、蔡韻竹等 博士班學長姐們提供各方面的指導與協助,也感謝宗瑋,宜如,佑禎,拓江,靖 堯,博文,俊賢,浩彣,宜伶,高銘,益興等學長姊們讓我的生活更加精彩。同 時感謝裕閔,毅翰,期竹,景文,耆賢,泳財,甫奕,姚順,怡菁,世勛等同學 們在課業、研究、生活上的幫助與分享,並伴我一起度過兩年碩士班的日子。我 也感謝實驗室的學弟妹們與助理小姐,感謝你/妳們的幫忙及讓實驗室充滿歡愉 的氣氛。 最後,對於我的家人與女朋友,我要感謝你們多年來的支持與鼓勵以及生活 上的細心照顧,使我能無後顧之憂的研究與學習,並順利完成碩士學位。這份喜 悅與榮耀我將跟所有我所認識的各位分享。vi
Table of Contents
Abstract (Chinese) ... i
Abstract (English) ... iii
Acknowledgement
...…………...………...………...v
Table of Contents ... vi
Chapter 1 ... 1
1.1 Preface ... 1
1.2 3D Interactive (Touch) Technology ... 2
1.3 3D Interactive (Touch) System Interface ... 3
1.4 Motivation and Objective ... 5
1.5 Organization of This Thesis ... 7
Chapter 2 ... 8
2.1 Interface and Algorithm of Conventional 3D Interactive Displays ... 8
2.1.1 Camera Type Interface and Algorithm ... 8
2.1.2 Extra Tracking Device Type Interface and Algorithm ... 14
2.1.3 Optical Sensor Type Interface and Algorithm ... 17
2.2 Summary of Conventional 3D Interactive Systems ... 20
Chapter 3 ... 22
3.1 3D Interactive Display with Embedded Optical Sensors ... 22
3.2 Extra Interactive Light Source (LED) ... 30
3.3 Theoretical Models & Mathematical equations ... 32
3.4 Algorithms for Novel 3D Interactive Display Using LED Light Pen with Cross Mark ... 36
Chapter 4 ... 39
4.1 Simulation Results of 3D Interactive Display Using LED ... 39
4.1.1 Simulation Results in Long Axis (Z position) ... 39
vii
4.1.3 Simulation Results for Both Axis ( X,Y position ) ... 44
4.2 System Tolerances of 3D Interactive Display Using LED light Pen ... 49
4.2.1 Impacts of Divergent Angle in Long Axis ... 50
4.2.2 Impacts of Divergent Angle in Short Axis ... 53
4.3 Summary ... 55
Chapter 5 ... 56
5.1 Experiments in Long Axis Analysis (
W
L) ... 585.2 Experiments in Short Axis Analysis ( ) ... 61
5.3 Resolution of Z(h) Height & Inclined Angle (θ ) ... 62
5.4 Experiments in (X,Y) calculation ... 65
5.5 Summary ... 66
Chapter 6 ... 68
6.1 Conclusions ... 68 6.2 Future Works ... 69References ... 73
viii
Figure Captions
Fig. 1- 1 3D display applications. (a) Auto-stereoscopic TV. (b) 3D projector display.
[2][3]. ... 1
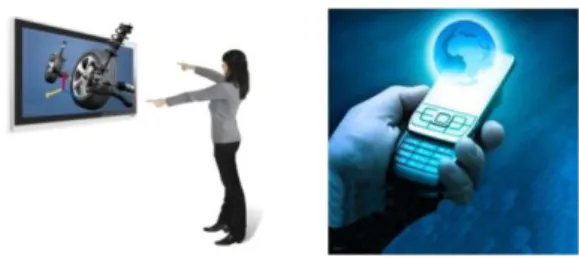
Fig. 1- 2 Example for 3D interactive display system. ... 2
Fig. 1- 3 Classification of 3D interactive interface. ... 3
Fig. 1- 4 Using Camera as sensing component. ... 4
Fig. 1- 5 Using optical sensors array as sensing components. ... 4
Fig. 1- 6 Machinery based 3D interactive interface. ... 5
Fig. 1- 7 Interactive video game system. ... 7
Fig. 1- 8 3D communication system. ... 7
Fig. 2- 1 Schematic overview of camera based 3D interactive system. ... 9
Fig. 2- 2 Algorithm for camera based interface. ... 10
Fig.2- 3 Experimental setup of Depth-sensing camera interactive surface. ... 11
Fig.2- 4 Hover space interactions. From left to right: Translation, rotation, and ... 11
Fig. 2- 5 Stereo image based segmentation. a) Depth image. b) Segmented body image. (c) Segmented hands image. ... 12
Fig. 2- 6 Color segmentation. Left: Sample color image . Middle: Color ... 12
Fig. 2- 7 Contour detection. Left: original image. Right: Contour detection image. ... 12 Fig. 2- 8 Connected component algorithm. Left: original image. Right: processed
ix
image [14]. ... 13
Fig. 2- 9 Region detection. Left: original image. Right: processed image ... 13
Fig. 2- 10 Schematic overview of extra tracking device type 3D interactive system. ... 15
Fig. 2- 11 Algorithm for extra tracking device type interface. ... 15
Fig. 2- 12 Prototype system. ... 16
Fig. 2- 13 Left: Applications. Right: Example for gestures. ... 16
Fig. 2- 14 Schematic overview of optical sensor type 3D interactive system. ... 18
Fig. 2- 15 Algorithm for optical sensor type interface ... 19
Fig. 2- 16 Real application of optical sensor type interface. (a) An appearance of prototype. (b) Structure of system. ... 19
Fig. 2- 17 3D interactive display. Left: Large size application. Right: Small size application ... 21
Fig. 3- 1 Cross section view of conventional LCD structure. ... 23
Fig. 3- 2 Cross section view of novel 3D interactive structure. ... 24
Fig. 3- 3 Barriers guide the left and right image pixels into different directions. ... 24
Fig. 3-4 Cross section view of proposed structure. ... 25
Fig. 3-5 Data mapping processes. ... 25
x
Fig. 3- 7 The relation between heights and disparities (Lighting mode). ... 28
Fig. 3-8 Light distributions of two groups of sensors over whole panel. ... 29
Fig. 3-9 The limitation of disparity method. ... 29
Fig. 3-10 LED movement in vertical direction. ... 30
Fig. 3- 11 Images captured by sensors (normal direction)... 30
Fig. 3- 12 Disparity method cannot be used when LED movement is in oblique direction. ... 31
Fig. 3- 13 LED with cross mark. (a) Cross mask fabrication. (b) Definition of two axes. ... 32
Fig. 3- 14 Theoretical model and parameters of Long axis. ... 33
Fig. 3- 15 Theoretical model and parameters of Short axis. ... 35
Fig. 3- 16 Flow chart of algorithm. ... 37
Fig. 4- 1 The simulation model in long axis.(a) The geometrical relation of long axis ( with other variables. (b) Long axis equation and its parameters. ... 41
Fig. 4-2 The relation of cross length ( , LED height (h), and incline angle theta(θ ) . ... 42
Fig. 4- 3 The simulation model in short axis.(a) The geometrical relation of short axis ( with other variables. (b) Short axis equation and its parameters. ... 43
xi
Fig. 4-5 The illustration of (X,Y) in image and (X‟,Y‟) in space ... 45 Fig. 4-6 The geometrical relation of (X,Y) and (X‟,Y‟). ... 46 Fig. 4-7 The equations and parameters with regard to (X,Y) displacement. ... 46 Fig. 4-8 LED azimuth angle (φ ). (a) φ =45° (b) φ =135° (c) φ =225° (d) φ =315° ... 46 Fig. 4-9 Simulation results of Δ X with different LED azimuth angles. (a) φ =45° ... 47 Fig. 4-10 Simulation results of Δ Y with different LED azimuth angles. (a) φ =45° . 48
Fig. 4-11 The relation between cross length (W) and LED divergent angle (Ѱ). ... 50
Fig. 4-12 Long axis: different divergent angle. (a) Ѱ=30° (b) Ѱ=50° (c) Ѱ=70° ... 52
Fig. 4-13 Short axis: different divergent angle. (a) Ѱ=30° (b) Ѱ=50° (c) Ѱ=70° ... 54
Fig. 5-1 The liquid crystals panel with embedded optical sensors. (a) Panel appearance. (b) Panel specification. ... 56 Fig. 5-2 Fabrication of LED with cross mark. (a) Appearance of LED light pen. (b) Parameters of cross mark on LED surface. ... 57 Fig. 5-3 Experimental setup on optical table and the definition of coordinate vector. 57 Fig. 5-4 Sensor capture software. ... 58 Fig. 5-5 The experimental setup with different equipments. ... 59 Fig. 5-6 The flow chart of de-background calibration. Above: Original LED images with different heights minus background image. Down: De-background images. ... 59
xii
Fig. 5-7 The relation of real LED height (h) and inclined angle (θ ) with cross length
(W) ... 60
Fig. 5-8 The flow chart of de-background calibration. Above: Original LED images with different heights minus background image. Down: De-background images. ... 61
Fig. 5-9 The relation of real LED height (h) and inclined angle (θ ) with cross length (W) ... 62
Fig. 5-10 The relation between real LED height (horizontal axis) and calculated height (vertical axis) ... 63
Fig. 5-11 The illustration of two different cross lengths (Δ W ) and two different inclined angles (Δ θ ) ... 65
Fig. 5-12 The relation between inclined angleθ and changes of cross lengths (Δ W). ... 65
Fig. 5-13 The relation between real LED (X,Y) and calculated height (X,Y). ... 66
Fig. 5-14 Results of cross-mark type. ... 67
Fig. 6-1 Comparison between non-directional and directional cross mark. ... 70
Fig. 6-2 Multi-interaction with different cross marks. (a) Light source with cross mark and the projected image. (b) Different cross mark on the light source surface. ... 71
1
Chapter 1
Introduction
1.1 Preface
The developments of display technology are motivated by rendering more natural image. Therefore, the next generation of display systems is thought to be auto-stereoscopic (3D) displays. 3D displays provide a new type of visual perception. This display introduces humans to real life images, because 3D images contain three-dimensional coordinate information [1]. Thus, people perceive a life-like image, as shown in Fig. 1-1(a) (b).
Fig. 1-1 3D display applications. (a) Auto-stereoscopic TV. (b) 3D projector display. [2][3].
Many 3D displays on the market provide 3D images but few have an interactive function. To create a more convenient human-computer interface (HCI), 3D
2
interactive display system is considered to be an essential part of future display systems [4][5]. Thus, 3D displays with 3D interactive function are potential candidates for future display systems.
1.2 3D Interactive (Touch) Technology
3D interactive display technologies are used as a human-computer interface (HCI) between human motions and 3D displays (Fig. 1-2) [6]. A 3D interactive interface can identify hand position or motion which does not contact with panel through software calculation in computer hardware. With this feature, 3D interactive systems can interact with 3D display images that contain three-dimensional coordinate (X,Y,Z) information. Conventional 2D touch panels are inadequate for interacting with 3D displays because 2D touch panels recognize only two coordinates. Therefore, 3D interactive technology can give the user‟s spatial hand coordinates to computer and provide feedback to the user. With this technology, humans can interact with 3D displays.
3
1.3 3D Interactive (Touch) System Interface
3D interaction can be designed in different ways [7-10]. Differing from 2D touch panels, 3D interactive display technologies can be classified into two types: Optical based [11-14], and Machinery based [15], as shown in Fig. 1-3. Optical based interactive interfaces use cameras, optical sensors array as sensing components; Machinery based interactive interfaces use glove or head-mounted component as an transmitters and receivers to do interaction.
Fig. 1-3 Classification of 3D interactive interface.
Optical Based
An optical based 3D interactive interface which use camera as an sensing component is shown in Fig. 1-4 [16]. The type use sensing camera and DNP
3D Interactive
Interface
Optical
Based
Camera
Sensor Array
Machinery
Based
Transmitter/
Receiver
4
holoscreen to sense user‟s depth information and display images. This characteristic offers users to do interaction with images using their bare hands. By analyzing captured images, hand 3D position can be detected and calculated. However, there are some issues in this system. The system volume is larger than a flat panel display because using camera behind display screen and projector to display images. Besides, it cannot work in the region near panel because of limited capturing.
Fig. 1-4 Using Camera as sensing component.
On the other hand, using optical sensors or infrared (IR) illumination [17,18] which allows us to both estimate the height of hands and to detect a simple pinch gesture in Fig. 1- 5. The advantage of this interface system is the whole interactive system structure volume is smaller than camera types. But it also has an important challenge which is theloss of „directness‟ when a user moves from interacting on the surface to the space above it.
5
Machinery Based
The Machinery based interface uses computerized clothing to recognize physical gestures (Fig. 1-6) [19]. Users wear particular computerized clothing to operate a computer and do interaction with images which perceived. After recognizing these gestures, feedback information is received by users. Finally, these Extra device based interfaces provide users a convenient human-computer interface (HCI). Although it provides users a convenient human-computer interface (HCI), it still has some issues. The system volume is also larger than a flat panel display, and the structure is more complicated. The most important issue of this system is it‟s inconvenient to use and is cumbersome.
Fig. 1-6 Machinery based 3D interactive interface.
1.4 Motivation and Objective
Interactive system volume is still a key issue to all kinds of interactive systems. Current interactive system volume is larger than a flat panel display. Owing to these conventional 3D interactive interfaces require extra sensing components such as
6
cameras, gloves, head-mounted device to achieve 3D interaction, so the volume is larger and bulky. Furthermore, when using camera as a sensing component, the system cannot work in the region near the panel because of limited capturing angle. As a result, volume and interactive range are key issues when developing 3D interaction technology. Despite these two issues, 2D or 3D display with interactive function also can be used in many applications, such as interactive game (Fig. 1-7) [20] and communication system (Fig. 1-8) [21].
Therefore, based on optical based interactive interface, a novel structure of 3D interactive display with embedded optical sensors was proposed [22]. This structure embedded optical sensors array in the panel to detect the user and added parallax barrier to display 3D image. Most important, it uses sensor‟s intensity disparity method to detect user‟s 3D position. As a result, it does not use any other tracking component anymore and can show 3D image simultaneously. Based on this novel structure, not only 3D interaction without increasing system volume but also the interactive region near panel can be detected. But this disparity method still had some issues and limitations such as it only can work when user‟s input is in vertical movement. With regard to this structure, we will discuss detail in Ch3. So, in this thesis, we propose a new algorithm to calculate the user‟s input 3D coordinates (X, Y, Z) value and its inclined angle (θ ) based on the structure of 3D interactive display with embedded optical sensors. Additionally, unlike current 3D interactive system, our proposed 3D interactive display system and algorithm can interact as 2D and 3D touch function at the same time.
7
Fig. 1-7 Interactive video game system.
Fig. 1-8 3D communication system.
1.5 Organization of This Thesis
The organization of this thesis is as following: some existing technologies are illustrated in Chapter 2. In addition, the drawbacks of existing technologies are also discussed. In Chapter 3, the structure and algorithm of 3D interactive display with embedded optical sensors using LED light source are presented. After that, the simulation results are discussed in Chapter 4 and the experimental results are discussed in Chapter 5. Finally, the conclusions and future works are in Chapter 6.
8
Chapter 2
Prior Arts of 3D Interactive Systems
Several representative technologies of 3D interactive system will be reviewed and illustrated. The configurations, algorithms, and issues for each technology will be described in detail.
2.1 Interface and Algorithm of Conventional 3D Interactive Displays
Based on optical based and machinery based of main 3D interactive interfaces we mentioned before, we can divide these into three parts: Using camera, extra tracking device and optical sensors. These three technologies have the same merit; 3D interactive displays can be developed by combining 3D/2D interactive (touch) systems and displays. Therefore, depending on the application, these three interfaces are used in different fields.
The algorithm for 3D interactive systems depends on their structures. Algorithms for camera type and optical type interfaces are based on digital image processing. However, algorithm for extra device type interface is based on a machine language. Therefore, there are differences in algorithm on these three interfaces
2.1.1 Camera Type Interface and Algorithm
A camera type interactive interface is developed by using one or more cameras and projectors to track user‟s position and motion. A schematic overview of the camera type 3D interactive system is shown in Fig. 2-1[27]. When users wave their hand in a range of interactive system, the camera captures these images and feedback
9
to computer. Continuously captured images are treated as video. Then, this video is analyzed to identify hand and gesture data using a hand tracking unit. After obtaining these data, the content generation unit generates images. Finally, the visualization unit produces content for display. Virtual reality interaction is completed when the processed content is displayed. Thus, users can interact with what they see or perceive by using their bare hands just like interacting with real objects. This characteristic offers a more convenient interface to users which can operate a computer without any other device. For this reason, main applications for camera based interfaces are entertainment, communication, and remote control.
10
The algorithm for camera type interface is illustrated in Fig. 2-2[30]. First, user‟s hand image is captured by the multi-cameras. Second, the region of interest and (2D +depth) information are obtained from these two image difference. Third, 3D position (X,Y,Z) and direction of hand are determined by digital image processing to these stereo information. Then, hand posture and position can be recognized. Finally, these postures and motions data are put into the application. Additionally, in the second and third steps, hand position is variously identified.
Fig. 2-2 Algorithm for camera based interface.
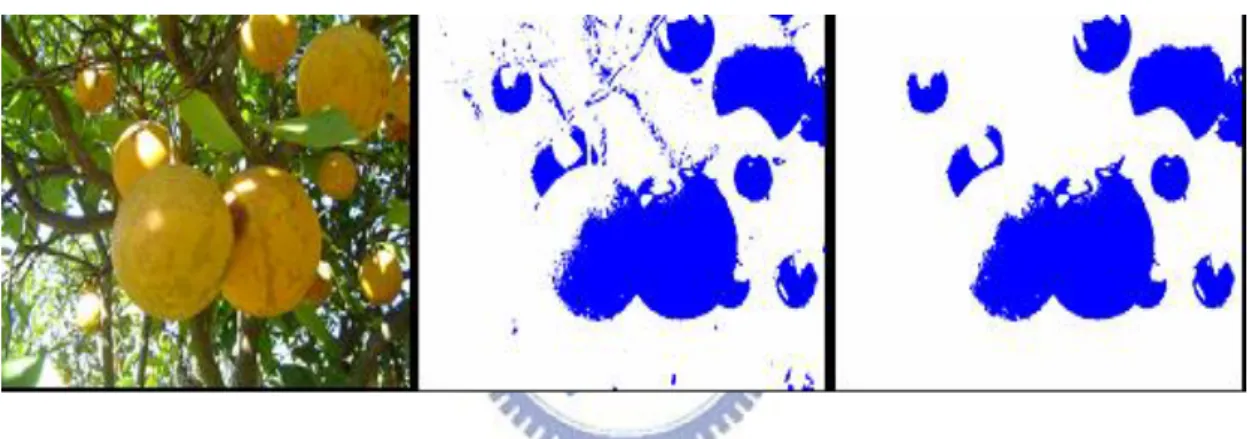
To verify hand position and posture requires extracting hand position from a vast amount of data (Fig.2-3, Fig.2-4) [31]. Typical hand segmentation techniques are based on stereo information, color, contour detection, connected component algorithms, and image differencing.
11
Fig.2-3 Experimental setup of depth-sensing camera interactive surface.
Fig.2-4 Hover space interactions. From left to right: Translation, rotation, and
depth motion.
Each technique has its specific features:
Stereo image based segmentation is accomplished by analyzing relative depth
information between the hands and body in an image, as shown in Fig. 2-5.
Color segmentation uses color as an index to separate target object from the
background, as shown in Fig. 2-6[32].
Contour detection is accomplished by detecting a shaped object in the captured
image, as shown in Fig. 2-7 [33].
Connected component algorithms scan an image and groups its pixels into
components based on pixel connectivity, as shown in Fig. 2-8
Region detection the semantic region detection can be based on color-based
12
Fig. 2-5 Stereo image based segmentation. a) Depth image. b) Segmented body image.
(c) Segmented hands image.
Fig. 2-6 Color segmentation. Left: Sample color image . Middle: Color segmentation image. Right: Labeling and size filtering.
13
Fig. 2-8 Connected component algorithm. Left: original image. Right: processed
image [47].
Fig. 2-9 Region detection. Left: original image. Right: processed image
Although these methods are able to identify object (hand) position and depth information, there are still disadvantages for each technique:
Stereo image based segmentation requires a hardware setup that is currently
only found in laboratories.
Color segmentation is sensitive to changes in overall illumination. In addition,
it is prone to segmentation errors caused by objects with similar colors in the image.
14
stability is obtained by using a contour model and post-processing.
Connected component algorithms tend to be heavy in computational
requirements, making it impossible to search through the whole image in real-time.
Region detection generally work well for regions which separated much clearly.
Besides, the shape and the contour of target object must be sufficient different and contrast compares to the rest of region in image.
As a result, an camera type interface takes several steps to obtain the required data. The most important advantage is the accuracy of detection including depth information and angular detection. On the other hand, the interactive volume is still larger and the interactive range close to panel will be limited due to capture angle.
2.1.2 Extra Tracking Device Type Interface and Algorithm
An extra tracking device type interface is developed by combining computerized clothing with a receiver. The schematic overview is shown in Fig. 2-10[28]. Before users operate a computer, users have to wear specialized components such as a remote control or a data glove to transmit gesture information to the receiver. These components are hand and gesture driven. The interactive unit recognizes these gestures by checking pre-saved image data. After recognizing gestures, the image content generation unit generates images. Finally, the visualization unit produces content for display. Thus, humans can experience events that cannot be perceived in the real world. The main applications for extra device based interface are medical treatments and physical training. In these applications, users need feedback to operate computer more precisely.
The algorithm for extra tracking device type interface is illustrated in Fig. 2-11, [34] [35], and some applications as shown in Fig. 2-12, Fig. 2-13[36]. Because users
15
have to wear particular computerized clothing (glove) to operate the computer and do interaction, hand postures can be identified through computerized clothing and the data base system established. Then gestures can be put into applications.
Fig. 2-10 Schematic overview of extra tracking device type 3D interactive system.
16
Fig. 2-12 Prototype system.
17
Because using extra device such as gloves or color markers, and the interactive system memorized most of motions and postures in its data base before. When users do some interaction with these sensing components, the image or video reaction will be motivated at the same time. Compares to camera type interactive type, this system interaction and operation process is easier and more accurate. On the other hand, it still has some disadvantages such as bulky, inconvenient, and impractical. As a result, following is an optical type which user is more convenient and direct to use.
2.1.3 Optical Sensor Type Interface and Algorithm
An optical sensor type interactive interface is developed by using one or more optical sensing components such as optical sensors, IR emitters, IR receivers and so on. The schematic overview is shown in Fig. 2-14[29]. The most different and characteristic of this type compares to the other two types is using optical sensing devices which embedded in the display / touch panel. As a result, the whole interactive system volume will be smaller than the other two types. Because of without using other extra device as an input device or adding camera to track user, it‟s more convenient to do interaction by intuition.
The algorithm for optical sensor type is shown in Fig. 2-15[37] , and a real case applications in Fig. 2-16[38]. First, image is captured by optical sensor. Second, through the advanced image processing method to get the image information we want to know. At last, the information from user in real world can be obtained. Some processing skills are same as camera based interface we mentioned before. The most different part is the tracking device (Photo-sensor, COMS image sensor, IR receiver,
18
etc [40].) is embedded in the interactive panel that the whole interface volume will not as large as camera type or extra device type interface. Moreover, we do not need to wear any other tracking components to let system know where we are or what kind of postures we interact. Above all, it‟s simplest, most convenient and direct to do interaction in the type of optical interface. On the other hand, because the change of user‟s shape (finger or light pen) which captured by optical sensors is not regular or linear when user‟s position changes. As a result, this type only can detect the change of vertical movements above the panel.
19
pc
3D Display
3D touch panel
Sensor Barrier
Fig. 2-15 Algorithm for optical sensor type interface.
(a) (b)
Fig. 2-16 Real application of optical sensor type interface. (a) An appearance of
20
According to the structural description of these three interfaces, the interactive system volume issue and the sensitivity near the panel are common to all these types. Despite that the structure of camera and extra device types are much more complicated than optical type, camera and extra device type interfaces can offer users a precise operating interface. However, optical sensor type interface can allow users to interact with what they perceive by using their bare hands or light pens directly and without any extra tracking components installation on interactive system. The differences in structure also result in differences in algorithm.
As a result, Algorithm differences between these three interfaces result from structural differences. A camera type interface and extra tracking device type interfaces have much more complicated structures which helps reduce algorithm complexity. An optical sensor interface has a much more complicated algorithm which helps reduce structural complexity. As a result, there is a tradeoff between algorithm complexity and structure.
2.2 Summary of Conventional 3D Interactive Systems
Current algorithms in conventional 3D interactive displays depend on system structures. A simpler structure such as optical sensor type requires a more complicated algorithm to identify hand position, hand posture and depth or theta(θ ) information. A more complicated structure requires a simpler algorithm just like camera type or extra device type interface. Therefore, a 3D interactive display system is still unable to have a simple structure and a simple algorithm simultaneously. Besides, 3D interactive display volume is larger than a conventional flat panel display. It‟s a drawback and inconvenient for consumer applications. Current display development
21
toward being thinner, lighter and can save more energy. 3D displays which provide 2D/3D interactive (touch) function and maintain their volume (as shown in Fig. 2-17). In this thesis, based on 3D interactive display system with embedded optical sensors which proposed by our group in recent years, my objective is to calculate user‟s input (LED light source) spatial 3D coordinate value (X,Y,Z) and it‟s inclined angle(θ ), then further realize real-time demo. The volume and structure of 3D interactive display system is the same as a conventional LCD display. Due to the prior research cannot detect the inclined direction (θ ) , so we propose a new algorithm to keep the simplicity of the optical sensor interface and calculate the user‟s input (X,Y,Z,θ ) value at the same time.
Current depth information provided for 3D displays is only a few centimeters in height, which is very close to 3D panels. The interactive range for 3D interactive systems using a camera as a sensing component cannot be applied to the region near panels because of a limited capturing angle. In this thesis, an embedded optical sensor panel captures the image in the region near the 3D panel, which helps overcome the interactive range issue. In addition, user‟s input (LED) in rotated angle or inclined direction cannot be detected in the past. From this thesis, not only a new algorithm was proposed to solve the (θ ) detection issue, but also the 3D (X,Y,Z) value, depth resolution, and angular resolution will be improved. Finally, the real time demo in hardware will be demonstrated.
Fig. 2-17 3D interactive display. Left: Large size application. Right: Small size
22
Chapter 3
Novel 3D Interactive Display
This thesis is still based on novel 3D interactive display with embedded optical sensors which proposed in recent years. In order to overcome interactive volume issue and the sensitivity in the range of near panel especially in inclined direction detection (θ ) , we proposed new theoretical models and a improved algorithm to realize the real calculation of user‟s (X,Y,Z,θ ) information. In other words, no matter what user moves in vertical direction(θ =0) or inclined direction(θ >0), the optical sensors can calculate the real (X,Y,Z,θ ) value of user coordinate. Therefore, not only keep the interactive volume small and the sensitivity close to panel, but also improve the detection of user from (X,Y,Z.) to (X,Y,Z,θ ).
3.1 3D Interactive Display with Embedded Optical Sensors
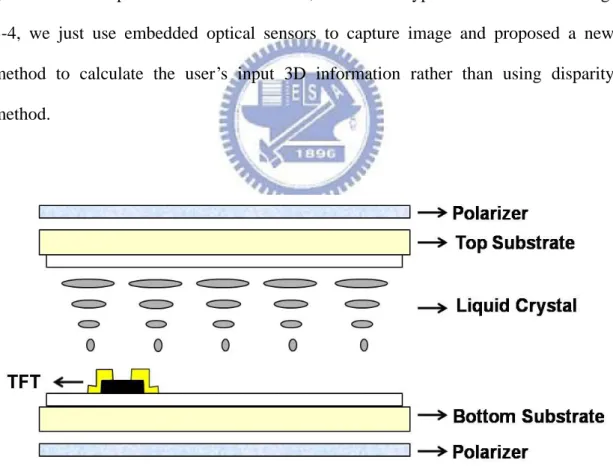
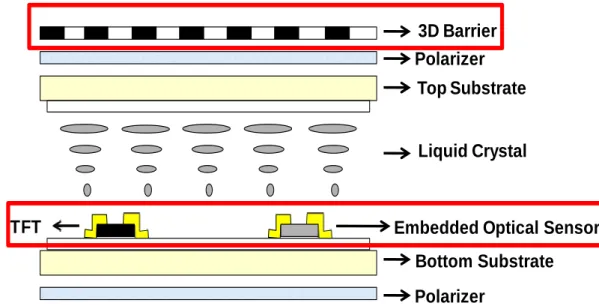
Besides the grating barrier which common used in 3D display technology, the novel of 3D interactive display was proposed by using embedded optical sensor array which fabricated with TFTs on the same glass in the same process. The cross section view of conventional LCD panel display is shown in Fig. 3-1 and the cross section view of novel structure is shown in Fig. 3-2. More than a display, there are 3D grating barrier and embedded optical sensor in the novel structure. The panel structure is the same as 3D display panel presently but adding optical sensors array. On the other hand, optical sensor was fabricated with TFTs on the same glass replaces the Si substrate. In other words, we do not need to install any other tracking sensor outside the panel in this novel 3D interactive type. After adhering barriers to 2D display panel
23
and embedding photo-sensors, 3D display function and interactive function are completed. Barriers block half pixel from ambient light so that sensors receive different light intensities. In interactive system, barriers not only guide the left and right image pixels into different directions (Fig. 3-3[41]), but also guide ambient light to be received by different sensors. By analyzing light distribution obtained from sensors, hand position can be identified without touching panel.
But in this thesis, we removed the 3D parallax barrier to do simulation and experiment because we do not use the disparity method which means calculating the disparity of maximum intensity between left /right sensors. And this disparity result is guided from 3D parallax barrier. Therefore, in our new type which is shown in Fig. 3-4, we just use embedded optical sensors to capture image and proposed a new method to calculate the user‟s input 3D information rather than using disparity method.
24
3D Barrier Polarizer
Top Substrate
Liquid Crystal
Embedded Optical Sensor Bottom Substrate Polarizer
TFT
Fig. 3-2 Cross section view of novel 3D interactive structure.
25
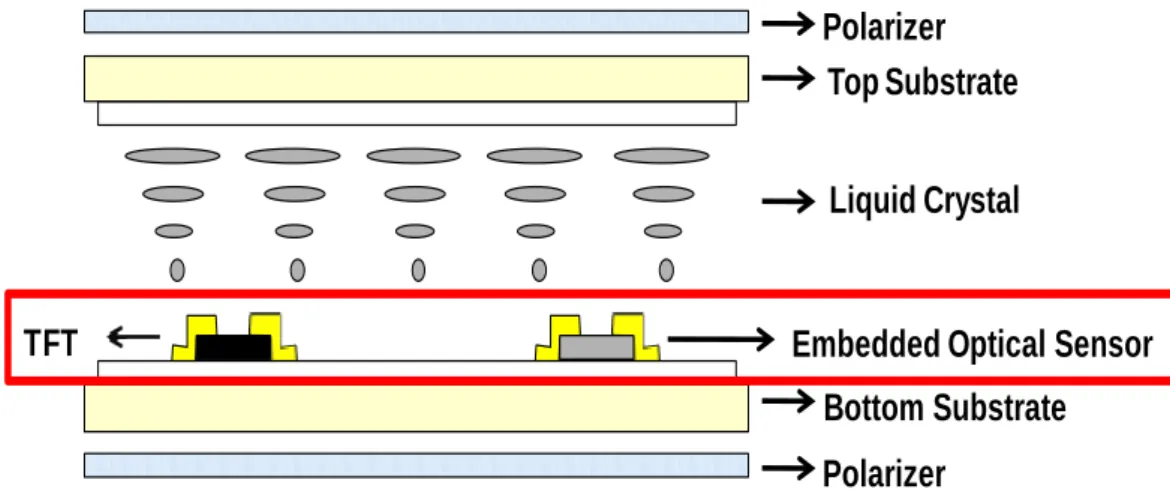
Fig. 3-4 Cross section view of proposed structure.
When humans wave their hands in front of the panel, ambient light is partially blocked. Light distribution on the panel is recorded by optical sensors. This light distribution data is mapped to a 10 bits data. Mapping processes are illustrated in Fig. 3-5. First, optical sensors turn received ambient light illumination into leakage currents. Second, these currents are mapped to voltages. Finally, these voltages are divided into a 10 bits data. Ambient light distribution can be identified by analyzing 10 bits data. A 10 bits data provides more precise hand identification.
Fig. 3-5 Data mapping processes.
Besides, in this novel 3D interactive panel, we embedded four optical sensors in one pixel to enhance the useful signal we want to process. Therefore, with high
Polarizer Top Substrate
Liquid Crystal
Embedded Optical Sensor Bottom Substrate Polarizer
26
density of optical sensors and 10 bits data quantity per pixel, we can improve the accuracy of algorithm we applied. Above all, there are some advantages in this novel 3D interactive display structure: First, the fabrication cost can be decreased because optical sensors and TFTs were in same process. Second, the whole interactive volume will be smaller due to no extra sensing components. Third, the interactive sensitivity close to panel will not be limited because using embedded optical sensors. At last, conclude all the merits, the interactive (touch) panel value will be enhanced.
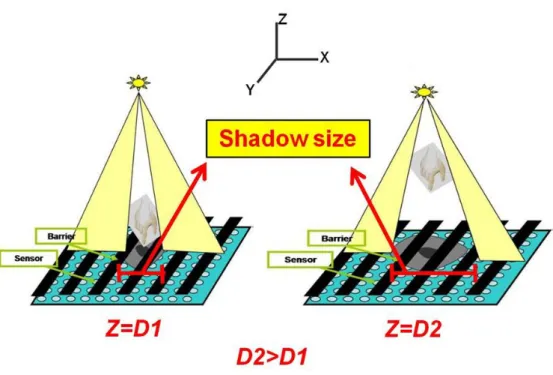
In the past, based on this novel 3D interactive display type, disparity method and shadow size method were proposed to calculate user‟s input (finger/light pen) 3D (X,Y,Z) value. These two methods were applied to two parts: one is lighting mode which use light source as a user‟s input as shown in Fig. 3-6(a); another one is blocking mode which use finger as a user‟s input as shown in Fig. 3-6(b).In lighting mode, disparity method shows that when user‟s input increases the height (Z), the distance between maximum intensity peak of left and right sensors (disparity) will increase. The result is also shown in Fig. 3-7and the light distribution of two groups of sensors (left/right) over whole panel is shown in Fig. 3-8. Although we can calculate the corresponding Z value from the disparity between two group of sensors (left/right), it still had some issues and limitations. The most part of limitation is it cannot work when user is in inclined direction (θ ) as shown in Fig. 3-9. If user is in inclined direction, the disparity method cannot be used due to the relation between disparity and the user‟s height (Z-position) is irregular and not linear. As a result, if we want to obtain the user‟s (X,Y,Z,θ ), we should find another way to calculate it.
In this thesis, we still focus on lighting mode which use extra interactive light source (LED) as an interactive device. Compares to the research of this novel 3D interactive display in the past [42], we proposed a new algorithm to improve some
27 R L L R L R L R L R L R L R L R R L R L R L R L
Z=0
Z=d
L-sensor image R-sensor image L-sensor image
B/W barrier
L/R sensor source
Disparity
issues with regard to the interaction limitation. Disparity method is not good enough to realize the detection when LED light source in inclined angle. The reason is left sensor is possible to capture the right sensor‟s information; Likewise, the right sensor will capture the information of left sensor as well. As a result, the disparity between two intensity peaks of left and right sensor cannot be determined. Not only improved interaction of this novel structure, but also implemented 3D interactive display with embedded optical sensors in real time demo. In the following, the fabrication, mathematical model, and the algorithm for this optimized lighting mode will be discussed.
28
(b) Schematic of shadow size method using in blocking mode.
29 Sensor Barrier
Z
Y
X
Sensor BarrierZ
Y
X
Experimental condition Real case
????
Fig. 3-8 Light distributions of two groups of sensors over whole panel.
Fig. 3-9 The limitation of disparity method.
30
Y
X
Z
3.2 Extra Interactive Light Source (LED)
In this novel 3D interactive display with a grating barrier, the interactive light source (LED) position can only be detected in vertical direction above the panel as shown in Fig. 3-10 and the images captured by optical sensors were shown in Fig. 3-11. The value of height Z is obtained by disparity method. However, when position is in inclined angle (θ) or oblique direction (Fig. 3-12), the changes of light shape and the relation between height (Z) and disparity of sensors will not be regular anymore. As a result, LED Z (height) coordinate with inclined angle (θ ) cannot be calculated easily. Consequently, a new algorithm was proposed to improve this interaction limitation. Therefore, LED (X,Y,Z) position can be detected and calculated in inclined angle(θ) and or oblique direction.
Fig. 3-10 LED movement in vertical direction.
31
Fig. 3-12 Disparity method cannot be used when LED movement is in oblique direction.
Depend on disparity method is not enough to calculate the LED (X,Y,Zθ ), then a new algorithm was proposed to solve the issue regarding the detection of inclined direction. Besides, owing to disparity method cannot satisfy our need, then grating barrier was removed and we only focus on the image signal which captured by optical sensors. When LED is in inclined angle (θ ), the LED light shape and profile in image captured by optical sensors will not be symmetrical and linear with different heights (Z). As a result, we cannot deduce the corresponding height easily. Consequently, we proposed to add some mark or mask on the surface of LED light pen as a reference. It means we can derive the relation between different (X,Y,Z,θ ) with different changes of mark size or length. Then, LED (X,Y,Z,θ ) information can be obtained.
At first, a cross mark is fabricated on the LED surface. Each length of cross on LED surface is equal as shown in Fig. 3- 13(a). When LED light source is in inclined angle and change height gradually, the cross length in images which captured by optical sensor will have two different lengths as shown in Fig. 3- 13(b): One is long axis (
L
32
according to the length in projected image. This result is anticipated by intuition. After fabricated a cross mark, the length of each axis in image captured by optical sensor will not be equal when LED moves along in inclined direction and different angles (θ ). As a result, one axis will be longer than the other one just like ellipse. Because this perpendicular cross had corresponding lengths variation in captured images when LED in different heights (h) or inclined angles (θ ). Consequently, according to the change of cross length (
W
L&
W
S) in captured image, the relation of LED height (h) and inclined angle (θ ) can be obtained by simple triangle calculation.(a) (b)
Fig. 3- 13 LED with cross mark. (a) Cross mask fabrication. (b) Definition of two axes.
3.3 Theoretical Models & Mathematical equations
To improve the detection of LED light source 3D (X, Y, Z) in oblique angle, cross mark is fabricated and stuck on the LED surface as a reference mark. As mentioned before, we can get two different information (Long axis & Short axis) separately regarding the relations of LED heights (h), inclined angles (θ ), and cross
33
length (W). In this optimized lighting mode, theoretical models and mathematical equations had been derived according to the parameters we defined respectively. Then, proposed algorithm will be discussed based on the theoretical models. Moreover, some simulations and experiments had been done. At last, the whole system will be demonstrated using real time demo.
3.3.1 Long Axis (
W
L)
By the way of algebra and triangle calculation, theoretical model of cross length (
W
L) in captured image with respect to parameters and equations was derived as shown in Fig. 3-14. 2x is the original length of cross on the LED surface,W
L is the length of axis in captured image, θ is an inclined angle between LED position and normal direction, Ѱ is a divergent angle (0°<Ψ<90°) of LED light source and h is theLED height (Z position).
34
From the illustration in Fig. 3-14, these parameters relation is represented in equation (1).
According to theoretical model and equation (1), cross length (
L
W
) variation in image is assumed be proportionally linear to LED height (h). Besides, when inclined angle theta (θ) increases,W
L also increases. Base on this theoretical model, when LED is in one position (X, Y, Z, θ), after capturing image by optical sensor, cross length (W
L) can be obtained by mathematical equation (1) and then reverse to fit database which established from these parameters
(
W
,
h
,
2
x
,
,
)
L . The database
and algorithm will be discussed in next section. As a result, the h (height, Z) value can be calculated. In the meantime, LED (X, Y) coordinate also can be calculated from intersection of two axes. At last, LED (X, Y, Z) coordinate can be calculated at the same time even though LED is in inclined direction.
3.3.2 Short Axis (
W
S)
As same as long axis, the geometrical graph of short axis (
W
S ) is also shown in Fig. 3-15. 2x is the original length of cross on the LED surface,W
S is the length of axis in captured image, θ is an inclined angle between LED position and normal direction, ψ is a divergent angle (0°<Ψ<90°) of LED light source and h is the LEDheight (Z position). After simple triangle calculation, the mathematical equation of
(1)
cos
2
tan
sin
θ
x
θ )
( ψ
x
h
W
L
35
(2)
)
cot
sec
(
2
h
x
W
S
x
2
h
SW
2x = Cross length (LED)
= Cross length (image)
θ = Inclined angle (degree)
h = Height
ψ= Divergent angle (degree)
S
W
short axis is shown in equation (2)
Fig. 3-15 Theoretical model and related parameters in Short axis.
Like the process of long axis, after optical sensor capturing LED image, the cross length (
W
S) can be extracted from image to fit the database established from these parameters(
W
S,
h
,
2
x
,
,
)
in equation (2). Therefore, the responding h (height Z) value also can be obtained simultaneously. Otherwise, the method of (X, Y) calculation is same as long axis.36
3.4 Algorithms for Novel 3D Interactive Display Using LED Light
Pen with Cross Mark
For the purpose of detecting LED 3D position (X, Y, Z) in inclined direction, cross mark was proposed and fabricated on the LED surface as a reference to distinguish the changes of heights (Z) and inclined angles (θ).Besides, the theoretical models and equations of each cross variation in image were derived. As a result, the flow chart of this new algorithm is shown in Fig. 3-16
First, the perpendicular cross mark is stuck on the LED surface and each length is equal (2x). Second, before capturing the image of real LED position (X, Y, Z), we capture the background image in order to do calibration. And this step is must be done beforehand when the interaction surrounding is changed. Third, the purpose of calibration is to subtract the background image and reduce the noise that the information we want to process is enhanced. After calibration, when we extract the most important information of image, the long axis length or short axis length can be decided through the basic image processing. On the other hand, no matter what long axis length (
L
W
) or short axis length (W
S), the real length in images will not as same as theoretical models. The reason is when LED image is captured; the contrast ratio of gray level between lighting area and blocking area (cross mark line) is not higher enough. Consequently, we have to determine a threshold of gray level to decide the range of length which is close to the theoretical models and equations. As a result , the cross length (L
W
,W
S ) is calculated. After that is the most important step which is the establishment of the database (Look-up Table) and fitting. According to the mathematical equations (1) (2) we derived, the database is composed of37
LED with cross mark
Capture background
Calibration
(De-background)
LUT
(2x W h θ Ѱ)
Interaction (Lighting)
(Image processing)LED 3D coordinate
-
=(fitting)
(X,Y,Z(h),θ)
)
,
(
W
LW
Scan be reversed to database and fit to a appropriate similar h (height Z) value. Finally,
the corresponding height (h) information is calculated and (X, Y) as well.
Fig. 3-16 Flow chart of algorithm.
3.5 Summary
The proposed algorithm for the 3D interactive display with embedded optical sensors depend on the original cross length (2x) on the LED surface and the LED divergent angle (Ѱ). When the original cross length and LED divergent angle is decided, the database (Look-up Table) is decided. On the other hand, the panel size is also a key issue. When LED height (h) or angle (θ) increases, if interactive panel
38
cannot capture all the profile which LED light source projects on the panel, that the algorithm cannot work and appear error. In addition, the geometrical relation of parameters with regard to each cross can be analytically described by mathematical equations. Thus the algorithm for the 3D interactive display can be interpreted further by this mathematical model.
A panel with embedded optical sensors solved volume and interactive range issues. Moreover, an optimized algorithm for 3D interactive display in the lighting mode was developed based on interactive panel structure. Theoretical models and mathematical equations were also developed to further interpret the algorithm. In the following, the novel 3D interactive display panel and algorithm were applied simulations and experiments to verify the proposed structure. At last, the real time demo will be realized.
39
Chapter 4
Simulation for 3D Interactive Display
To verify the proposed theoretical models and algorithm using in 3D interactive display, simulations were proceeded. In the simulation results, the 3D interactive display which used LED light pen with cross mark were verified in long and short axis separately. Furthermore, system tolerances and limitations were analyzed and discussed in detail to assure experiments.
4.1 Simulation Results of 3D Interactive Display Using LED
At the beginning of Simulation, the specification of panel and some parameters of LED light pen we used including the length of cross mark on LED surface, the divergent angle, were built in the simulation software (Matlab). From the theoretical models and mathematical equations we derived before in ch3, we know that the independent variables in both two axes (long axis & short axis) are (2x,h,θ , Ѱ); And
the dependent variables is (
L
W
) or (W
S). In the following, these variables will be substituted in both long and short axes equation individually according to the specification of LED we used. After that, we will further analyze the relation of these parameters and their significance.4.1.1 Simulation Results in Long Axis (Z position)
40 L
W
h
x 22x = Cross length (LED surface)
W = Cross length (image)
θ = LED inclined angle
h = LED Height
ψ= LED Divergent angle
C : Depend on ψ & θ
mark was used as an input device. When LED light pen is above the panel, the image which project from LED light pen will like ellipse as shown in Fig. 4-1. The divergent angle (Ѱ) of LED we used is 70.31°, and the cross length (2x) on LED surface is 0.7cm. The interactive range (height) we set was 1cm<h<5cm. Because the panel size is about 2.83 inch which is suitable for small size application, so this sensing range is workable. Due to the geometrical relation of inclined angle (θ ) with divergent angle (Ѱ), the changes of long axis were divided into three parts to derived, as shown in Fig. 4-1 (b).After substituted these variables into equations (1) in three parts, individually, the results were shown in Fig. 4-2.When LED height (h) increases, cross length (
W
L) proportionally linear increases as well. Besides, with increasing theta (θ), the slope of curve also increases. Simulation result was consistent with proposed theoretical models which axis length in image was linearly proportional to LED height. According todifferent thetas (θ) and corresponding cross length (
W
L), LED Z position (height) can be obtained.
41
(b)
Fig. 4-1 Simulation model in long axis.(a) Geometrical relation of long axis (
W
L)with parameters. (b) Long axis equation and its variables .
(a) θ < 20°
20
if
)
180
(
cot
)
sin
(
20
if
0
20
if
)
(
cot
)
sin
(
cos
2
tan
x
h
C
C
x
h
C
C
θ
x
θ )
( ψ
h
W
L42
(b) θ = 20°
(b) 20°<θ<50°
43
S
W
h
4.1.2 Simulation Results in Short Axis (Z position)
Likewise, when LED light pen is above the panel, the image which project from LED light pen will like ellipse as shown in Fig. 4-3. The divergent angle (Ѱ) of LED,
the cross length (2x) on LED surface and other dependent variables are the same with long axis. After substituted this variables into equation (2), the result of is shown in Fig. 4-4. When LED height (h) increases, cross length (
W
S) proportionally linear increases as well. Besides, with increasing theta (θ), the slope of curve also increases. Simulation result was similar with long axis and it also proved that axis length (W) in image was linearly proportional to LED height (h). According to different thetas (θ)and corresponding cross length (
W
S), LED Z position (height) can be obtained.(a) (b)
Fig. 4-3 The simulation model in short axis.(a) The geometrical relation of short axis
(
W
S) with other variables. (b) Short axis equation and its parameters.(2)
cot
sec
2
(h
θ
ψ
x)
W
S
44
Fig. 4-4 The relation of cross length (
W
S), height (h), and inclined angle (θ ) .4.1.3 Simulation Results for Both Axis ( X,Y position )
According to the relation of dependent variables (2x,θ , Ѱ,h) with independent
variable (W), LED light pen Z position (height) can be obtained. On the other hand, (X,Y) coordinate is depend on the intersection of long axis and short axis in image. Even though the intersection point can be found from captured image, but the real (X‟,Y‟) coordinate value of LED in space is not equal to the intersection point (X,Y) in image as shown in Fig. 4-5. As a result, according to the geometrical and triangle relation, the transformation from (X,Y) to ( X‟,Y‟) was derived as shown in Fig. 4-6 and the equations are shown in Fig. 4-7. From equations (3)(4)(5), we can realize that LED inclined angle (θ ), LED height (h), and the azimuth angle(φ ) of LED will affect the quantity of displacement(Δ (X,Y) ). The definition of LED azimuth angle
45
( X,Y )
( X’,Y’ )
LW
SW
(φ ) is illustrated in Fig. 4-8. As same as the condition of Z position, the simulation results of Δ X and Δ Y were shown in Fig. 4-9 and Fig. 4-10. Both simulation results show that if LED height (h) and inclined angle (θ )increase, the correction value (Δ X orΔ Y) will increase; Besides, when inclined angle (θ ) increases, the absolute of slope will also increase. That meansΔ (X,Y) value will be larger in large inclined angle than in small inclined angle. The most important of all, the direction and the quantity of Δ X orΔ Y will be determined by the azimuth angle φ .When LED light pen was in different direction, the azimuth angle will be different. As a result, the direction of correction value will be determined by the angle of azimuth (φ ), and the range of φ is between 0° and 360°.
46 h θ φ X Y Z Δ (X,Y) = h*tanθ (X,Y) (X’,Y’) h φ φ φ φ Y X LED Pen
Fig. 4-6 The geometrical relation of (X,Y) and (X‟,Y‟).
Fig. 4-7 The equations and parameters with regard to (X,Y) displacement.
(a) (b) (c) (d)
Fig. 4-8 LED azimuth angles (φ ). (a) φ =45° (b) φ =135° (c) φ =225° (d) φ =315
°
(5)
sin
)
tan
(
(4)
cos
)
tan
(
(3)
tan
)
,
(
h
Y
h
X
h
Y
X
47
(a) (b)
(c) (d)
Fig. 4-9 Simulation results of Δ X with different LED azimuth angles. (a) φ =45°
48
(a) (b)
(c) (d)
Fig. 4-10 Simulation results of Δ Y with different LED azimuth angles. (a) φ =45°
(b)φ =135° (c) φ =225° (d) φ =315°
According to the simulation results (Z(h),θ ) and the correction value (Δ X,Δ Y) given above, we can conclude that in (X,Y) calculation : The correction value (Δ X & Δ Y) is proportionally linear to LED Z position and gradually increased when inclined angle (θ ) increases. Furthermore, the direction of (Δ X,Δ Y) is depend on the azimuth angle φ . In addition, even though θ ≠0° and two cross length was not perpendicular in images, the result would not be affected. Consequently, after
![Fig. 2-8 Connected component algorithm. Left: original image. Right: processed image [47]](https://thumb-ap.123doks.com/thumbv2/9libinfo/8063349.163072/27.892.140.760.131.372/connected-component-algorithm-left-original-image-right-processed.webp)