國
立
交
通
大
學
經營管理研究所
碩
士
論
文
併購研究: 擴散與主要趨勢
Mergers and Acquisitions: Dissemination and Main
Trends
研 究 生:游懿欣
指導教授:楊 千 教授
併購研究: 擴散與主要趨勢
Mergers and Acquisitions: Dissemination and Main
Trends
研 究 生:游懿欣
Student:Yi-Hsin Yu
指導教授:楊千教授 Advisor:Chyan Yang
國 立 交 通 大 學
經 營 管 理 研 究 所
碩 士 論 文
A Thesis
Submitted to Institute of Business and Management
College of Management
National Chiao Tung University
in Partial Fulfillment of the Requirements
for the Degree of
Master of Business Administration
June 2008
Taipei, Taiwan, Republic of China
併購研究: 擴散與主要趨勢
研究生:游懿欣 指導教授:楊千教授
國立交通大學經營管理研究所 碩士班
摘
要
併購(M&As)在近三十年來,隨著企業發展全球化,漸漸成為了各公司
執行長為擴大營運或多角化等因素,所行使的主要策略。然而隨著併購的
成功與失敗,使得併購策略成為了管理領域中的主要議題。本研究透過歸
納式與量化的文獻計量法來探索併購研究的知識發展結構
本 研 究 主 要 以 文 獻 共 引 (Co-citation Analysis) 、 以 及 多 維 尺 度 分 析
(Multidimensional Scaling, MDS)等研究方法,透過 ISI 資料庫(1980~2007),
針對 SMJ 等主要期刊,客觀地對併購領域文章進行歸納分析,以匯整出該
領域中的主流議題及其近期趨勢。研究結果發現,由因素分析可萃取出 (1)
併購相關 (2) 多角化相關 (3) 組織學習構面 (4) 財務相關 等四個因素。
其中併購相關與多角化相關兩個因素為 M&As 領域中主要探討的重心。
另外,由多維尺度分析提供的文獻之間距離關係的圖表,將併購文獻分
為財務與非財務兩觀點來探討。研究結果預期能提供給後續併購研究主要
的研究方向。
關鍵字:合併與收購、共被引分析、文獻計量法
Mergers and Acquisitions: Dissemination and Main Trends
Student:Yi-Hsin Yu Advisor:Chyan Yang
Institute of Business and Management
National Chiao Tung University
ABSTRACT
Mergers and acquisitions (M&As) has been extensively conducted for past
three decades. There are a variety of orientations in discussing this subject
during this period. This paper inductively and quantitatively performs the
bibliometric analysis to explore the intellectual structure in the field of M&As.
By using co-citation method, this research extracts four main streams from
factor analysis: M&As-related, diversification, organizational learning
perspective, and finance-related. And two perspectives of finance-related and
non-finance-related identified from multidimensional scaling (MDS). Two new
research interests are discovered from our result for future study. The analysis
provides a clear and graphidescription to understand the dissemination and main
trends of M&As.
Keywords: Mergers and Acquisitions (M&As), Co-citation analysis,
bibliometrics
誌
謝
兩 兩年年的的交交大大經經管管所所生生涯涯,,收收穫穫甚甚豐豐。。首首先先要要感感謝謝的的是是交交大大所所老老師師毫毫不不保保留留地地將將知知識識傳傳授授給給我我們們,,有有 別 別於於大大學學時時代代的的數數學學系系思思維維,,對對人人的的管管理理沒沒有有正正確確答答案案的的方方式式,,著著實實讓讓我我在在剛剛開開始始有有不不少少的的不不適適應應感感。。 隨 隨著著時時間間的的增增長長,,也也漸漸漸漸地地能能夠夠接接受受這這樣樣的的思思考考方方式式,,慢慢慢慢地地瞭瞭解解到到,,凡凡事事遇遇上上了了人人,,隨隨時時都都有有可可能能會會 改 改變變。。這這樣樣的的想想法法,,讓讓我我不不再再拘拘泥泥於於所所謂謂的的正正確確答答案案,,也也開開始始學學著著接接受受每每個個人人的的多多樣樣性性,,心心胸胸也也寬寬大大了了 不 不少少。。 再 再來來,,感感謝謝楊楊老老師師與與凱凱喻喻學學長長在在生生產產論論文文的的過過程程中中,,不不厭厭其其煩煩地地給給予予指指導導,,每每當當有有瓶瓶頸頸出出現現時時,,學學 長 長指指引引的的方方向向總總是是能能夠夠讓讓我我立立刻刻豁豁然然開開朗朗。。老老師師淵淵博博的的學學識識與與豐豐富富的的管管理理實實務務經經驗驗,,總總以以幽幽默默風風趣趣的的方方 式 式表表達達,,聽聽來來不不會會讓讓人人覺覺得得有有壓壓力力,,也也不不會會有有教教條條式式教教學學的的呆呆版版。。老老師師就就像像個個百百寶寶庫庫,,只只要要有有問問題題,,問問 老 老師師必必定定會會有有不不少少的的收收穫穫。。也也感感謝謝老老師師容容忍忍我我們們兩兩個個小小女女生生不不時時的的吵吵鬧鬧拜拜訪訪,,想想必必老老師師現現在在應應該該是是清清境境 許 許多多了了吧吧。。 最 最後後,,感感謝謝經經管管所所大大家家庭庭的的各各位位,,兩兩年年的的研研究究所所生生涯涯,,因因為為有有你你們們,,才才能能多多采采多多姿姿。。不不論論是是碩碩士士班班,, 博 博士士班班,,在在職職專專班班,,或或者者是是EEMMBBAA、、學學分分班班等等,,大大家家不不因因為為彼彼此此年年齡齡的的差差距距而而有有所所隔隔閡閡,,和和樂樂融融融融的的景景象象 是 是大大學學時時代代所所沒沒有有的的。。而而我我也也從從較較老老一一輩輩的的長長者者身身上上,,學學到到了了許許多多的的人人生生經經驗驗,,著著實實是是一一項項不不小小的的意意外外 收 收穫穫。。在在此此,,僅僅以以無無限限的的祝祝福福,,希希望望各各位位未未來來都都能能夠夠萬萬事事如如意意,,一一帆帆風風順順。。 懿 懿欣欣 9977//77//2222
目 錄
中文提要 ……… i
英文提要 .. ……… ii
誌謝 ……… iii
目錄 ………
iv
表目錄 ………
v
圖目錄 ………
v
I.Introduction……… ... 1
II.Literature Review………... 5
III.Methodology……… ... 7
3.1 Co-citation Analysis……….... 7
3.2 Data Collection……… ... 9
3.2.1 Data Selecting……… ... 9
3.2.2 Central Core……… .. 11
3.2.3 Retrieval of Data……… ... 16
IV Result……… .. 18
4.1 Co-citation Analysis……….... 18
4.2 Factor Analysis……….... 20
4.3 Cluster Analysis……… ... 24
4.4 Multidimensional Scaling (MDS)
……… ... 26
4.5 Discussion……… ... 33
V.Conclusion……… ... 35
References……….... 37
表目錄
Table 1. Central Core Documents ……..………..…………..………..……13
Table 2. Co-citation Matrix ..……….………...17
Table 3. Pearson’s Correlation Matrix
………..……
19
Table 4. Explanation of Total Variance .………...20
Table 5. Factor Analysis ………..…...22
Table 6. Multidimensional Analysis ………..….30
Table 7. Documents ranking by publication years .………....31
圖目錄
Figure 1. The relationship between documents …..……….7
Figure 2. Hierarchical Cluster Analysis …………..……….25
1
I.Introduction
Most corporations faced the limitation of growth in recent decades, thus,
managers started to search for solutions to deal with the plight. Mergers and
Acquisitions (M&As) is one of the fast growing strategies to achieve economic scale
or enlarge the business scope. For example, near 74,000 M&As transactions estimated
over 12,000 billion dollars market values were completed from 1996 to 2001 in
America. In fact, the value of M&As were up to 3,500 billion dollars in year 2000.
However, M&As did not bring the anticipated profit to corporations. In fact,
researches indicated that almost 70 percent of M&As failed. Besides, evidences
showed that target-firms generally received short-term return, while the acquiring
firms usually experienced underperformance measured by stock value after
acquisition. In addition, some researchers considered M&As as a notorious strategy of
creating value for stockholders. Therefore, they concluded that creating synergy
through M&As were only exist in the minds of CEOs.
Because of risky and costly strategy, M&As started to attract scholars’ attention.
Scholars explore this problem from different perspectives such as strategy
management, psychology, human behavior, law and finance. According to Hitt,
diligence. Others suggested a successful acquisition may be affected by different
calculation methods of payment. Several studies also concerned about whether the
synergy can be created after acquisition. The main impact factors to the performance
of M&As were also considered from organizational perspectives such as cultural
differences, organizational learning, and the hubris of top manager. Thus, three
characteristics can be summarized from the above M&As issues: (1) it’s a complicate
management practice; (2) it is long-lived and relative mature in the field of strategy
management; and (3) its multidisciplinary features have been applied into different
academic fields.
For the past years, few articles attempted to systematically analyze the structure
of M&As. In Datta, Narayanan’s study (1992), meta-analysis was used to find out the
factors influencing wealth creation from M&As. King et. al. (2004) also used
meta-analysis to identify the antecedents of post-acquisition performance. Their result
indicated that there still remain some unidentified moderators in M&As. Finally,
Cartwright and Schornberg (2006) summarized M&As literatures of the past three
decades into three main streams: strategic fit, organizational fit, and acquisition
process itself. These studies reviewed literatures from different approaches. In order
3
approaches are recommended.
Bibiometry is one of the most popular methods in integrating large amounts of
literatures. Authors prone to cite papers that related to the topics of their research.
Thus, a context can be observed between this article and its references. Co-citation
analysis measures the relationships between two documents by counting their joint
citations. The more often they are cited together, the closer the relationship they have.
Thus, those frequently cited literatures are considered to have greater influence in that
field. Therefore, with these significant contributing literatures, co-citation analysis
facilitates a more comprehensive and detailed insight in analyzing M&As.
In this study, bibliometric approach is adopted to investigate the intellectual
structure of M&As. This quantitative approach with co-citation analysis and
multidimensional scaling (MDS) tends to carry out the main trends of M&As and the
exploration of its dissemination to other fields. On one hand, this statistical technique
offers an objective way to summaries literatures in M&As. Besides, bibliographics
provides a simple and easy understanding process to extract the characters of M&As.
On the other hand, a graphic view from MDS makes it easy to analyze the
The rest of this paper is organized as the following: first, M&As literatures and
bibliometric methodology were reviewed. Second, research process by using
co-citation analysis is defined in the third section. Findings and discussions were
presented in the fourth section. In addition, four extracted factors and the map of
MDS were also exhibited in this segment. Finally, the conclusion of this study will be
5
II.Literature Review
Most review literatures integrated with a subjective viewpoint. Experts studied a
great deal of essays and summarized it to a brief conclusion. For example, one of
these articles is the study of Cartwright and Schornberg (2006), which attempted to
reflect the multidisciplinary nature of M&As in strategic management field.
Thirty-one articles were analyzed and summarized into three main streams- strategic
fit, organizational fit, and acquisition process itself. While strategic fit links the
performance of M&As and the strategic attributes, organizational fit is related to the
organizational problems between two firms. The acquisition process focuses on the
process itself and the post acquisition process. Finally, Cartwright and Schornberg
(2006) also suggested three directions for future research: non-value maximizing
motives, the connection with practitioner community, and unidentified variables.
Compared with a subjective method, another statistical approach was employed
by meta-analysis. Meta-analysis is one of the popular methods in integrating
literatures, because meta-view could provide an objective way to identify a congruent
conclusion from past researches.
findings of studies on wealth creation in mergers and acquisitions. Five factors were
considered as the major variables in this empirical analysis: regulatory changes, the
number of bidders, the bidder’s approach (merger vs. tender offer), the mode of
financing (cash vs. stock), and the type of merger or acquisition (conglomerate vs.
Non-conglomerate). Besides, Palich, Cardinal, and Miller (2000) used meta-analysis
to synthesize three decades of research to address the major theoretical issues that
remain open to debate. Moreover, King, Dalton, Daily, and Covin (2004) summarized
the findings of previous studies in post-acquisition performance and identified
promising directions for further M&As research with meta-analysis.
However, both subjective method and meta-analysis have limitation. First,
subjectivity may focus on specific perspective of that field, which is easy to generate
bias from individual judgment. Second, the statistical methodology with meta-analysis
aims on limited variables and emphasizes on the findings of relationship between
these factors and dependent variables. Besides, it is difficult to cover three decades
intellectual structure development of M&As field within these two methods. We
attempt to use co-citation analysis to provide a rather broadly viewpoint and an
7
III.Methodology
3.1 Co-citation Analysis
There are several methods for integrating a mature and well popular research
field, and bibliometrics is one of them. Bibliometric provides a powerful and
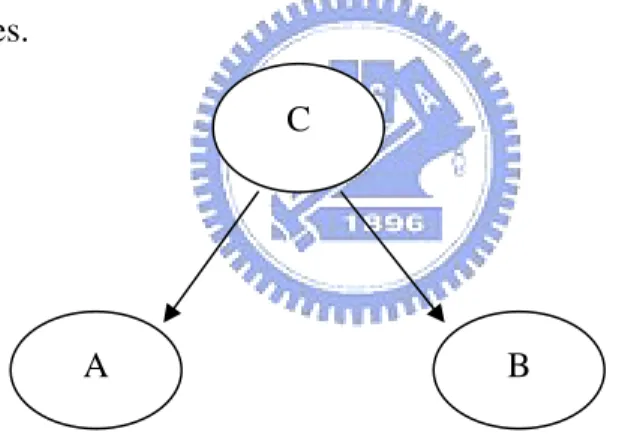
objective procedure to induct main trends of theories. When doing a research, the
author will consult articles that relate to his study. Whenever two documents (A and B)
were cited together, showing in another article (C), we would say that they are related
to each other (Figure 1). Therefore, a context can be found between the research and
its citing references.
Co-citation analysis counts the number of co-cited times between two papers
(White and Griffith, 1981). The more they are cited together, the closer the
relationship between them (White and Griffith, 1986). Thus, this statistical count
suggests an operational way to analyze large amount of data. A rather neat and
concrete map can be exposed from this method. A
C
B
From this point of view, co-citation analysis starts with relative articles that offer
reliable and mutual influence (Remos and Ruiz, 2004). Thus, co-citation analysis
offers two advantages in this study. First, different from the research of Cartwright
and Schoenberg (2006) who use subjective approach, co-citation analysis provides a
statistical and quantitative approach in investigating the literatures of M&As. Second,
since co-citation analysis requires a large literature database, an extensive browsing
through this territory is needed. Thus, a greater insight into M&As can also be
discovered from this approach (Acedo, et. al. 2006).
Nevertheless, despite the claim of co-citation analysis for a mathematical
approach, it still has some limitations in source collection:
First, to cover the overall developments of M&As, the critical stage is to find
influential and representative documents. In this case, most authors will select those
documents whose citation times are relative high. This criterion prefers picking out
older documents rather than selecting recent published ones. Therefore, a new trend of
M&As research may be left out from this procedure. To solve this problem, an
advanced data selecting procedure suggested by Hummon & Dorein (1989) and
Hummon & Carley (1993) will be conducted in this study. Further details are shown
9
Second, because M&As has been developed for a long time, its widespread
discussion diverged into many fields such as strategy management, organizational
behavior, finance, law, psychology, economics, etc. In order not to diverse our study
from managerial point of view, we will focus on strategic management, organizational
perspective, and financial issues. Therefore, we selected and analyzed articles
published in main stream journals such as Strategic Management Journal (SMJ),
Journal of Management (JoM), Journal of Finance (JF), Academy of Management
Review (AMR) and Academy of Management Journal (AMJ).
The statistical methods used in this study are factor analysis, cluster analysis, and
multidimensional scaling (MDS). Factor analysis is used to reduce the number of
dimensions and find out the main streams of M&As. Cluster analysis is used to
confirm the result from factor analysis and MDS can provide greater insight from the
above findings.
3.2 Data Collection
3.2.1 Data Selecting
The starting point for co-citation method is to select the core papers; this is an
all the published research papers into our core documents, the set of core documents
must cover the whole development of the research field as large as possible.
To ensure this prior condition, we would like to follow the method of Hummon
& Doreian (1989) and Hummon & Carley (1993). They suggested that the core data
could start from an initial core paper which made up the most basic foundation of the
theory. Then extend the core set within this initial core paper.
In order to find out the initial core, we searched articles which were published
within three years. After a brief survey of articles published after year 2000, we found
out there are sufficient literature review papers to cover all the past issues and new
trends in M&As within these three years. By doing so, a comprehensive review of
past researches can be obtained. First, “diversification, merger, and acquisition” were
used as key words and searched in ISI database. Then, the study of Cartwight and
Schoenberg(2006) was singled out as our initial document, because it carried out an
integrative review of Mergers and Acquisitions for the past three decades.
By using its references, we continued to search for review documents which
11
Halebian, 1999; Ahuja & Katila 2001; and King, 2004) were included in the initial
core set. They were selected for several reasons. First, for the variance concern, these
documents published in a widespread years. From the end of 1980s to recent years, it
covered thirty years development of M&As. Second, they provide an integrative and
longitude review of this issue and make up the foundation of the core set more
consolidate. Third, since organizational perspective has overlapped with strategic
management, we would like to consider the perspective of related organization issues.
Fourth, there are higher citation times in our core sets than in other references. Finally,
they are all published in prestigious management journals with high impact factors
(2.632 with Strategic Management Journal; 2.455 with Administrative Science
Quarterly).
3.2.2 Central Core
According to the initial core set we chose before, the extended core papers for
our research are met with additional criteria as follows:
(1)Articles which were cited by either the initial papers or by the references of the
initial papers after 1980.
(2)Articles which were published in the Strategic Management Journal (SMJ),
(AMR), Journal of Management (JOM), and Journal of Finance (JF) .
(3)Articles were listed within top ten citation times.
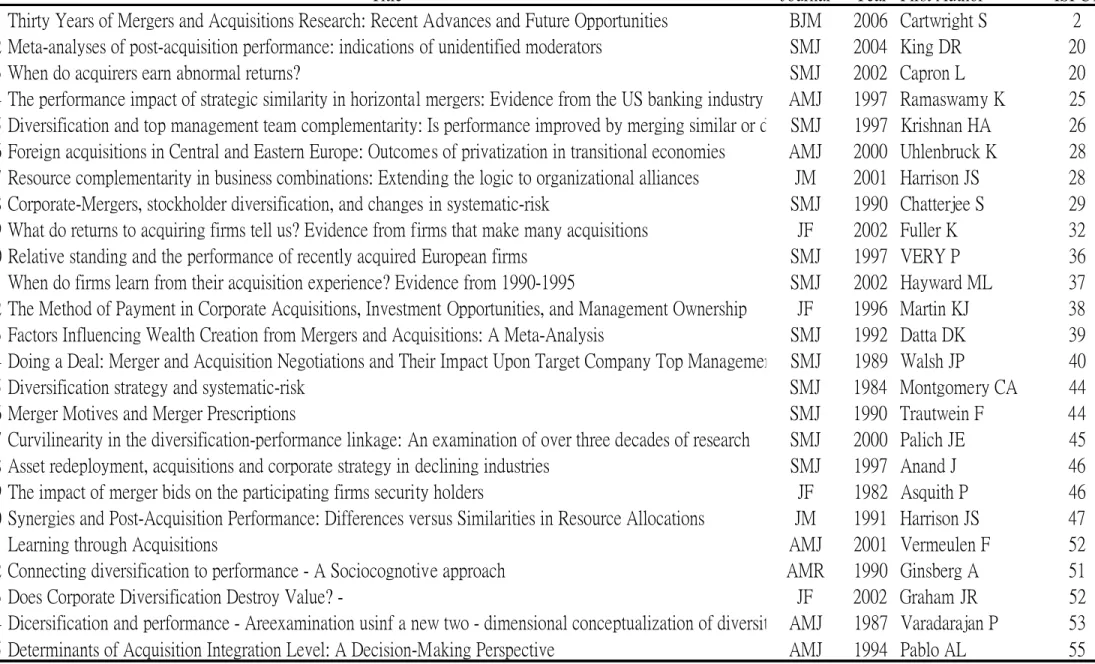
Finally, in order not to be left out some important articles, we used the same key
words to find the documents with significant citations in ISI database. In conclusion,
68 documents in total were selected out to be our core papers. The 68 articles with
13
Table 1. Central Core Documents
Title Journal Year First Author ISI CT
A-01 Thirty Years of Mergers and Acquisitions Research: Recent Advances and Future Opportunities BJM 2006 Cartwright S 2 A-02 Meta-analyses of post-acquisition performance: indications of unidentified moderators SMJ 2004 King DR 20 A-03 When do acquirers earn abnormal returns? SMJ 2002 Capron L 20 A-04 The performance impact of strategic similarity in horizontal mergers: Evidence from the US banking industry AMJ 1997 Ramaswamy K 25 A-05 Diversification and top management team complementarity: Is performance improved by merging similar or d SMJ 1997 Krishnan HA 26 A-06 Foreign acquisitions in Central and Eastern Europe: Outcomes of privatization in transitional economies AMJ 2000 Uhlenbruck K 28 A-07 Resource complementarity in business combinations: Extending the logic to organizational alliances JM 2001 Harrison JS 28 A-08 Corporate-Mergers, stockholder diversification, and changes in systematic-risk SMJ 1990 Chatterjee S 29 A-09 What do returns to acquiring firms tell us? Evidence from firms that make many acquisitions JF 2002 Fuller K 32 A-10 Relative standing and the performance of recently acquired European firms SMJ 1997 VERY P 36 A-11 When do firms learn from their acquisition experience? Evidence from 1990-1995 SMJ 2002 Hayward ML 37 A-12 The Method of Payment in Corporate Acquisitions, Investment Opportunities, and Management Ownership JF 1996 Martin KJ 38 A-13 Factors Influencing Wealth Creation from Mergers and Acquisitions: A Meta-Analysis SMJ 1992 Datta DK 39 A-14 Doing a Deal: Merger and Acquisition Negotiations and Their Impact Upon Target Company Top Managemen SMJ 1989 Walsh JP 40 A-15 Diversification strategy and systematic-risk SMJ 1984 Montgomery CA 44 A-16 Merger Motives and Merger Prescriptions SMJ 1990 Trautwein F 44 A-17 Curvilinearity in the diversification-performance linkage: An examination of over three decades of research SMJ 2000 Palich JE 45 A-18 Asset redeployment, acquisitions and corporate strategy in declining industries SMJ 1997 Anand J 46 A-19 The impact of merger bids on the participating firms security holders JF 1982 Asquith P 46 A-20 Synergies and Post-Acquisition Performance: Differences versus Similarities in Resource Allocations JM 1991 Harrison JS 47 A-21 Learning through Acquisitions AMJ 2001 Vermeulen F 52 A-22 Connecting diversification to performance - A Sociocognotive approach AMR 1990 Ginsberg A 51 A-23 Does Corporate Diversification Destroy Value? - JF 2002 Graham JR 52 A-24 Dicersification and performance - Areexamination usinf a new two - dimensional conceptualization of diversit AMJ 1987 Varadarajan P 53 A-25 Determinants of Acquisition Integration Level: A Decision-Making Perspective AMJ 1994 Pablo AL 55
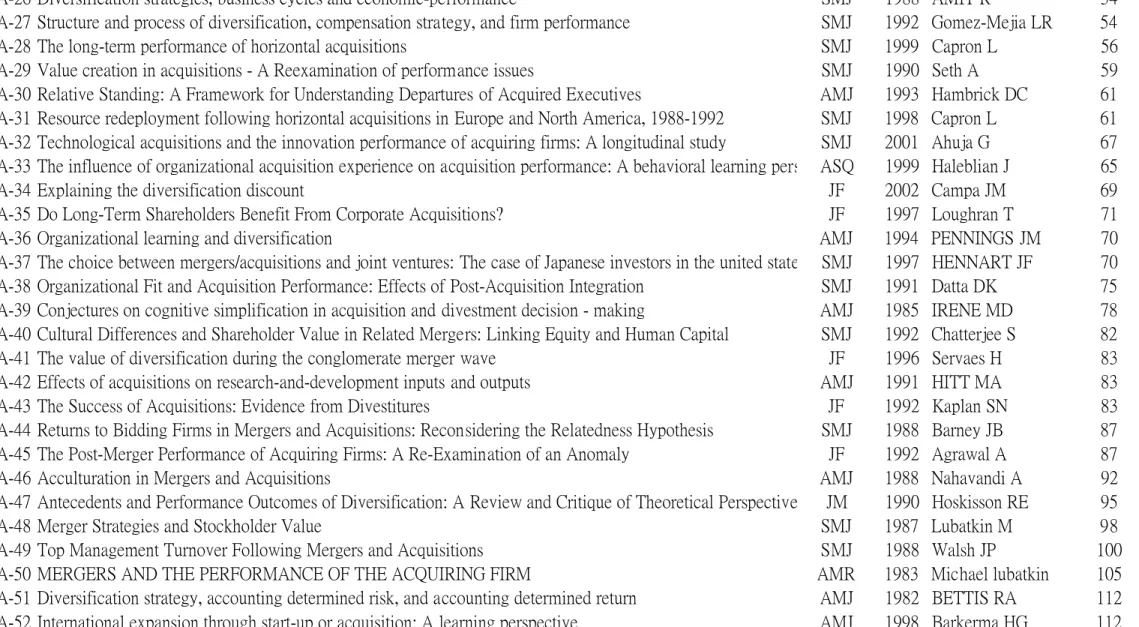
Table 1 Central Core Documents (cont.)
Title Journal Year First Author ISI CT
A-26 Diversification strategies, business cycles and economic-performance SMJ 1988 AMIT R 54
A-27 Structure and process of diversification, compensation strategy, and firm performance SMJ 1992 Gomez-Mejia LR 54
A-28 The long-term performance of horizontal acquisitions SMJ 1999 Capron L 56
A-29 Value creation in acquisitions - A Reexamination of performance issues SMJ 1990 Seth A 59
A-30 Relative Standing: A Framework for Understanding Departures of Acquired Executives AMJ 1993 Hambrick DC 61
A-31 Resource redeployment following horizontal acquisitions in Europe and North America, 1988-1992 SMJ 1998 Capron L 61
A-32 Technological acquisitions and the innovation performance of acquiring firms: A longitudinal study SMJ 2001 Ahuja G 67
A-33 The influence of organizational acquisition experience on acquisition performance: A behavioral learning pers ASQ 1999 Haleblian J 65
A-34 Explaining the diversification discount JF 2002 Campa JM 69
A-35 Do Long-Term Shareholders Benefit From Corporate Acquisitions? JF 1997 Loughran T 71
A-36 Organizational learning and diversification AMJ 1994 PENNINGS JM 70
A-37 The choice between mergers/acquisitions and joint ventures: The case of Japanese investors in the united state SMJ 1997 HENNART JF 70
A-38 Organizational Fit and Acquisition Performance: Effects of Post-Acquisition Integration SMJ 1991 Datta DK 75
A-39 Conjectures on cognitive simplification in acquisition and divestment decision - making AMJ 1985 IRENE MD 78
A-40 Cultural Differences and Shareholder Value in Related Mergers: Linking Equity and Human Capital SMJ 1992 Chatterjee S 82
A-41 The value of diversification during the conglomerate merger wave JF 1996 Servaes H 83
A-42 Effects of acquisitions on research-and-development inputs and outputs AMJ 1991 HITT MA 83
A-43 The Success of Acquisitions: Evidence from Divestitures JF 1992 Kaplan SN 83
A-44 Returns to Bidding Firms in Mergers and Acquisitions: Reconsidering the Relatedness Hypothesis SMJ 1988 Barney JB 87
A-45 The Post-Merger Performance of Acquiring Firms: A Re-Examination of an Anomaly JF 1992 Agrawal A 87
A-46 Acculturation in Mergers and Acquisitions AMJ 1988 Nahavandi A 92
A-47 Antecedents and Performance Outcomes of Diversification: A Review and Critique of Theoretical Perspective JM 1990 Hoskisson RE 95
A-48 Merger Strategies and Stockholder Value SMJ 1987 Lubatkin M 98
A-49 Top Management Turnover Following Mergers and Acquisitions SMJ 1988 Walsh JP 100
A-50 MERGERS AND THE PERFORMANCE OF THE ACQUIRING FIRM AMR 1983 Michael lubatkin 105
15
Table 1 Central Core Documents (cont.)
Title Journal Year First Author ISI CT
A-53 The measurement of firm diversification - some new empirical-evidence AMJ 1982 Montgomery CA 115 A-54 Types of Synergy and Economic Value: The Impact of Acquisitions on Merging and Rival Firms SMJ 1986 Chatterjee S 116 A-55 The market for corporate control and firm innovation AMJ 1996 Hitt MA 125 A-56 Corporate acquisition strategies and economic performance SMJ 1987 Singh H 127 A-57 The link between resources and type of diversification: Theory and evidence SMJ 1991 Chatterjee S 127 A-58 Communication with Employees following a Merger: A Longitudinal Field Experiment AMJ 1991 Schweiger DW 129 A-59 The cost of diversity: The diversification discount and inefficient investment JF 2000 Rajan R 130 A-60 Corporate takeover bids, Methods of payment, and bidding firms stock returns JF 1987 Travlos NG 143 A-61 Performance differences in related and unrelated diversified firms SMJ 1981 Bettis RA 146 A-62 Corporate economic-performance-diversification strategy versus market-structure SMJ 1981 Christensen HK 151 A-63 Research on corporate diversification - A Synthesis SMJ 1989 Ramanujam V 156 A-64 Corporate Acquisitions: A Process Perspective AMR 1986 Jemison DB 171 A-65 Dicersification strategy and profitability SMJ 1982 RUMELT RP 205 A-66 Do managerial objectives drive bad acquisitions JF 1990 Morck R 230 A-67 Diversification strategy, Profit performance and the entropy measure SMJ 1985 PALEPU K 250 A-68 The dominant logic - A New linkage between diversity and performance SMJ 1986 Prahalad CK 353 5738
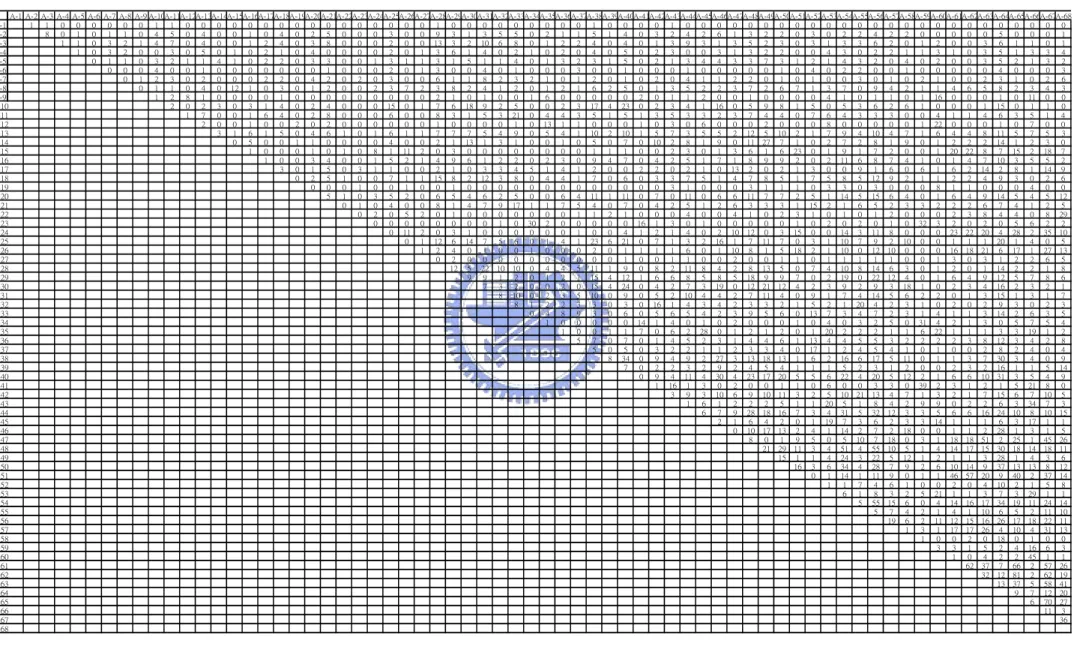
3.2.3 Retrieval of Data
Once the enlarged central core documents have been selected, a 68×68 co-citation matrix
revealed in Table 2 was then obtained for next analysis. These figures are derived from the
collected data from ISI database. Each of them indicates the co-citation times related to the two
documents from the row and column. The more frequently they cited together, the greater
relationship they have with each other. Microsoft Excel and SPSS are used in the whole process.
For the diagonal part, two approaches had been used to deal with it. The figures in the
diagonal part are replaced with adjusted number which sums the three highest grades and divides
them by two (White and Griffith, 1981). The other one is considered as an undefined item, thus
ignoring these places as missing data (Ramos-Rodriguez and Ruiz-Navarro, 2004). Since the first
method was a result from try and error, we prefer to treat it as an undefined item to estimate
17
Table 2. Co-citation Matrix
A-1 A-2 A-3 A-4 A-5 A-6 A-7 A-8 A-9 A-10A-11A-12A-13A-14A-15A-16A-17A-18A-19A-20A-21A-22A-23A-24A-25A-26A-27A-28A-29A-30A-31A-32A-33A-34A-35A-36A-37A-38A-39A-40A-41A-42A-43A-44A-45A-46A-47A-48A-49A-50A-51A-52A-53A-54A-55A-56A-57A-58A-59A-60A-61A-62A-63A-64A-65A-66A-67A-68
A-1 1 1 0 0 0 0 0 0 1 1 0 0 0 0 0 0 0 0 0 0 0 0 0 0 0 0 1 0 0 0 0 0 0 0 0 0 1 0 0 0 0 1 0 0 0 0 0 0 0 0 0 0 0 0 0 0 0 0 0 0 0 0 0 0 0 0 0 A-2 8 0 1 0 1 1 0 4 5 0 4 0 0 1 0 4 0 2 5 0 0 0 3 0 0 9 3 1 3 5 5 0 2 1 1 5 1 4 0 3 2 4 2 6 1 3 2 2 0 3 0 2 2 4 2 2 0 0 0 0 0 5 0 0 0 1 A-3 1 1 0 3 2 1 4 7 0 4 0 0 1 2 4 0 3 8 0 0 0 2 0 0 13 3 2 10 6 8 0 1 2 2 4 0 4 0 1 3 9 3 1 3 5 2 3 0 3 1 3 3 6 2 0 1 2 0 0 3 6 1 1 0 1 A-4 1 0 3 2 0 0 3 0 5 0 1 0 2 1 0 4 0 0 0 0 2 0 1 3 6 1 4 0 2 1 0 2 0 4 0 5 0 2 3 0 0 3 1 3 2 2 0 0 4 3 0 2 2 1 1 3 1 0 3 5 1 3 3 4 A-5 0 1 1 0 3 2 1 1 4 1 0 2 2 0 3 3 0 0 1 3 1 1 3 1 5 1 1 4 0 1 3 2 3 1 5 0 2 1 3 4 4 3 3 7 3 1 2 1 4 3 2 0 4 0 2 0 0 3 5 2 1 3 2 A-6 0 0 0 4 0 0 1 0 0 0 0 0 0 0 1 0 0 0 2 0 1 3 0 0 4 0 1 0 0 0 3 0 0 1 0 0 0 1 0 0 0 0 0 1 0 4 0 2 2 0 0 1 0 0 0 0 0 4 0 0 0 3 A-7 0 1 2 3 0 2 0 0 0 2 2 0 4 2 0 2 0 3 0 0 6 1 1 8 2 3 2 1 0 1 2 0 1 0 2 0 4 1 1 2 2 0 1 0 1 0 0 3 0 1 0 2 1 0 0 2 3 1 0 2 6 A-8 0 1 1 0 4 0 12 1 0 3 0 1 2 0 0 2 3 7 2 3 8 2 4 1 2 0 1 2 1 6 2 5 0 1 3 5 2 2 3 7 2 6 7 1 3 7 0 9 4 2 1 1 4 6 5 8 2 3 4 3 A-9 1 2 8 1 0 0 0 0 1 0 0 0 0 0 0 0 0 0 2 1 0 1 0 0 1 6 0 0 0 0 0 2 0 1 1 2 0 0 1 0 0 0 0 4 1 0 1 1 0 1 16 0 0 0 1 0 11 0 0 A-10 2 0 2 3 0 3 1 4 0 2 4 0 0 0 15 0 1 7 6 18 9 2 5 0 0 2 3 17 4 23 0 2 3 4 1 16 0 5 9 8 1 5 0 5 3 6 2 6 1 0 0 0 1 15 0 1 1 0 A-11 1 7 0 0 1 6 4 0 2 8 0 0 0 6 0 0 8 3 1 5 3 21 0 4 4 3 5 1 5 1 3 5 3 3 2 3 7 4 4 0 7 6 4 3 3 3 0 0 4 1 1 4 6 3 5 1 4 A-12 2 0 0 1 0 0 2 0 2 0 0 0 0 0 0 1 0 0 0 0 1 0 13 1 1 0 0 0 1 0 3 0 6 0 0 0 2 0 0 0 8 0 0 0 0 0 1 22 0 0 0 1 0 7 0 0 A-13 3 1 6 1 5 0 4 6 1 0 1 6 1 1 7 7 7 5 4 9 0 5 4 1 10 2 10 1 5 7 3 5 5 2 12 5 10 2 1 7 9 4 10 4 7 1 6 4 4 8 11 5 7 5 3 A-14 0 5 0 0 1 1 0 0 0 0 4 0 0 2 1 13 1 3 1 0 0 1 0 5 0 7 0 10 2 8 1 9 0 11 27 7 1 0 2 7 2 8 1 9 0 1 2 2 2 14 1 2 3 0 A-15 1 0 0 0 1 0 1 0 8 1 11 2 0 3 0 0 0 0 0 0 0 0 1 1 1 0 0 2 3 0 1 3 6 1 6 23 0 1 9 1 7 2 0 0 1 20 22 8 7 15 2 18 7 A-16 1 0 0 3 4 0 0 1 5 2 1 4 9 6 1 2 2 0 2 3 0 9 4 7 0 4 2 5 1 7 1 8 9 9 2 0 2 11 6 8 7 4 1 0 1 4 7 10 3 5 5 2 A-17 3 0 1 5 0 3 1 1 0 0 2 1 0 3 3 4 5 1 4 1 2 0 0 2 2 0 2 1 0 13 2 0 2 1 3 0 0 9 1 6 0 6 1 6 2 14 2 8 1 14 9 A-18 0 2 5 1 0 0 7 1 1 15 8 2 12 3 8 0 4 4 1 7 0 6 0 3 3 7 5 1 4 7 8 5 1 7 5 8 5 12 9 2 1 1 2 2 4 9 3 0 2 6 A-19 0 0 0 1 0 0 1 0 0 1 0 0 0 0 0 0 0 0 0 0 0 0 0 3 1 0 0 0 3 1 1 1 0 3 3 0 3 0 0 0 8 1 1 0 0 0 4 0 0 A-20 5 1 0 3 5 2 0 6 5 4 6 2 5 0 0 6 4 11 1 11 0 7 0 11 0 6 6 11 7 7 2 5 1 14 5 15 6 4 0 1 6 4 9 14 5 4 5 12 A-21 0 1 0 4 0 0 8 1 4 7 9 17 1 1 7 5 4 0 7 0 4 2 5 1 2 6 3 3 3 1 15 2 1 6 5 2 3 3 2 2 2 6 7 4 1 2 5 A-22 0 2 0 5 2 0 1 0 0 0 0 0 0 0 1 1 2 1 0 0 0 4 0 0 4 1 0 2 3 1 0 1 0 1 2 0 0 0 2 3 8 4 4 0 8 29 A-23 0 0 0 0 0 0 0 0 1 0 30 2 0 0 0 0 0 16 1 3 0 1 0 0 0 0 0 1 0 2 0 2 0 1 0 32 3 2 0 2 0 5 6 2 2 A-24 0 11 2 0 3 1 0 0 0 0 0 0 1 0 0 4 1 2 1 4 0 2 10 12 0 3 15 0 0 14 3 11 8 0 0 0 23 22 20 4 28 2 35 10 A-25 0 1 12 6 14 7 5 6 0 1 4 1 23 6 21 0 7 1 3 2 16 1 7 11 7 0 3 1 10 7 9 2 10 0 0 1 1 1 20 1 4 0 5 A-26 1 2 4 0 1 0 0 1 0 0 0 2 0 1 1 1 1 6 0 1 10 8 1 5 18 2 1 10 0 12 10 0 0 0 16 18 21 6 17 1 27 13 A-27 0 2 0 0 0 0 0 0 0 0 0 0 1 0 0 1 1 0 0 2 0 0 1 1 0 1 1 1 1 1 0 0 1 3 0 3 1 2 2 6 5 A-28 12 5 22 10 10 0 4 4 5 11 1 9 0 8 2 11 8 4 2 8 13 5 0 7 4 10 8 14 6 3 0 1 2 0 1 14 2 2 1 8 A-29 9 9 1 2 0 1 2 1 15 4 12 1 6 6 8 5 8 5 18 9 9 7 0 2 19 0 22 12 4 0 1 6 4 9 12 5 7 8 6 A-30 7 3 2 0 0 2 0 15 4 24 0 4 2 7 3 19 0 12 21 12 4 2 3 9 2 9 3 18 1 0 2 3 4 16 2 3 2 1 A-31 8 10 0 2 3 5 10 0 9 0 5 2 10 4 4 2 7 11 4 0 9 1 7 4 14 5 6 2 2 0 1 3 15 1 3 1 7 A-32 8 1 2 2 3 3 0 3 0 16 1 4 3 4 2 3 3 2 1 5 2 1 20 4 2 3 1 0 2 0 2 9 3 0 2 3 A-33 0 4 8 9 3 0 6 0 5 6 5 4 2 3 9 5 6 0 13 7 3 4 7 2 3 1 4 1 1 3 14 2 6 3 5 A-34 1 0 0 0 0 0 14 1 4 0 1 0 2 0 0 0 1 0 4 0 3 2 5 0 31 4 2 1 3 0 5 7 5 4 A-35 1 0 0 1 1 7 0 6 2 28 0 1 2 1 2 0 1 20 2 2 2 1 1 6 22 1 1 1 3 3 19 1 2 A-36 5 7 0 7 0 1 4 5 2 3 1 4 4 6 1 13 4 4 5 5 3 2 2 2 2 3 8 12 3 4 2 8 A-37 5 0 5 0 3 2 2 1 1 2 3 3 4 0 17 1 2 4 5 4 1 0 1 0 0 2 8 2 4 0 4 A-38 8 34 0 9 4 9 2 27 3 13 18 13 1 6 2 16 6 17 5 11 0 1 1 3 7 30 3 4 0 9 A-39 7 0 2 2 3 2 9 2 4 5 4 1 1 1 5 2 3 1 2 0 0 2 3 2 16 1 1 5 14 A-40 0 9 4 11 4 30 4 23 17 20 5 5 6 22 4 20 5 12 2 1 6 6 10 31 3 5 4 9 A-41 1 16 1 3 0 2 0 0 1 1 0 6 0 0 3 3 0 39 2 3 1 2 1 5 21 8 0 A-42 3 9 3 10 6 9 10 11 3 2 5 10 21 13 4 7 1 3 2 1 7 15 6 7 10 5 A-43 1 6 1 2 2 2 5 1 1 20 5 1 8 4 2 9 9 0 2 2 6 3 34 7 3 A-44 6 7 9 28 18 16 7 3 4 31 5 32 12 3 3 5 6 6 16 24 10 8 10 15 A-45 2 1 6 4 2 0 1 19 7 3 6 2 3 3 14 1 1 1 6 3 17 1 1 A-46 0 10 17 13 2 4 1 14 2 7 2 18 0 0 1 1 2 28 1 3 1 5 A-47 8 0 1 9 5 0 5 10 7 18 0 3 1 18 18 51 2 25 1 45 26 A-48 21 29 11 3 4 51 4 55 10 5 1 4 14 17 15 30 18 14 18 11 A-49 15 1 1 4 24 3 22 5 12 1 2 1 1 3 28 1 4 3 6 A-50 16 3 6 34 4 28 7 9 2 6 10 14 9 37 13 13 8 12 A-51 0 1 14 1 11 9 0 1 1 46 57 20 9 40 2 37 14 A-52 1 1 7 4 6 1 0 0 2 0 4 10 2 1 5 8 A-53 6 1 8 3 2 5 21 1 1 3 7 3 29 1 1 A-54 5 55 15 6 0 4 14 16 17 34 19 11 24 14 A-55 5 7 4 2 1 4 1 10 6 5 2 11 10 A-56 19 6 2 11 12 15 16 26 17 18 22 11 A-57 1 3 1 17 17 26 4 10 4 31 13 A-58 1 0 0 2 0 18 0 1 0 0 A-59 3 3 1 5 2 4 16 6 3 A-60 1 0 4 2 2 45 1 1 A-61 62 37 7 66 2 57 26 A-62 32 12 81 2 62 19 A-63 13 37 5 58 41 A-64 9 7 12 20 A-65 6 70 27 A-66 11 3 A-67 36 A-68
IV Result
4.1 Co-citation Analysis
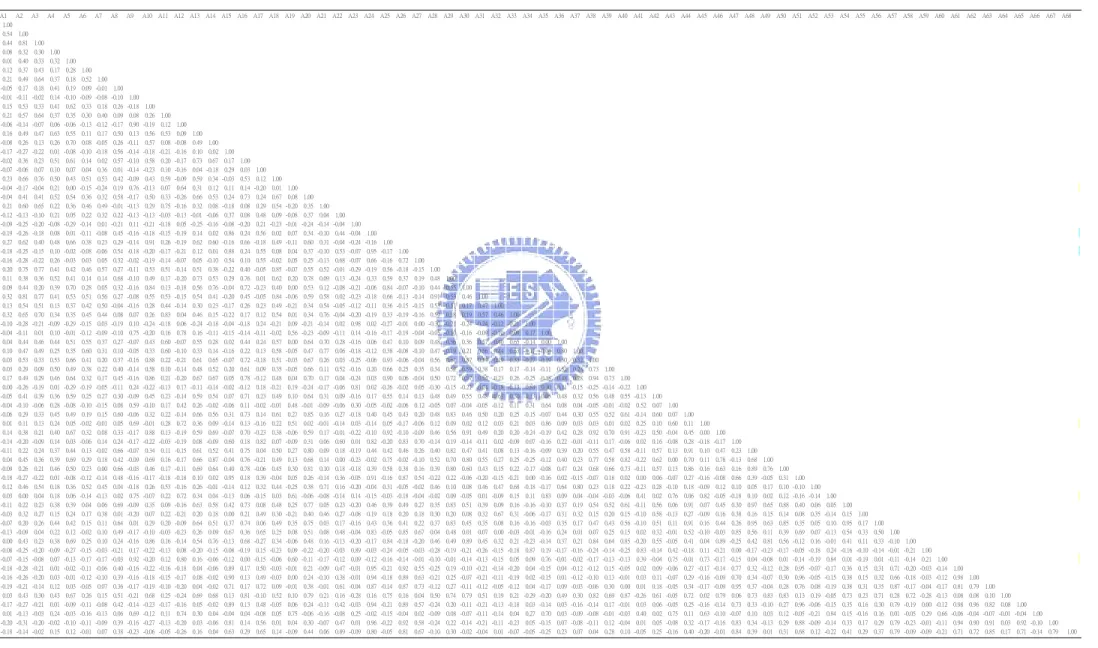
For further analysis, a Pearson’s correlation from co-citation matrix is required. This
Pearson correlation matrix represents the similarities between two documents from the core.
Using correlation matrix instead of the original co-citation matrix for further analysis has two
important advantages (White and McCain, 1998). First, correlation matrix can provide a
standardized data structure to avoid scale effect due to the relative citation of documents. For
example, the citation range of our initial core documents is between 0 and 81, while the
correlation matrix reduces the range from 0 to 1 after transforming. Second, correlation matrix
converts zero into a meaningful number since zero is a critical value of statistical calculation.
19
Table 3. Pearson’s Correlation Matrix
A1 A2 A3 A4 A5 A6 A7 A8 A9 A10 A11 A12 A13 A14 A15 A16 A17 A18 A19 A20 A21 A22 A23 A24 A25 A26 A27 A28 A29 A30 A31 A32 A33 A34 A35 A36 A37 A38 A39 A40 A41 A42 A43 A44 A45 A46 A47 A48 A49 A50 A51 A52 A53 A54 A55 A56 A57 A58 A59 A60 A61 A62 A63 A64 A65 A66 A67 A68 A1 1.00 A2 0.54 1.00 A3 0.44 0.81 1.00 A4 0.08 0.32 0.30 1.00 A5 0.01 0.40 0.33 0.32 1.00 A6 0.12 0.37 0.43 0.17 0.28 1.00 A7 0.21 0.49 0.64 0.37 0.18 0.52 1.00 A8 -0.05 0.17 0.18 0.41 0.19 0.09 -0.01 1.00 A9 -0.01 -0.11 -0.02 0.14 -0.10 -0.09 -0.08 -0.10 1.00 A10 0.15 0.53 0.33 0.41 0.62 0.33 0.18 0.26 -0.18 1.00 A11 0.21 0.57 0.64 0.37 0.35 0.30 0.40 0.09 0.08 0.26 1.00 A12 -0.06 -0.14 -0.07 0.06 -0.06 -0.13 -0.12 -0.17 0.90 -0.19 0.12 1.00 A13 0.16 0.49 0.47 0.63 0.55 0.11 0.17 0.50 0.13 0.56 0.53 0.09 1.00 A14 -0.08 0.26 0.13 0.26 0.70 0.08 -0.05 0.26 -0.11 0.57 0.08 -0.08 0.49 1.00 A15 -0.17 -0.27 -0.22 0.01 -0.08 -0.10 -0.18 0.56 -0.14 -0.18 -0.21 -0.16 0.10 0.02 1.00 A16 -0.02 0.36 0.23 0.51 0.61 0.14 0.02 0.57 -0.10 0.58 0.20 -0.17 0.73 0.67 0.17 1.00 A17 -0.07 -0.06 0.07 0.10 0.07 0.04 0.36 0.01 -0.14 -0.23 0.10 -0.16 0.04 -0.18 0.29 0.03 1.00 A18 0.23 0.66 0.76 0.50 0.43 0.51 0.53 0.42 -0.09 0.43 0.59 -0.09 0.59 0.34 -0.03 0.53 0.12 1.00 A19 -0.04 -0.17 -0.04 0.21 0.00 -0.15 -0.24 0.19 0.76 -0.13 0.07 0.64 0.31 0.12 0.11 0.14 -0.20 0.01 1.00 A20 -0.04 0.41 0.41 0.52 0.54 0.36 0.32 0.58 -0.17 0.50 0.33 -0.26 0.66 0.53 0.24 0.73 0.24 0.67 0.08 1.00 A21 0.21 0.60 0.65 0.22 0.36 0.46 0.49 -0.01 -0.13 0.29 0.75 -0.16 0.32 0.08 -0.18 0.08 0.29 0.54 -0.20 0.35 1.00 A22 -0.12 -0.13 -0.10 0.21 0.05 0.22 0.32 0.22 -0.13 -0.13 -0.03 -0.13 -0.01 -0.06 0.37 0.08 0.48 0.09 -0.08 0.37 0.04 1.00 A23 -0.09 -0.25 -0.20 -0.08 -0.29 -0.14 0.01 -0.21 0.11 -0.21 -0.18 0.05 -0.25 -0.16 -0.08 -0.20 0.21 -0.23 -0.01 -0.24 -0.14 -0.04 1.00 A24 -0.19 -0.26 -0.18 0.08 0.01 -0.11 -0.08 0.45 -0.16 -0.18 -0.15 -0.19 0.14 0.02 0.86 0.24 0.56 0.02 0.07 0.34 -0.10 0.44 -0.04 1.00 A25 0.27 0.62 0.40 0.48 0.66 0.38 0.23 0.29 -0.14 0.91 0.26 -0.19 0.62 0.60 -0.16 0.66 -0.18 0.49 -0.11 0.60 0.31 -0.04 -0.24 -0.16 1.00 A26 -0.18 -0.25 -0.15 0.10 -0.02 -0.08 -0.06 0.54 -0.18 -0.20 -0.17 -0.21 0.12 0.01 0.88 0.24 0.55 0.08 0.04 0.37 -0.10 0.53 -0.07 0.95 -0.17 1.00 A27 -0.16 -0.28 -0.22 0.26 -0.03 0.03 0.05 0.32 -0.02 -0.19 -0.14 -0.07 0.05 -0.10 0.54 0.10 0.55 -0.02 0.05 0.25 -0.13 0.68 -0.07 0.66 -0.16 0.72 1.00 A28 0.20 0.75 0.77 0.41 0.42 0.46 0.57 0.27 -0.11 0.53 0.51 -0.14 0.51 0.38 -0.22 0.40 -0.05 0.85 -0.07 0.55 0.52 -0.01 -0.29 -0.19 0.56 -0.18 -0.15 1.00 A29 0.11 0.38 0.36 0.52 0.41 0.14 0.14 0.68 -0.10 0.49 0.17 -0.20 0.73 0.53 0.29 0.76 0.01 0.62 0.20 0.78 0.09 0.13 -0.24 0.33 0.59 0.37 0.19 0.48 1.00 A30 0.09 0.44 0.20 0.39 0.70 0.28 0.05 0.32 -0.16 0.84 0.13 -0.18 0.56 0.76 -0.04 0.72 -0.23 0.40 0.00 0.53 0.12 -0.08 -0.21 -0.06 0.84 -0.07 -0.10 0.44 0.55 1.00 A31 0.32 0.81 0.77 0.41 0.53 0.51 0.56 0.27 -0.08 0.55 0.53 -0.15 0.54 0.41 -0.20 0.45 -0.05 0.84 -0.06 0.59 0.58 0.02 -0.23 -0.18 0.66 -0.13 -0.14 0.91 0.53 0.46 1.00 A32 0.13 0.54 0.51 0.13 0.37 0.42 0.50 -0.04 -0.16 0.28 0.44 -0.14 0.30 0.23 -0.17 0.26 0.23 0.49 -0.21 0.34 0.54 -0.05 -0.12 -0.11 0.36 -0.15 -0.15 0.53 0.11 0.17 0.47 1.00 A33 0.32 0.65 0.70 0.34 0.35 0.45 0.44 0.08 0.07 0.26 0.83 0.04 0.46 0.15 -0.22 0.17 0.12 0.54 0.01 0.34 0.76 -0.04 -0.20 -0.19 0.33 -0.19 -0.16 0.59 0.18 0.19 0.57 0.46 1.00 A34 -0.10 -0.28 -0.21 -0.09 -0.29 -0.15 0.03 -0.19 0.10 -0.24 -0.18 0.06 -0.24 -0.18 -0.04 -0.18 0.24 -0.21 0.09 -0.21 -0.14 0.02 0.98 0.02 -0.27 -0.01 0.00 -0.30 -0.21 -0.24 -0.24 -0.12 -0.21 1.00 A35 -0.04 -0.11 0.01 0.10 -0.01 -0.12 -0.09 -0.10 0.75 -0.20 0.16 0.78 0.16 -0.11 -0.15 -0.14 -0.11 -0.02 0.56 -0.23 -0.09 -0.11 0.14 -0.16 -0.17 -0.19 -0.04 -0.05 -0.10 -0.16 -0.09 -0.10 0.09 0.17 1.00 A36 0.04 0.44 0.46 0.44 0.51 0.55 0.37 0.27 -0.07 0.43 0.60 -0.07 0.55 0.28 0.02 0.44 0.24 0.57 0.00 0.64 0.70 0.28 -0.16 0.06 0.47 0.10 0.09 0.48 0.36 0.36 0.57 0.40 0.65 -0.14 0.00 1.00 A37 0.10 0.47 0.49 0.25 0.35 0.60 0.31 0.10 -0.05 0.33 0.60 -0.10 0.33 0.14 -0.16 0.22 0.13 0.58 -0.05 0.47 0.77 0.06 -0.18 -0.12 0.38 -0.08 -0.10 0.47 0.19 0.21 0.56 0.44 0.63 -0.17 -0.04 0.80 1.00 A38 0.03 0.53 0.33 0.53 0.66 0.41 0.20 0.37 -0.16 0.88 0.22 -0.21 0.61 0.65 -0.07 0.72 -0.18 0.51 -0.03 0.67 0.26 0.03 -0.25 -0.06 0.93 -0.06 -0.04 0.56 0.64 0.87 0.59 0.29 0.33 -0.27 -0.19 0.50 0.32 1.00 A39 0.03 0.29 0.09 0.50 0.49 0.38 0.22 0.40 -0.14 0.58 0.10 -0.14 0.48 0.52 0.20 0.61 0.09 0.35 -0.05 0.66 0.11 0.52 -0.16 0.20 0.66 0.25 0.35 0.34 0.52 0.59 0.38 0.17 0.17 -0.14 -0.11 0.52 0.23 0.73 1.00 A40 0.17 0.49 0.29 0.46 0.64 0.32 0.17 0.45 -0.16 0.86 0.21 -0.20 0.67 0.67 0.05 0.78 -0.12 0.48 0.04 0.70 0.17 0.04 -0.24 0.03 0.90 0.06 -0.04 0.50 0.72 0.87 0.54 0.23 0.26 -0.25 -0.18 0.48 0.28 0.94 0.73 1.00 A41 0.00 -0.26 -0.19 0.01 -0.29 -0.19 -0.05 -0.11 0.24 -0.22 -0.13 0.17 -0.11 -0.14 -0.02 -0.12 0.18 -0.21 0.19 -0.24 -0.17 -0.06 0.81 0.02 -0.26 -0.02 0.05 -0.30 -0.15 -0.21 -0.24 -0.18 -0.13 0.84 0.30 -0.11 -0.15 -0.25 -0.14 -0.22 1.00 A42 -0.05 0.41 0.39 0.36 0.59 0.25 0.27 0.30 -0.09 0.45 0.23 -0.14 0.59 0.54 0.07 0.71 0.23 0.49 0.10 0.64 0.31 0.09 -0.16 0.17 0.55 0.14 0.13 0.48 0.49 0.55 0.48 0.63 0.30 -0.13 -0.05 0.48 0.32 0.56 0.48 0.55 -0.13 1.00 A43 -0.04 -0.10 -0.06 0.28 -0.08 -0.10 -0.15 0.08 0.59 -0.10 0.17 0.42 0.26 -0.02 -0.06 0.11 -0.02 -0.01 0.48 -0.01 -0.09 -0.06 0.30 -0.05 -0.02 -0.06 0.12 -0.05 0.07 -0.04 -0.05 -0.12 0.11 0.31 0.64 0.08 0.04 -0.05 -0.01 -0.02 0.52 0.07 1.00 A44 -0.06 0.29 0.33 0.45 0.49 0.19 0.15 0.60 -0.06 0.32 0.22 -0.14 0.66 0.56 0.31 0.73 0.14 0.61 0.27 0.85 0.16 0.27 -0.18 0.40 0.45 0.43 0.20 0.48 0.83 0.46 0.50 0.20 0.25 -0.15 -0.07 0.44 0.30 0.55 0.52 0.61 -0.14 0.60 0.07 1.00 A45 0.01 0.11 0.13 0.24 0.05 -0.02 -0.01 0.05 0.69 -0.01 0.28 0.72 0.36 0.09 -0.14 0.13 -0.16 0.22 0.51 0.02 -0.01 -0.14 0.03 -0.14 0.05 -0.17 -0.06 0.12 0.09 0.02 0.12 0.03 0.21 0.03 0.86 0.09 0.03 0.03 0.01 0.02 0.25 0.10 0.60 0.11 1.00 A46 0.14 0.38 0.21 0.40 0.67 0.32 0.08 0.33 -0.17 0.88 0.13 -0.19 0.59 0.69 -0.07 0.70 -0.23 0.38 -0.06 0.59 0.17 -0.01 -0.22 -0.10 0.92 -0.10 -0.09 0.46 0.56 0.91 0.49 0.20 0.20 -0.24 -0.19 0.42 0.28 0.92 0.70 0.91 -0.23 0.50 -0.04 0.45 0.00 1.00 A47 -0.14 -0.20 -0.09 0.14 0.03 -0.06 0.14 0.24 -0.17 -0.22 -0.03 -0.19 0.08 -0.09 0.60 0.18 0.82 0.07 -0.09 0.31 0.06 0.60 0.01 0.82 -0.20 0.83 0.70 -0.14 0.19 -0.14 -0.11 0.02 -0.09 0.07 -0.16 0.22 -0.01 -0.11 0.17 -0.06 0.02 0.16 -0.08 0.28 -0.18 -0.17 1.00 A48 -0.11 0.22 0.24 0.37 0.44 0.13 -0.02 0.66 -0.07 0.34 0.11 -0.15 0.61 0.52 0.41 0.75 0.04 0.50 0.27 0.80 0.09 0.18 -0.19 0.44 0.42 0.46 0.26 0.40 0.82 0.47 0.41 0.08 0.13 -0.16 -0.09 0.39 0.20 0.55 0.47 0.58 -0.11 0.57 0.13 0.91 0.10 0.47 0.23 1.00 A49 0.04 0.45 0.36 0.39 0.69 0.29 0.18 0.42 -0.09 0.69 0.16 -0.17 0.66 0.87 -0.04 0.76 -0.21 0.49 0.13 0.68 0.14 0.00 -0.23 -0.02 0.75 -0.02 -0.10 0.52 0.70 0.80 0.55 0.27 0.25 -0.25 -0.12 0.40 0.23 0.77 0.58 0.82 -0.22 0.62 0.00 0.70 0.11 0.78 -0.13 0.68 1.00 A50 -0.09 0.26 0.21 0.46 0.50 0.23 0.00 0.66 -0.03 0.46 0.17 -0.11 0.69 0.64 0.40 0.78 -0.06 0.45 0.30 0.81 0.10 0.18 -0.18 0.39 0.58 0.38 0.16 0.39 0.80 0.60 0.43 0.15 0.22 -0.17 -0.08 0.47 0.24 0.68 0.66 0.73 -0.11 0.57 0.13 0.86 0.16 0.63 0.16 0.89 0.76 1.00 A51 -0.18 -0.27 -0.22 0.01 -0.08 -0.12 -0.14 0.48 -0.16 -0.17 -0.18 -0.18 0.10 0.02 0.95 0.18 0.39 -0.04 0.05 0.26 -0.14 0.36 -0.05 0.91 -0.16 0.87 0.54 -0.22 0.22 -0.06 -0.20 -0.15 -0.21 0.00 -0.16 0.02 -0.15 -0.07 0.18 0.02 0.00 0.06 -0.07 0.27 -0.16 -0.08 0.66 0.39 -0.05 0.31 1.00 A52 0.12 0.46 0.54 0.18 0.36 0.52 0.45 0.04 -0.18 0.26 0.53 -0.16 0.26 -0.01 -0.14 0.12 0.32 0.44 -0.25 0.38 0.71 0.16 -0.20 -0.04 0.31 -0.05 -0.02 0.46 0.10 0.08 0.46 0.47 0.68 -0.18 -0.17 0.64 0.80 0.23 0.18 0.22 -0.23 0.28 -0.10 0.18 -0.09 0.12 0.10 0.05 0.17 0.10 -0.10 1.00 A53 0.03 0.00 0.04 0.18 0.06 -0.14 -0.13 0.02 0.75 -0.07 0.22 0.72 0.34 0.04 -0.13 0.06 -0.15 0.03 0.61 -0.06 -0.08 -0.14 0.14 -0.15 -0.03 -0.18 -0.04 -0.02 0.09 -0.05 0.01 -0.09 0.15 0.11 0.83 0.09 0.04 -0.04 -0.03 -0.06 0.41 0.02 0.76 0.06 0.82 -0.05 -0.18 0.10 0.02 0.12 -0.16 -0.14 1.00 A54 -0.11 0.22 0.23 0.38 0.39 0.04 0.06 0.69 -0.09 0.35 0.09 -0.16 0.63 0.58 0.42 0.73 0.08 0.48 0.25 0.77 0.05 0.23 -0.20 0.46 0.39 0.49 0.27 0.35 0.83 0.51 0.39 0.09 0.16 -0.16 -0.10 0.37 0.19 0.54 0.52 0.61 -0.11 0.56 0.06 0.91 0.07 0.45 0.30 0.97 0.65 0.88 0.40 0.06 0.05 1.00 A55 -0.03 0.32 0.27 0.15 0.24 0.17 0.38 0.01 -0.20 0.07 0.22 -0.21 0.20 0.18 0.00 0.21 0.49 0.30 -0.21 0.40 0.46 0.27 -0.08 0.19 0.18 0.20 0.18 0.30 0.20 0.08 0.32 0.67 0.31 -0.06 -0.17 0.31 0.32 0.15 0.20 0.15 -0.10 0.58 -0.13 0.27 -0.09 0.16 0.38 0.16 0.15 0.14 0.08 0.35 -0.14 0.15 1.00 A56 -0.07 0.20 0.26 0.44 0.42 0.15 0.11 0.64 0.01 0.29 0.20 -0.09 0.64 0.51 0.37 0.74 0.06 0.49 0.35 0.75 0.03 0.17 -0.16 0.43 0.36 0.41 0.22 0.37 0.83 0.45 0.35 0.08 0.16 -0.16 -0.03 0.35 0.17 0.47 0.43 0.56 -0.10 0.51 0.11 0.91 0.16 0.44 0.26 0.95 0.63 0.85 0.35 0.05 0.10 0.95 0.17 1.00 A57 -0.13 -0.09 0.04 0.22 0.12 -0.02 0.10 0.49 -0.17 -0.10 -0.03 -0.23 0.26 0.09 0.67 0.36 0.65 0.25 0.08 0.51 0.08 0.48 -0.04 0.83 -0.05 0.85 0.67 0.04 0.48 0.01 0.07 0.00 -0.03 -0.01 -0.16 0.24 0.01 0.07 0.25 0.15 0.02 0.32 -0.01 0.52 -0.10 -0.03 0.85 0.56 0.11 0.39 0.69 0.07 -0.13 0.54 0.33 0.50 1.00 A58 0.00 0.43 0.23 0.38 0.69 0.25 0.10 0.24 -0.16 0.86 0.16 -0.14 0.54 0.76 -0.13 0.68 -0.27 0.34 -0.06 0.48 0.16 -0.13 -0.20 -0.17 0.84 -0.18 -0.20 0.46 0.49 0.89 0.45 0.32 0.21 -0.23 -0.14 0.37 0.21 0.84 0.64 0.85 -0.20 0.55 -0.05 0.41 0.04 0.89 -0.25 0.42 0.81 0.56 -0.12 0.16 -0.01 0.41 0.11 0.33 -0.10 1.00 A59 -0.08 -0.25 -0.20 -0.09 -0.27 -0.15 -0.03 -0.21 0.17 -0.22 -0.13 0.08 -0.20 -0.15 -0.08 -0.19 0.15 -0.23 0.09 -0.22 -0.20 -0.03 0.89 -0.03 -0.24 -0.05 -0.03 -0.28 -0.19 -0.21 -0.26 -0.15 -0.18 0.87 0.19 -0.17 -0.16 -0.24 -0.14 -0.25 0.83 -0.14 0.42 -0.18 0.11 -0.21 0.00 -0.17 -0.23 -0.17 -0.05 -0.18 0.24 -0.16 -0.10 -0.14 -0.01 -0.21 1.00 A60 -0.07 -0.15 -0.08 0.07 -0.13 -0.17 -0.17 -0.03 0.92 -0.20 0.12 0.80 0.16 -0.06 -0.12 0.00 -0.15 -0.06 0.60 -0.11 -0.17 -0.12 0.09 -0.12 -0.16 -0.14 -0.01 -0.10 -0.01 -0.14 -0.13 -0.15 0.05 0.09 0.76 -0.01 -0.02 -0.17 -0.13 -0.13 0.39 -0.04 0.75 -0.01 0.73 -0.17 -0.15 0.04 -0.08 0.01 -0.14 -0.19 0.84 0.01 -0.19 0.01 -0.11 -0.14 0.21 1.00 A61 -0.18 -0.28 -0.21 0.01 -0.02 -0.11 -0.06 0.40 -0.16 -0.22 -0.16 -0.18 0.04 -0.06 0.89 0.17 0.50 -0.03 -0.01 0.21 -0.09 0.47 -0.01 0.95 -0.21 0.92 0.55 -0.25 0.19 -0.10 -0.21 -0.14 -0.20 0.04 -0.15 0.04 -0.12 -0.12 0.15 -0.05 0.02 0.09 -0.06 0.27 -0.17 -0.14 0.77 0.32 -0.12 0.28 0.95 -0.07 -0.17 0.36 0.15 0.31 0.71 -0.20 -0.03 -0.14 1.00 A62 -0.16 -0.26 -0.20 0.03 -0.01 -0.12 -0.10 0.39 -0.16 -0.18 -0.15 -0.17 0.08 -0.02 0.90 0.13 0.49 -0.03 0.00 0.24 -0.10 0.38 -0.01 0.94 -0.18 0.89 0.63 -0.21 0.25 -0.07 -0.21 -0.11 -0.19 0.02 -0.15 0.01 -0.12 -0.10 0.13 -0.01 0.03 0.11 -0.07 0.29 -0.16 -0.09 0.70 0.34 -0.07 0.30 0.96 -0.05 -0.15 0.38 0.15 0.32 0.66 -0.18 -0.03 -0.12 0.98 1.00 A63 -0.19 -0.21 -0.14 0.12 0.03 -0.05 0.07 0.36 -0.17 -0.19 -0.10 -0.20 0.04 -0.02 0.71 0.17 0.72 0.09 -0.01 0.38 -0.01 0.61 -0.04 0.87 -0.14 0.87 0.73 -0.12 0.27 -0.11 -0.12 -0.05 -0.12 0.04 -0.17 0.09 -0.03 -0.06 0.30 0.00 0.01 0.18 -0.05 0.34 -0.17 -0.09 0.95 0.37 -0.04 0.28 0.76 0.08 -0.19 0.38 0.31 0.35 0.87 -0.17 -0.04 -0.17 0.81 0.79 1.00 A64 0.03 0.43 0.30 0.43 0.67 0.26 0.15 0.51 -0.21 0.68 0.25 -0.24 0.69 0.68 0.13 0.81 -0.10 0.52 0.10 0.79 0.21 0.16 -0.28 0.16 0.75 0.16 0.04 0.50 0.74 0.79 0.51 0.19 0.21 -0.29 -0.20 0.49 0.30 0.82 0.69 0.87 -0.26 0.61 -0.05 0.72 0.02 0.79 0.06 0.73 0.83 0.83 0.13 0.19 -0.05 0.73 0.23 0.71 0.28 0.72 -0.28 -0.13 0.08 0.08 0.10 1.00 A65 -0.17 -0.27 -0.21 0.01 -0.09 -0.11 -0.08 0.42 -0.14 -0.23 -0.17 -0.16 0.05 -0.02 0.89 0.13 0.48 -0.05 0.06 0.24 -0.11 0.42 -0.03 0.94 -0.21 0.89 0.57 -0.24 0.20 -0.11 -0.21 -0.13 -0.18 0.03 -0.14 0.03 -0.16 -0.14 0.17 -0.01 0.03 0.06 -0.05 0.25 -0.16 -0.14 0.73 0.33 -0.10 0.27 0.96 -0.06 -0.15 0.35 0.16 0.30 0.79 -0.19 0.00 -0.12 0.98 0.96 0.82 0.08 1.00 A66 0.01 -0.13 -0.03 0.24 -0.03 -0.16 -0.13 0.06 0.69 -0.12 0.11 0.74 0.30 0.04 -0.04 0.04 -0.08 0.05 0.75 -0.06 -0.16 -0.08 0.25 -0.02 -0.15 -0.04 0.02 -0.09 0.08 -0.07 -0.11 -0.14 0.04 0.27 0.70 0.03 -0.09 -0.08 -0.01 -0.03 0.40 0.02 0.75 0.11 0.63 -0.10 -0.07 0.10 0.03 0.12 -0.05 -0.21 0.84 0.15 -0.16 0.16 0.01 -0.05 0.29 0.66 -0.06 -0.04 -0.07 -0.01 -0.04 1.00 A67 -0.20 -0.31 -0.20 -0.02 -0.10 -0.11 -0.09 0.39 -0.16 -0.27 -0.13 -0.20 0.03 -0.06 0.81 0.14 0.56 0.01 0.04 0.30 -0.07 0.47 0.01 0.96 -0.22 0.92 0.58 -0.24 0.22 -0.14 -0.21 -0.11 -0.23 0.05 -0.15 0.07 -0.08 -0.11 0.12 -0.04 0.01 0.05 -0.08 0.32 -0.17 -0.16 0.83 0.34 -0.13 0.29 0.88 -0.09 -0.14 0.33 0.17 0.29 0.79 -0.23 -0.01 -0.11 0.94 0.90 0.91 0.03 0.92 -0.10 1.00 A68 -0.18 -0.14 -0.02 0.15 0.12 -0.01 0.07 0.38 -0.23 -0.06 -0.05 -0.26 0.16 0.04 0.63 0.29 0.65 0.14 -0.09 0.44 0.06 0.89 -0.09 0.80 -0.05 0.81 0.67 -0.10 0.30 -0.02 -0.04 0.01 -0.07 -0.05 -0.25 0.23 0.07 0.04 0.28 0.10 -0.05 0.25 -0.16 0.40 -0.20 -0.01 0.84 0.39 0.01 0.31 0.68 0.12 -0.22 0.41 0.29 0.37 0.79 -0.09 -0.09 -0.21 0.71 0.72 0.85 0.17 0.71 -0.14 0.79 1.00
4.2 Factor Analysis
The next step is factor analysis, which is often used in reducing variables to manageable
dimensions. These variables in each reduced criterion have similar information structure and
the whole data became easy to analyze.
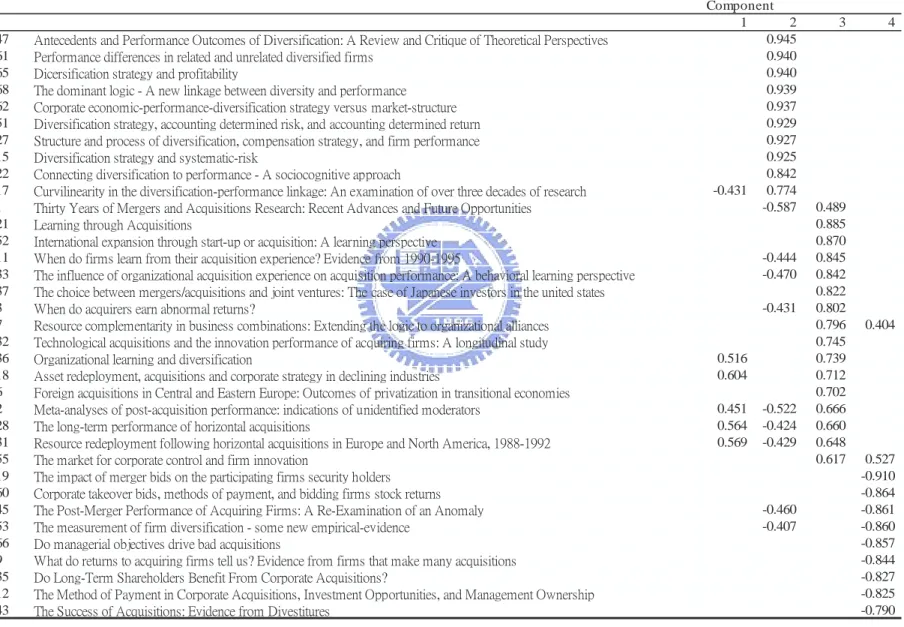
In this study, four factors have been extracted out with principle component analysis and
varimax rotation. Table 4 represents the factor loadings related to each document. The higher
the factor loading, the greater influence this document contributes to that factor. Besides,
documents with more than 0.9 loadings are considered as main components of each factor.
Moreover, those loadings less than 0.4 would be regarded as less contribution. Thus,
documents with factor loadings between ±0.4 are eliminated from the table. The whole result
explains 93.2 percent of the total variance, where factor 1 and 2 account for more than 75
percent (Table 4). In conclusion, all the documents contained in each factor perform very high
loadings.
Table 4. Explanation of Total Variance
Extracted Components Eigenvalues % of Variance Accounted For Cumulative Variance 1 31.91 46.93 46.93 2 19.92 29.30 76.23 3 8.49 12.49 88.72 4 3.03 4.46 93.18
After summarizing from the prior studies, we named each factor with M&As-related,
diversification, organizational learning perspective, and finance-related. Factor 1 represents
all researches related to M&As itself. This factor includes the merger motivation, factors that
affect M&As performance, and the effects for the acquiring and acquired corporation. Some
studies also discussed the relationship between top managers and the merger performance.
21
factor.
In contrast to factor 1, documents in factor 2 are related to diversification activities. In
this factor, M&As is considered as a means of the diversification. It contains performance
issues, causes, and the process of diversification. Factor 3 indicates the organizational
learning perspective from past M&As affairs. This factor also involves the comparison
between start-ups and M&As corporations from a learning perspective. Finally, factor 4
represents the financial issues of M&As. The issues in this factor are about measurement of
M&As performance, and volatility of stock price after M&As activities.
Besides these factors, other interesting results also come out from our analysis. First,
several documents load on more than one factor. For documents that load positively on more
than one factor represent a bridge between these factors. They link the concepts between two
factors, especially for factor 1 and factor 3. This phenomenon also tells us that some
researches provide a special attention in inter-relationship between two research territories.
Second, documents with negative loading indicate a reverse relationship the other works
expressed by that factor. It shows that whenever researchers cite these documents with
positive loadings in a given factor, they would not cite those documents with negative
loadings within the same factor (Acedo, etc, 2006).
Another result is shown on Table 5. When we rank the documents according to
publication year, the evolution of M&As has been discovered. In the early 1980s, M&As was
a growing strategy studied in the field of diversification (factor 2). This suggests that M&As
was a special issue of diversification. Latter in the middle of 1980s to 2000, M&As was
largely discussed by researchers, and then emerged as a popular field in strategic management.
Table 5. Factor Analysis
Factor analysis
Component
1 2 3 4 A16 Merger Motives and Merger Prescriptions 0.974 A50 Mergers and the performance of the acquisitions 0.974 A29 Value creation in acquisitions - A reexamination of performance issues 0.953 A64 Corporate Acquisitions: A Process Perspective 0.950 A14 Doing a Deal: Merger and Acquisition Negotiations and Their Impact Upon Target Company Top Management Turnover 0.922 A49 Top Management Turnover Following Mergers and Acquisitions 0.918 A48 Merger Strategies and Stockholder Value 0.910 A40 Cultural Differences and Shareholder Value in Related Mergers: Linking Equity and Human Capital 0.909 A44 Returns to Bidding Firms in Mergers and Acquisitions: Reconsidering the Relatedness Hypothesis 0.908 A56 Corporate acquisition strategies and economic performance 0.902 A54 Types of Synergy and Economic Value: The Impact of Acquisitions on Merging and Rival Firms 0.899 A30 Relative Standing: A Framework for Understanding Departures of Acquired Executives 0.881 A13 Factors Influencing Wealth Creation from Mergers and Acquisitions: A Meta-Analysis 0.879 A39 Conjectures on cognitive simplification in acquisition and divestment decision - making 0.865 A38 Organizational Fit and Acquisition Performance: Effects of Post-Acquisition Integration 0.862 A46 Acculturation in Mergers and Acquisitions 0.862 A20 Synergies and Post-Acquisition Performance: Differences versus Similarities in Resource Allocations 0.855 A58 Communication with Employees following a Merger: A Longitudinal Field Experiment 0.828 -0.466 A42 Effects of acquisitions on research-and-development inputs and outputs 0.810 A5 Diversification and top management team complementarity: Is performance improved by merging similar or dissimilar teams? 0.804 A25 Determinants of Acquisition Integration Level: A Decision-Making Perspective 0.784 -0.462 A8 Corporate-mergers, stockholder diversification, and changes in systematic-risk 0.776 0.553 A10 Relative standing and the performance of recently acquired European firms 0.771 -0.488 A4 The performance impact of strategic similarity in horizontal mergers: Evidence from the US banking industry 0.758 A34 Explaining the diversification discount -0.685 -0.568 A23 Does Corporate Diversification Destroy Value? - -0.674 -0.566 A59 The cost of diversity: The diversification discount and inefficient investment -0.661 -0.578 A41 The value of diversification during the conglomerate merger wave -0.642 -0.581 A26 Diversification strategies, business cycles and economic-performance 0.961 A63 Research on corporate diversification - A snthesis 0.959 A57 The link between resources and type of diversification: Theory and evidence 0.958 A24 Dicersification and performance - Areexamination usinf a new two - dimensional conceptualization of diversity in firms 0.954
23
Table 5. Factor Analysis (cont.)
Factor analysis
Component
1 2 3 4
A47 Antecedents and Performance Outcomes of Diversification: A Review and Critique of Theoretical Perspectives 0.945
A61 Performance differences in related and unrelated diversified firms 0.940
A65 Dicersification strategy and profitability 0.940
A68 The dominant logic - A new linkage between diversity and performance 0.939
A62 Corporate economic-performance-diversification strategy versus market-structure 0.937
A51 Diversification strategy, accounting determined risk, and accounting determined return 0.929
A27 Structure and process of diversification, compensation strategy, and firm performance 0.927
A15 Diversification strategy and systematic-risk 0.925
A22 Connecting diversification to performance - A sociocognitive approach 0.842
A17 Curvilinearity in the diversification-performance linkage: An examination of over three decades of research -0.431 0.774
A1 Thirty Years of Mergers and Acquisitions Research: Recent Advances and Future Opportunities -0.587 0.489
A21 Learning through Acquisitions 0.885
A52 International expansion through start-up or acquisition: A learning perspective 0.870
A11 When do firms learn from their acquisition experience? Evidence from 1990-1995 -0.444 0.845
A33 The influence of organizational acquisition experience on acquisition performance: A behavioral learning perspective -0.470 0.842
A37 The choice between mergers/acquisitions and joint ventures: The case of Japanese investors in the united states 0.822
A3 When do acquirers earn abnormal returns? -0.431 0.802
A7 Resource complementarity in business combinations: Extending the logic to organizational alliances 0.796 0.404
A32 Technological acquisitions and the innovation performance of acquiring firms: A longitudinal study 0.745
A36 Organizational learning and diversification 0.516 0.739
A18 Asset redeployment, acquisitions and corporate strategy in declining industries 0.604 0.712
A6 Foreign acquisitions in Central and Eastern Europe: Outcomes of privatization in transitional economies 0.702
A2 Meta-analyses of post-acquisition performance: indications of unidentified moderators 0.451 -0.522 0.666
A28 The long-term performance of horizontal acquisitions 0.564 -0.424 0.660
A31 Resource redeployment following horizontal acquisitions in Europe and North America, 1988-1992 0.569 -0.429 0.648
A55 The market for corporate control and firm innovation 0.617 0.527
A19 The impact of merger bids on the participating firms security holders -0.910
A60 Corporate takeover bids, methods of payment, and bidding firms stock returns -0.864
A45 The Post-Merger Performance of Acquiring Firms: A Re-Examination of an Anomaly -0.460 -0.861
A53 The measurement of firm diversification - some new empirical-evidence -0.407 -0.860
A66 Do managerial objectives drive bad acquisitions -0.857
A9 What do returns to acquiring firms tell us? Evidence from firms that make many acquisitions -0.844
A35 Do Long-Term Shareholders Benefit From Corporate Acquisitions? -0.827
A12 The Method of Payment in Corporate Acquisitions, Investment Opportunities, and Management Ownership -0.825
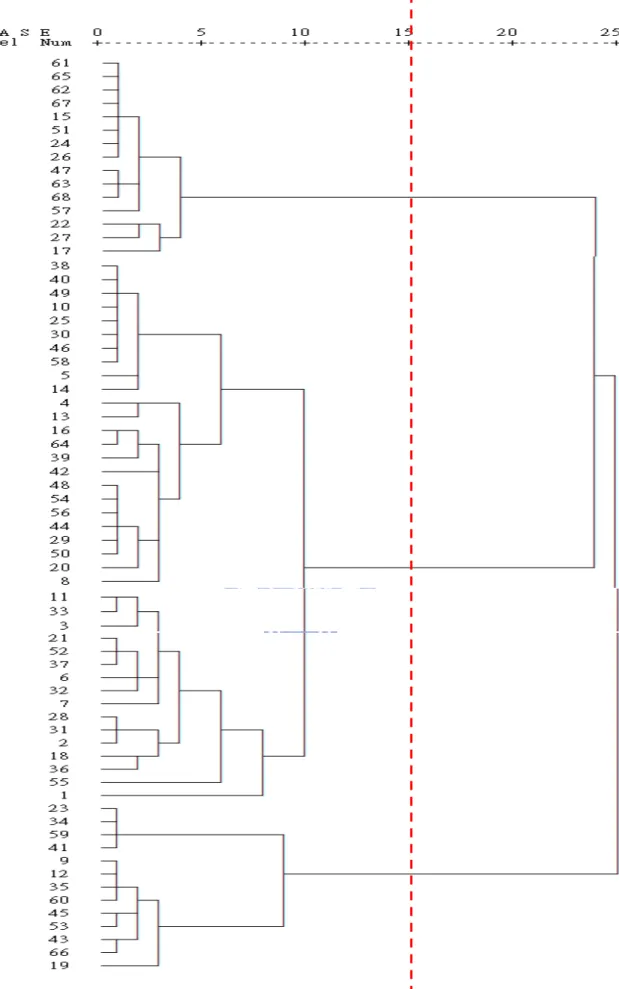
4.3 Cluster Analysis
To emphasize our result from factor analysis, cluster analysis provides another approach
to segment the core documents. Unlike other techniques for analyzing the relationships
between variables, cluster analysis groups the variables with their similarity. This method
starts with similar group of data, and attempted to classify it into homogeneous subgroups.
Therefore, cluster analysis shares some similarity with factor analysis. In this study, cluster
analysis is not only used for confirming our result from factor analysis, but also used to graph
later map of MDS.
We use average linkage method for cluster analysis. This method calculate the all
possible distance pair wisely rather than the nearest or the farthest neighbor. The result shown
in Figure 2 is similar to factor analysis. Groups from three to five are all acceptable, it
confirms our prior result from factor analysis. This diagram also helps us to analyze
25
4.4 Multidimensional Scaling (MDS)
A further insight for this research is proposed by multidimensional scaling analysis. In
contrast to factor analysis, MDS suggests a direction for measuring the construct
characteristics by individuals. These constructs are often connotatively and hard to measure
directly. Besides, similar items will be collected together on a perceptual map within MDS.
Therefore, a graphic view with clearly communities will be identified easily.
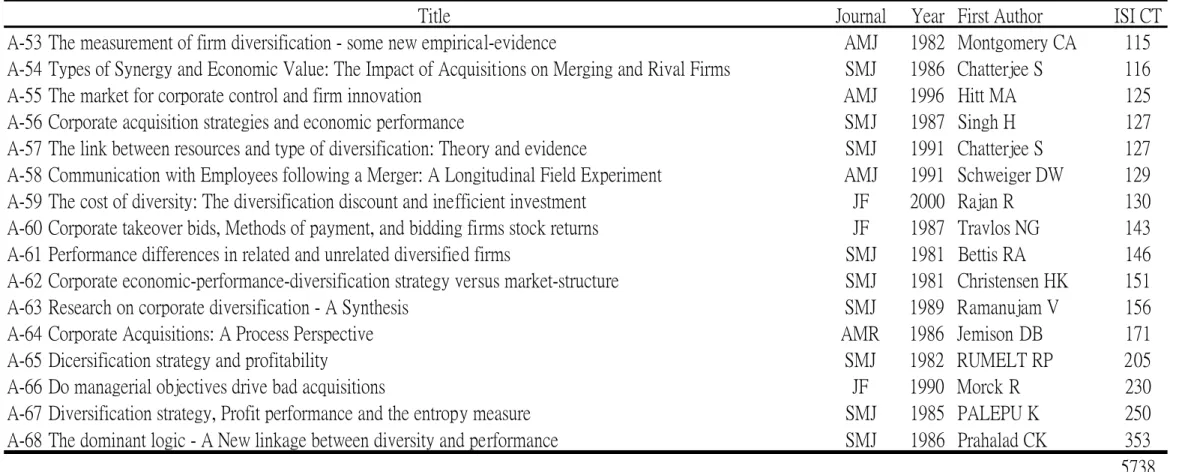
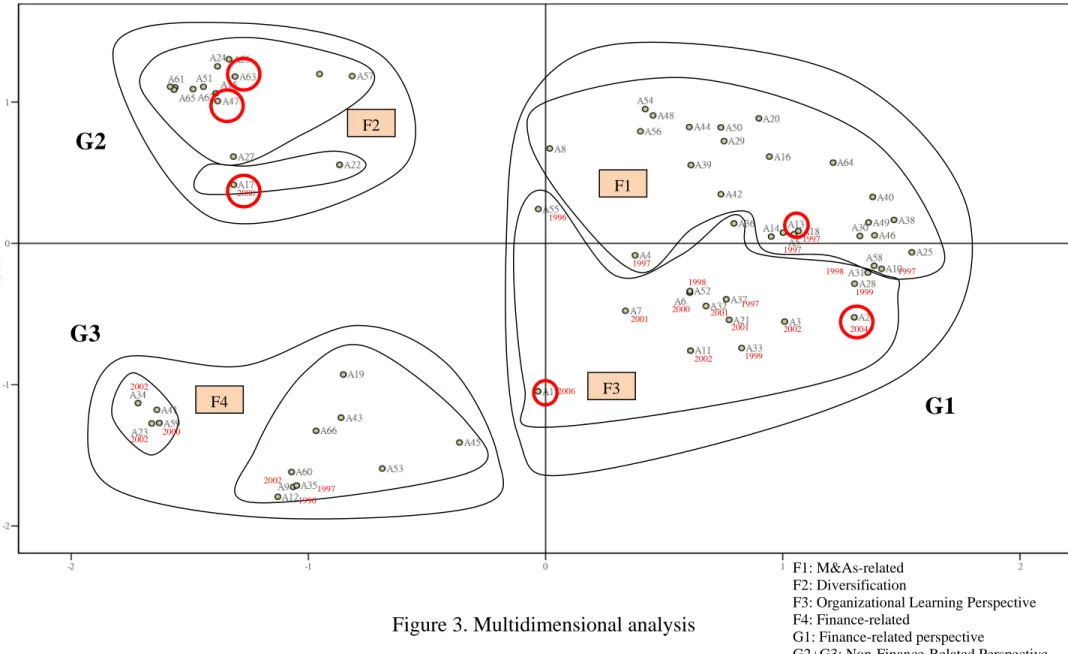
The graphic map in Figure 3 helps us to identify the documents easily. In Figure 3, for
comparison, we also marked out the four groups based on cluster analysis. Three phenomenon
are discussed as follows, and the stress value of MDS is 0.084, the r2 is 0.969, which indicates a perfect fit for our data.
First, the y-axis expresses a division of finance-related and non finance-related
perspective. For the communities on the left-hand side in Figure 3, G2 and G3 explore
diversification from a financial point of view. These studies discuss the relationship between
financial performance and diversification strategies. Most articles in our data base before year
1985 tried to find out the reasons why related mergers outperform unrelated diversifications.
For example, Bettis (1981) concluded that R&D expenditures are important factors for
acquisition performance. On the other hand Rumelt (1982) focused on the explanation
between success profitability and the degree of relatedness. Finally, Bettis (1982) also found
that related diversifications enjoy superior returns than unrelated ones may due to industry
effects. In addition, authors in this community also curious about the effects of diversification
strategy to corporate value. For example, Amit & Livnat (1988) indicates that related
diversification gains synergies from operating process, while unrelated diversification gains
27
diversification, methods of payment and the performance (Chtterjee and Wernerfelt, 1991;
Betti, 1981; Travlo, 1987; Martin, 1996). Public financial information such as ROA, ROE,
stock value, shareholder value, etc is usually used to evaluate the performance of
diversification. Besides,
Within the finance-related side, two subgroups, G2 and G3, can be divided along the
x-axis. Most documents in each subgroup is the same as factor analysis (factor 2 for G2 and
factor 4 for G3), only four documents from factor 1(A23, A34, A41, and A59) are categorized
to G3 in this analysis. These four articles gain negative factor loadings within factor 1 in
factor analysis. This phenomenon indicates that authors prefer not to concern financial
literatures when writing non-finance-related researches.
On the other side, the main character in group G1 is non-finance-related perspective.
Documents in this group discussed M&As from corporation internal resources view to
organizational perspective (Wals, 1988; Hitt, et. al., 1991). These articles focused on strategic
fit, organizational fit, and M&As process to find out main reasons for influencing the success
of M&As (Pennings, et. al., 1994; Ramaswamy, 1997; Datta, et. al., 1992; Walsh, 1989;
Hambrick and Chennella, 1993; Anand and Harbir, 1997). Research issues such as post-integration process, cultural difference between two firms, organization experience of
M&As activities and organizational learning are all included in this part (Pablo, 1994;
Chatterjee, et. al., 1992; Vermeulan, 2001). Besides, impact of M&As activities to top
management teams also revealed as one of the main subjects in M&As (Walsh, 1988; Walsh,
1989; Krishnan et.al., 1997).
Second, the finance-related perspective leads the main direction of M&As in the early
recent two decades. As shown in Table 7, most documents from G2 and G3 are published
during 1980 to 1990. Those published after 1990 and located in left side are usually giving a
review of past literatures (Cartwrigh and Schoenberg, 2006; Palich, et. al., 2000; Agrawal, et.
al., 1992). On the other hand, documents from G1 are published abundantly after year 1990.
Moreover, new articles after year 2000 are intensively located at the lower part of G1 (Figure
3), which indicates that the Resource-based perspective of organizational learning issue
became the new focus of M&As in recent years.
Finally, most scholars publish articles in one group, which represents that one researcher
generally master only in one field. As we can see from Figure 3, only our initial core paper
(A1) situated at the middle part of this map which proves that this paper performed a
connector between finance-related and non-finance-related perspectives. However, other
review articles are either located at the left side of G2 or at the right side of G1 (A2, A13, A17,
A47, A63). This phenomenon showed that authors may still focus on specific issue or territory
with particular perspective in reviewing articles.
To summarize, MDS exhibited an entire map of the thirty years development of M&As
researches. The left hand side groups focused on finance-related issues, while the right hand
side concentrated on non-finance-related issues. Specifically, the finance-related perspective
play an important role in the early ten years, and the non-finance-related perspective
demonstrates the main trend of M&As within these twenty years. Furthermore, the
corporation internal resources and organizational learning issues have become the new trend
of M&As after year 2000. Finally, our result also proves that co-citation analysis could
29
Figure 3. Multidimensional analysis
G2
G3
F1 F4 F2 F3G1
2002 1999 2006 1997 2000 2000 2002 2002 2002 1997 1996 1996 2000 2001 2001 2001 1999 2002 1998 2004 1998 1997 1997 1997 1997 F1: M&As-related F2: DiversificationF3: Organizational Learning Perspective F4: Finance-related
G1: Finance-related perspective
G2+G3: Non-Finance-Related Perspective : Review Literatures
Table 6. Multidimensional Analysis
G1 G2 G3 F1 F3 F2 F4
A-16 Trautwein F SMJ 1990 A-21 Vermeulen F AMJ 2001 A-26 AMIT R SMJ 1988 A-19 Asquith P JF 1982 A-50 Michael lubatkin AMR 1983 A-52 Barkerma HG AMJ 1998 A-63 Ramanujam V SMJ 1989 A-60 Travlos NG JF 1987 A-29 Seth A SMJ 1990 A-11 Hayward ML SMJ 2002 A-57 Chatterjee S SMJ 1991 A-45 Agrawal A JF 1992
A-64 Jemison DB AMR 1986 A-33 Haleblian J ASQ 1999 A-24 Varadarajan P AMJ 1987 A-53 Montgomery CA AMJ 1982 A-14 Walsh JP SMJ 1989 A-37 HENNART JF SMJ 1997 A-67 PALEPU K SMJ 1985 A-66 Morck R JF 1990 A-49 Walsh JP SMJ 1988 A-03 Capron L SMJ 2002 A-47 Hoskisson RE JM 1990 A-09 Fuller K JF 2002 A-48 Lubatkin M SMJ 1987 A-07 Harrison JS JM 2001 A-61 Bettis RA SMJ 1981 A-35 Loughran T JF 1997 A-40 Chatterjee S SMJ 1992 A-32 Ahuja G SMJ 2001 A-65 RUMELT RP SMJ 1982 A-12 Martin KJ JF 1996 A-44 Barney JB SMJ 1988 A-36 PENNINGS JM AMJ 1994 A-68 Prahalad CK SMJ 1986 A-43 Kaplan SN JF 1992 A-56 Singh H SMJ 1987 A-18 Anand J SMJ 1997 A-62 Christensen HK SMJ 1981
A-54 Chatterjee S SMJ 1986 A-06 Uhlenbruck K AMJ 2000 A-51 BETTIS RA AMJ 1982 A-30 Hambrick DC AMJ 1993 A-02 King DR SMJ 2004 A-27 Gomez-Mejia LR SMJ 1992 A-13 Datta DK SMJ 1992 A-28 Capron L SMJ 1999 A-15 Montgomery CA SMJ 1984 A-39 IRENE MD AMJ 1985 A-31 Capron L SMJ 1998 A-22 Ginsberg A AMR 1990 A-38 Datta DK SMJ 1991 A-55 Hitt MA AMJ 1996 A-17 Palich JE SMJ 2000
A-46 Nahavandi A AMJ 1988 A-01 Cartwright S BJM 2006 A-20 Harrison JS JM 1991 A-58 Schweiger DW AMJ 1991 A-42 HITT MA AMJ 1991 A-05 Krishnan HA SMJ 1997 A-25 Pablo AL AMJ 1994 A-08 Chatterjee S SMJ 1990 A-10 VERY P SMJ 1997 A-04 Ramaswamy K AMJ 1997 A-34 Campa JM JF 2002 A-23 Graham JR JF 2002 A-59 Rajan R JF 2000 A-41 Servaes H JF 1996
31
Table 7. Documents ranking by publication years
Year Factor Title
1981 G2 A61 Performance differences in related and unrelated diversified firms
1981 G2 A62 Corporate economic-performance-diversification strategy versus market-structure 1982 G2 A65 Diversification strategy and profitability
1982 G2 A51 Diversification strategy, accounting determined risk, and accounting determined return 1982 G3 A19 The impact of merger bids on the participating firms security holders
1982 G3 A53 The measurement of firm diversification - some new empirical-evidence
1983 G1 A50 MERGERS AND THE PERFORMANCE OF THE ACQUIRING FIRM
1984 G2 A15 DIVERSIFICATION STRATEGY AND SYSTEMATIC-RISK
1985 G1 A39 Conjectures on cognitive simplification in acquisition and divestment decision – making
1985 G2 A67 DIVERSIFICATION STRATEGY, PROFIT PERFORMANCE AND THE ENTROPY MEASURE
1986 G1 A64 Corporate Acquisitions: A Process Perspective
1986 G1 A54 Types of Synergy and Economic Value: The Impact of Acquisitions on Merging and Rival Firms
1986 G2 A68 THE DOMINANT LOGIC - A NEW LINKAGE BETWEEN DIVERSITY AND PERFORMANCE
1987 G1 A48 Merger Strategies and Stockholder Value
1987 G1 A56 Corporate acquisition strategies and economic performance
1987 G2 A24 Diversification and performance – A reexamination using a new two - dimensional conceptualization of diversity in firms
1987 G3 A60 CORPORATE TAKEOVER BIDS, METHODS OF PAYMENT, AND BIDDING FIRMS STOCK RETURNS
1988 G1 A49 Top Management Turnover Following Mergers and Acquisitions
1988 G1 A44 Returns to Bidding Firms in Mergers and Acquisitions: Reconsidering the Relatedness Hypothesis 1988 G1 A46 Acculturation in Mergers and Acquisitions
1988 G2 A26 DIVERSIFICATION STRATEGIES, BUSINESS CYCLES AND ECONOMIC-PERFORMANCE
1989 G1 A14 Doing a Deal: Merger and Acquisition Negotiations and Their Impact Upon Target Company Top Management Turnover
1989 G2 A63 RESEARCH ON CORPORATE DIVERSIFICATION - A SYNTHESIS
1990 G1 A16 Merger Motives and Merger Prescriptions
1990 G1 A29 VALUE CREATION IN ACQUISITIONS - A REEXAMINATION OF PERFORMANCE ISSUES
1990 G1 A08 CORPORATE-MERGERS, STOCKHOLDER DIVERSIFICATION, AND CHANGES IN SYSTEMATIC-RISK
1990 G2 A47 Antecedents and Performance Outcomes of Diversification: A Review and Critique of Theoretical Perspectives
1990 G2 A22 CONNECTING DIVERSIFICATION TO PERFORMANCE - A SOCIOCOGNITIVE APPROACH
1990 G3 A66 DO MANAGERIAL OBJECTIVES DRIVE BAD ACQUISITIONS
1991 G1 A38 Organizational Fit and Acquisition Performance: Effects of Post-Acquisition Integration
1991 G1 A20 Synergies and Post-Acquisition Performance: Differences versus Similarities in Resource Allocations 1991 G1 A58 Communication with Employees following a Merger: A Longitudinal Field Experiment
1991 G1 A42 EFFECTS OF ACQUISITIONS ON RESEARCH-AND-DEVELOPMENT INPUTS AND OUTPUTS
1991 G2 A57 The link between resources and type of diversification: Theory and evidence
1992 G1 A40 Cultural Differences and Shareholder Value in Related Mergers: Linking Equity and Human Capital 1992 G1 A13 Factors Influencing Wealth Creation from Mergers and Acquisitions: A Meta-Analysis
1992 G2 A27 Structure and process of diversification, compensation strategy, and firm performance 1992 G3 A45 The Post-Merger Performance of Acquiring Firms: A Re-Examination of an Anomaly 1992 G3 A43 The Success of Acquisitions: Evidence from Divestitures