Screening for depressive symptoms among older
adults in Taiwan: Cutoff of a short form of the Center
for Epidemiologic Studies Depression Scale
Ken-Fu Chang, Li-Jen Weng*
Department of Psychology, National Taiwan University, Taipei, Taiwan; *Corresponding Author: [email protected]
Received 10 January 2013; revised 15 February 2013; accepted 25 February 2013
ABSTRACT
Screening for elders at risk for depression is crucial for promoting mental health in later life. The present study investigates the cutoff score of a short form of the CES-D for screening of depressive symptoms in the elderly population of Taiwan. This particular short form of CES-D is repeatedly used in the Taiwan Longitudinal Study on Aging (TLSA), a national survey of represen- tative older adults in Taiwan, and is therefore referred to as the TLSA form. Data collected from five waves of TLSA were analyzed in this study. Participant responses repeatedly meas- ured in 1989 and 1993 were used to identify a cutoff for the TLSA form of the CES-D with sen- sitivity and specificity using the cutoff of 4 on the Boston form of the CES-D as the criterion. Longitudinal data from the years 1996, 1999, and 2003 were used to validate the proposed cutoff by comparing the prevalence rates for depres-sive symptoms among older Taiwanese esti-mated from the identified cutoff and reported in previous studies. The score of 10 on the TLSA form of the CES-D was suggested, yielding a specificity of 0.93 and a sensitivity of approxi-mately 0.96. The estimated prevalence rates for depressive symptoms among Taiwanese elders based on the suggested cutoff were between 18.9% and 23.7%, which are similar to previously reported rates. The cutoff score of 10 on the TLSA form of the CES-D is therefore recom-mended for screening depressive symptoms among older adults in Taiwan.
Keywords:CES-D; Cutoff; Depressive Symptoms; Older Adults; Screening; Taiwan Longitudinal Study on Aging
1. INTRODUCTION
Depression is one of the most common mental health
problems in later life. Yet, depression and depressive symptoms in older adults are often under-identified by both clinical professionals and laypersons. Depressive symptoms can be mistaken as normal aging processes and downplayed by older people themselves [1]. These symptoms may also be neglected because the syndromes manifested among elders can differ from those described in the Diagnostic and Statistical Manual [2]. Neverthe- less, it is highly impractical to administer clinical diag- nostic interviews to the entire old population to screen for probable depressed elders due to the high cost re- quired. Instead, a convenient screening instrument would be of supreme value [3]. A short form of the Center for Epidemiologic Studies Depression Scale (CES-D Scale) [4] has been frequently used in national surveys of elders in Taiwan and can serve as an effective device. Because the items of this short form of the CES-D differ from those of other previously developed short forms, a cutoff score must be determined. To the best of our knowledge, no research has established the cutoff score for this widely used scale in Taiwan. Therefore, the present study is designed to identify a cutoff score for this short form of the CES-D to screen for elders at risk for depres-sion so that further diagnostic interviews and necessary assistance can be provided in a timely manner.
The Taiwan Longitudinal Study on Aging (TLSA) is a nationally representative survey that was designed to examine the impact of socioeconomic development on the physical and emotional health of older adults in Tai- wan. Face-to-face interviews have been conducted by trained interviewers since 1989 under the sponsorship of the Bureau of Health Promotion at the Taiwan Depart- ment of Health. The TLSA sample, which was drawn from the household register, is representative of con- temporary institutionalized and non-institutionalized Taiwanese older adults aged 60 years and over [5]. The representativeness of the sample ensures the appropri- ateness of the statistical inferences made and secures the generalizability of the research findings. In addition, the longitudinal TLSA surveys were repeatedly conducted in
1989, 1993, 1996, 1999, 2003, and 2007, providing rich information on Taiwanese elders over a period of 18 years.
Modified CES-D scales have been adopted in the TLSA to evaluate the depressive symptoms of the inter- viewees. The original 20-item CES-D scale was devel- oped by Radloff for studies of the epidemiology of de- pressive symptomatology in general populations [4]. The outstanding psychometric properties of the scale among general populations have been demonstrated in many studies [6]. Notwithstanding its popularity in most set- tings, the CES-D presents potential problems for older respondents. Older respondents may perceive the length of time needed to complete the scale to be burdensome, consider the questions emotionally stressful, or be con- fused by the 4 - point response format [7]. Thus, several modified short forms, such as the Andresen form [8], Iowa form, and Boston form [9], have been developed.
However, as shown in Table 1, the items continually used in the TLSA differ from those of other short forms of the CES-D. Among the original 20 items, 10 of them have been repeatedly used across waves of the TLSA and in other national studies in Taiwan (e.g., the National Health Interview Survey, NHIS; the Social Environment and Biomarkers of Aging Study, SEBAS). This 10-item short form of the CES-D is thus called the TLSA form. A study of the cutoff for this particular form of the CES-D is needed to utilize the TLSA to promote the mental health of older citizens in Taiwan.
A number of studies have supported the use of the CES-D as a screening device for probable depression [10, 11]. To be qualified as a screening instrument, a test should demonstrate both high sensitivity and high speci- ficity [12]. Sensitivity refers to the probability that a per- son who has or will develop the illness under study will show a positive result on the test. Specificity repre- Table 1. Items of the original CES-D included in TLSA and several short forms of the CES-D.
Items of the Original CES-D TLSA 1989 TLSA 1993 = Form Iowa TLSA Form Boston Form Andresen Form I felt everything I did was an effort. X X X X X My sleep was restless. X X X X X I could not get “going”. X X X X X I did not feel like eating; my appetite was poor. X X X
I was bothered by things that don’t usually bother me. X X I had trouble keeping my mind on what I was doing. X X I talked less than usual. X
I felt depressed. X X X X X
I felt lonely. X X X X X
I felt sad. X X X X
I felt I could not shake off the blues. X
I felt fearful. X X
I thought my life had been a failure. X I had crying spells.
People were unfriendly. X X X X I felt that people disliked me. X X X
I was happy.a X X X X X
I enjoyed life.a X X X X
I felt hopeful about the future.a X
I felt as good as other people.a
Total number of items 17 11 10 10 10 CES-D = the Center for Epidemiologic Studies Depression Scale; TLSA = the Taiwan Longitudinal Study on Aging. a.Positive items. Items of the original
ES-D included in TLSA surveys and each short form of the CES-D were indicated by an X. C
sents the probability that a person who does not have the illness under study will obtain a negative result on the test. Commonly, the receiver operator characteristic (ROC) curve is used to examine the sensitivity and spe- cificity at different cutoff scores on the screening in- strument. The area under the ROC curve (AUC) repre- sents the degree of correct classification with the screen-ing tool. A larger AUC indicates a more efficient screen- ing device [13].
Various cutoff scores for forms of the CES-D have been proposed based on different criteria for identifying probable depression. For the original CES-D, Radloff proposed a cutoff score of 16 for Caucasian samples above 18 years old, yielding a sensitivity of 0.70 [4]. However, this cutoff was proposed for the general popu- lation rather than for elders in particular [4]. Research has shown that the manifestation of depression in elders, who generally display more somatic symptoms and cog-nitive impairments, differs from that in younger adults [14]. Accordingly, the cutoff for the general population may not be suitable for older adults.
Additional cutoffs for the original CES-D have been recommended to classify probable depressive elders [4]. Himmelfarb and Murrell used 20 as the cutoff for elders in the US and obtained a sensitivity of 0.70 [15]. Cheng and Chan used psychiatrist diagnosis over a range of clinically significant states of depression as the criterion and suggested a cutoff of 22 on the full CES-D for older Hong Kong Chinese individuals, yielding a sensitivity of 0.75, a specificity of 0.57, and an AUC of 0.68 [16]. Numerous studies have advocated these cutoff scores or suggested other cutoffs (e.g., 25 and 12) [11,17].
Cutoff scores on short forms of the CES-D have also been proposed. Andresen et al. suggested a threshold of 10 on the Andresen form for relatively healthy American adults aged 65 years and over, yielding a kappa coeffi- cient, sensitivity, and specificity of 0.97, 0.96, and 1.00, respectively [8]. Among a Chinese sample aged 70 years and over in Hong Kong, Boey echoed the finding of An- dresen et al. and reached the highest kappa coefficient of 0.84 using the cutoff of 10 on the Andresen form [18]. Cheng and Chan advocated a higher cut-point of 12 on the Andresen form for older Hong Kong Chinese, with a sensitivity of 0.76, a specificity of 0.55, and an AUC of 0.68 [16].
The Boston form is another popular short form of the CES-D. Each item on the 10-item Boston form is coded dichotomously, yielding a total score in the range of 0 to 10. Using middle-aged depressed patients who fulfilled the DSM-IV criteria for major depressive disorder [19] as the criterion, Irwin et al. set a cutoff of 4 to achieve a high sensitivity of 0.97 without much loss in specificity (0.84) [7]. They applied this cutoff to identify older adults with major depression and obtained a sensitivity
of 1.00 and a specificity of 0.93. Robison et al. used the criterion for major depression in the Composite Interna- tional Diagnostic Interview (CIDI) and obtained a sensi- tivity and specificity of 0.76 and 0.70, respectively, among middle-aged and older Puerto Rican primary care patients in the US based on the cutoff of 4 recom- mended by Irwin et al. [7,20] Further, a cut-point of 3 was recommended for the optimal combination of sensi- tivity (0.84) and specificity (0.64).
Although numerous cutoff scores for forms of the CES-D have been proposed, none have been suggested for the TLSA form used in Taiwan longitudinally. How- ever, research studies have used a cutoff of 10 for the TLSA form of the CES-D with no empirical evidence provided for its appropriateness (e.g., the Bureau of Health Promotion, Department of Health [5]; Ku et al. [21]). Therefore, the present study was designed to em- pirically identify a possible cutoff score for the TLSA form of the CES-D as a screening instrument for depres- sive symptoms among Taiwanese older adults.
2. METHODS
2.1. SampleThe initial sample of the TLSA, which has been col- lected since 1989, and the expanded sample set, which was added in 1996, were analyzed in this study. To focus on the old population in Taiwan, only participants aged 60 years and over at the time of data collection were in- cluded. Participant responses provided by proxy were excluded because depressive symptoms should be di- rectly reported by respondents. Data with missing re- sponses on any item of the Boston or TLSA form of the CES-D were also excluded. The sample analyzed con- sisted of 3797, 2930, 3281, 3213, and 3091 individuals in the year of 1989, 1993, 1996, 1999, and 2003, respec- tively. The 1989/1993 data were used to identify a poten- tial cutoff for the TLSA form of the CES-D, and the data from the other three years were used to validate the pro- posed cutoff score.
2.2. Instruments
Table 1 shows the CES-D items that were adopted in each wave of the TLSA and in other short forms of the CES-D. The TLSA form of the CES-D includes items that have been used in the TLSA since 1996. In 1989 and 1993, respondents were asked to rate the frequency with which they experienced the described situations or feel- ings in the past week on a 4-point scale (not at all = 0; rarely [less than one day] = 1; sometimes [1 - 4 days] = 2; often or chronically [5 - 7 days] = 3). In 1996, the fre- quency used on the scale was altered without explanation (not at all = 0; rarely [one day] = 1; sometimes [2 - 3
days] = 2; often or chronically [over 4 days] = 3). Posi- tive items, as marked in Table 1, were reversely coded. Higher scores on the scale represented more depressive symptoms.
2.3. Data Analysis
All the items included on the Boston form were as- sessed in the 1989 and 1993 surveys of the TLSA. There- fore, the 1989/1993 data were used to identify a cutoff for the TLSA form of the CES-D. The procedures pro- posed by Kohout et al. were followed to convert re- sponses on the original 4-point scale to the dichotomous scores of the 10 items on the Boston form of the CES-D [9]. Answers of 0 or 1 on the 4-point scale were coded as 0, representing “No descriptive symptoms revealed” on the Boston form, and responses of 2 or 3 were col- lapsed to form the response category of 1, representing “Much of the time” on the Boston form.
For the dichotomously coded Boston form of the CES- D, Irwin et al. recommended a cutoff of 4 and Robison et al. suggested a cutoff of 3 [7,20]. Separate ROC curves were obtained with the cutoffs of 3 and 4 against various scores on the TLSA form of the CES-D. The confidence intervals of the AUCs were computed to select the curve that led to a better overall performance, as indicated by a larger AUC [22]. Subsequently, the cutoff score on the TLSA form was identified by maximizing the combina-tion of sensitivity and specificity. To examine the classi-fication agreement between the Boston form and the TLSA form, as in Andresen et al. [8], the kappa coeffi-cients [23] were computed for different cutoffs. The kappa coefficient is a chance-corrected measure of agree- ment, with values greater than 0.75 representing excel- lent agreement beyond chance.
With the initial sample and the added sample appro- priately weighted, the 1996/1999/2003 data were used to estimate the prevalence rates for depressive symptoms among elder Taiwanese based on the identified cutoff score of the TLSA form. These prevalence rates were then compared to those found in previous studies to eval- uate the appropriateness of the suggested cutoff score. All the analyses were performed using SAS version 8.0 (SAS Institute, Cary, NC, USA).
3. RESULTS
Table 2 presents the characteristics of the samples used in this study. The samples had slightly more males than females. Approximately half of the samples were from respondents who were young-old (65 - 74 years) and had received a formal education for less than 6 years. The majority of the elders lived with spouses or partners, and one-quarter of the participants were widowed. Within each wave of the TLSA data analyzed, the par-
ticipants who were included in the present study were younger than those who were excluded. However, no difference was found in terms of gender, educational level, or marital status.
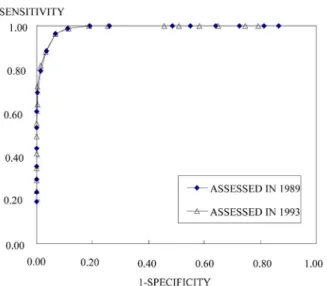
ROC curves based on the cutoffs of 3 and 4 on the Boston form against various scores on the TLSA form of the CES-D were conducted using the 1989/1993 TLSA data. As expected, the AUC from the cutoff of 4 was larger than that from the cutoff of 3 in both years. Therefore, only the ROC curves based on the cutoff score of 4 are presented in Figure 1. The 95% confi- dence intervals of the AUC for the ROC curves for 1989 and 1993 were (0.986, 0.991) and (0.987, 0.992), re- spectively. These curves were used to identify the cut- off for the TLSA form of the CES-D based on sensitivity and specificity.
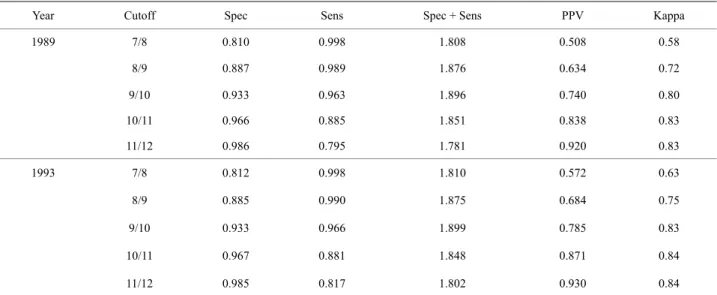
For both years, a cutoff score of 10 (i.e., 9/10 in Table 3) was recommended on the basis of its high specificities and sensitivities, short distances from the upper left cor- ner of the graph to the ROC curves, and satisfying kappa coefficients, as shown in Table 3. With the suggested cutoff score of 10, the prevalence rates for depressive symptoms among older adults in Taiwan were 23.7%, 20.9%, and 18.9% for years 1996, 1999, and 2003, re-spectively, as shown at the bottom of Table 2. These estimated prevalence rates fell in the range of those ob- tained in previous studies (34.8% for suburban samples in Lu et al.; 18.5%, 20.3%, and 25.8% for rural, semi- urban, and urban samples, respectively, in Chong et al.; 12.8% and 20.1% for rural and urban samples in Chiu et al.; 27.5% in Tsai et al.) [24-27].
4. DISCUSSION
This study aimed to identify a cutoff score for the 10- item TLSA form of the CES-D to screen for depressive symptoms among older adults in Taiwan. The TLSA form of the CES-D deserves research attention for two reasons. First, this particular short form of the CES-D differs from other short forms of the CES-D under study. Second, the TLSA short form has been frequently used in national surveys in Taiwan. A cutoff for this widely used short form will be of great value for mental health promotion in Taiwan. Using the cutoff of 4 on the Boston form of the CES-D as the criterion [7], the cutoff of 10 was proposed as the tentative cutoff score for the TLSA form of the CES-D on the basis of the ROC curves. The suggested cutoff was validated with preva- lence rates that were estimated in the present study and obtained in previous studies.
Although the prevalence rates that were estimated in the present study were comparable to those in previous studies, the prevalence rates for depressive symptoms varied across studies. Prevalence rate estimates could be affected by numerous factors [28], including the defini- Copyright © 2013 SciRes. Openly accessible at http://www.scirp.org/journal/health/
Table 2. Characteristics of the analyzed samples.
Survey Year in TLSA
1996 1999 2003 1989 1993
A B All A B All A B All
N 3797 2930 2377 904 2052 1161 1463 1628 Male (%) 57.5 56.9 56.0 53.1 54.7 55.4 51.9 53.4 54.6 50.2 51.5 Age (%) ≤64 37.5 6.6 0.0 69.5 31.6 0.0 53.0 29.3 0.0 40.7 28.9 65 - 74 47.0 69.6 66.4 30.5 50.1 47.8 47.0 47.4 9.8 59.2 44.8 75 - 84 14.3 21.6 30.3 0.0 16.5 45.9 0.0 20.5 80.7 0.1 23.6 ≥85 1.3 2.2 3.3 0.0 1.8 6.3 0.0 2.8 9.4 0.0 2.8 Education (%) Illiterate 40.2 39.5 37.7 26.4 32.6 36.2 28.1 31.7 33.6 27.7 29.4 ≤6 Years 40.4 41.4 41.9 51.6 46.3 42.4 50.7 47.0 43.0 49.5 47.6 7 - 12 Years 14.3 14.1 14.8 17.4 16.0 15.8 16.5 16.1 17.1 17.0 17.0 > 12 Years 5.1 5.1 5.6 4.7 5.2 5.7 4.8 5.2 6.3 5.8 5.9 Marital Status (%) With Spouse/Partner 63.8 63.3 60.2 76.8 67.7 56.1 77.6 68.0 51.2 76.8 69.4 Widowed 26.8 32.2 34.5 15.2 25.7 38.8 16.5 26.5 44.4 19.1 26.5 Separated/Divorced 5.7 1.0 1.6 3.2 2.4 1.6 2.8 2.3 1.5 2.5 2.2 Never been married 3.7 3.5 3.6 4.9 4.2 3.5 3.0 3.2 2.9 1.6 2.0 Prevalence Rate for
Depressive Symptoms 26.8 % 20.0 % 23.7% 26.0 % 16.8 % 20.9 % 21.2 % 18.0 % 18.9 % The total percentage of some categories may not equal 100 due to rounding. TLSA = the Taiwan Longitudinal Study on Aging; A = Sample A, the TLSA sam-ple collected since 1989; B = Samsam-ple B, the TLSA samsam-ple added in 1996; All = the pooled samsam-ple of Samsam-ple A and Samsam-ple B with weights.
Table 3. The performance of selected cutoffs on the TLSA form of the CES-D in 1989 and 1993.
Year Cutoff Spec Sens Spec + Sens PPV Kappa
1989 7/8 0.810 0.998 1.808 0.508 0.58 8/9 0.887 0.989 1.876 0.634 0.72 9/10 0.933 0.963 1.896 0.740 0.80 10/11 0.966 0.885 1.851 0.838 0.83 11/12 0.986 0.795 1.781 0.920 0.83 1993 7/8 0.812 0.998 1.810 0.572 0.63 8/9 0.885 0.990 1.875 0.684 0.75 9/10 0.933 0.966 1.899 0.785 0.83 10/11 0.967 0.881 1.848 0.871 0.84 11/12 0.985 0.817 1.802 0.930 0.84 TLSA = the Taiwan Longitudinal Study on Aging; CES-D = the Center for Epidemiologic Studies Depression Scale; Spec = Specificity; Sens = Sensitivity;
PV = Positive Predictive Value. P
Figure 1. Receiver operator characteristic curves for the TLSA
form of the CES-D with cutoff 4 on the Boston form as the criterion. The curves assessed in 1989 and 1993 were overlap-ping with the 95% confidence intervals of the AUC being (0.986, 0.991) and (0.987, 0.992), respectively.
tion of depressive cases, the nature of screening instru- ments, the cutoff adopted, and the characteristics of the samples studied. Therefore, it is essential to further vali- date the cutoff score of 10 for the TLSA form of the CES-D with clinically diagnosed depressed patients. The Bureau of Health Promotion at the Department of Health in Taiwan and Ku et al. [5,21] employed the cutoff of 10. Nevertheless, to the best of our knowledge, the present study was the first to provide empirical findings in support of the use of 10 as the cutoff on the TLSA form of the CES-D. This suggested cutoff can be used as a tentative criterion to screen for older Taiwanese with severe depressive symptoms so that necessary profes- sional assessment and care can be provided to the elders who may be at risk for depression in a timely manner.
5. CONCLUSION
A cutoff score of 10 is recommended for the TLSA form of CES-D to screen for elders at risk for depression in Taiwan. This cutoff yielded prevalence rates of de- pressive symptoms similar to previously reported ones. With the widely use of this particular short form of CES- D in Taiwan, the suggested cutoff can be used to identify older Taiwanese who may need comprehensive assess- ment and care for mental health. This tentative cutoff can further be validated with clinically diagnosed depressed elders to enhance the utility of the TLSA form of CES-D for promoting mental health in Taiwan.
6. ACKNOWLEDGEMENTS
The authors would like to thank the Bureau of Health Promotion at
the Department of Health in Taiwan for the permission to analyze the data from the Taiwan Longitudinal Study on Aging (TLSA). The de-scriptions and conclusions herein do not represent the viewpoint of the Bureau. The authors also wish to thank Dr. Chi Chiao of the National Yang-Ming University and Dr. Chung-Ping Cheng of the National Cheng-Kung University for their stimulating discussions and valuable suggestions on this work.
REFERENCES
[1] Mui, A.C. and Yang, P.S. (2005) The foundations of ge- rontological social work practice in Taiwan. YehYeh Pub-lishing House, Taipei.
[2] Small, G.W. (1998) Treatment of geriatric depression. De- pression and Anxiety, 8, 32-42.
doi:10.1002/(SICI)1520-6394(1998)8:1+<32::AID-DA6> 3.0.CO;2-J
[3] Katona, C.L.E. (1994) Depression in old age. Wiley, New York.
[4] Radloff, L.S. (1977) The CES-D scale: A self-report de- pression scale for research in the general population. Ap- plied Psychological Measurement, 1, 385-401.
doi:10.1177/014662167700100306
[5] Bureau of Health Promotion, Department of Health (2006) 2003 Survey of Health and Living Status of the Middle Aged and Elderly in Taiwan Survey Report. Bureau of Health Promotion, Department of Health, Taichung. [6] Roberts, R.E. and Vernon, S.W. (1983) The Center for
Epidemiologic Studies Depression Scale: Its use in a community sample. American Journal of Psychiatry, 140, 41-46.
[7] Irwin, M., Artin, K.H. and Oxman, M.N. (1999) Screen- ing for depression in the older adult: Criterion validity of the 10-item Center for Epidemiological Studies Depres- sion Scale (CES-D). Archives of Internal Medicine, 159, 1701-1704. doi:10.1001/archinte.159.15.1701
[8] Andresen, E.M., Malmgren, J.A., Carter, W.B. and Pat- rick, D.L. (1994) Screening for depression in well older adults: Evaluation of a short form of the CES-D (Center for Epidemiologic Studies Depression Scale). American Journal of Preventive Medicine, 10, 77-84.
[9] Kohout, F.J., Berkman, L.F., Evans, D.A. and Cornoni- Huntley, J. (1993) Two shorter forms of the CES-D de- pression symptoms index. Journal of Aging and Health, 5, 179-193.doi:10.1177/089826439300500202
[10] Myers, J.K. and Weissman, M.M. (1980) Use of a self- report symptom scale to detect depression in a commu- nity sample. American Journal of Psychiatry, 137, 1081- 1084.
[11] Haringsma, R., Engels, G.I., Beekman, A.T. and Spinho- ven, P. (2004) The criterion validity of the Center for Epidemiological Studies Depression Scale (CES-D) in a sample of self-referred elders with depressive symptoma- tology. International Journal of Geriatric Psychiatry, 19, 558-563. doi:10.1002/gps.1130
[12] Lewinsohn, P.M., Seeley, J.R., Roberts, R.E. and Allen, N.B. (1997) Center for Epidemiologic Studies Depression
Scale (CES-D) as a screening instrument for depression among community-residing older adults. Psychology and Aging, 12, 277-287. doi:10.1037/0882-7974.12.2.277 [13] Hanley, J.A. and McNeil, B.J. (1982) The meaning and
use of the area under receiver operating characteristic (ROC) curve. Radiology, 143, 29-36.
[14] Sheehan, B. and Banerjee, S. (1999) Review: Somati- zation in the elderly. International Journal of Geriatric Psychiatry, 14, 1044-1049.
doi:10.1002/(SICI)1099-1166(199912)14:12<1044::AID-GPS55>3.0.CO;2-0
[15] Himmelfarb, S. and Murrell, S.A. (1983) Reliability and validity of five mental health scales in older persons. Journal of Gerontology, 38, 333-339.
doi:10.1093/geronj/38.3.333
[16] Cheng, S.T. and Chan, A.C.M. (2005) The Center for Epidemiologic Studies Depression Scale in older Chinese: Thresholds for long and short forms. International Jour- nal of Geriatric Psychiatry, 20, 465-470.
doi:10.1002/gps.1314
[17] Waston, L.C., Lewis, C.L., Kistler, C.E., Amick, H.R. and Boustani, M. (2004) Can we trust depression screening instruments in healthy “old-old” adults? International Journal of Geriatric Psychiatry, 19, 278-285.
doi:10.1002/gps.1082
[18] Boey, K.W. (1999) Cross-validation of a short form of the CES-D in Chinese elderly. International Journal of Geri- atric Psychiatry, 14, 608-617.
doi:10.1002/(SICI)1099-1166(199908)14:8<608::AID-G PS991>3.0.CO;2-Z
[19] American Psychiatric Association (1994) Diagnostic and statistical manual of mental disorders. 4th Edition, Ameri- can Psychiatric Association, Washington DC.
[20] Robison, J., Gruman, C., Gaztambide, S. and Blank, K. (2002) Screening for depression in middle-aged and older
Puerto Rican primary care patients. Journals of Geron- tology Series A: Biological Sciences and Medical, 57, M308-M314. doi:10.1093/gerona/57.5.M308
[21] Ku, P.W., Fox, K.R. and Chen, L.J. (2009) Physical acti- vity and depressive symptoms in Taiwanese older adults: A seven-year follow-up study. Preventive Medicine, 48, 250-255.doi:10.1016/j.ypmed.2009.01.006
[22] SAS Institute, Inc. (2001) Sample 25017: Nonparametric comparison of areas under correlated ROC curves. http://support.sas.com/kb/25/017.html
[23] Fleiss, J.L. (1981) Statistical methods for rates and pro- portions. 2nd Edition, Wiley & Sons, New York.
[24] Lu, C.H., Liu, C.Y. and Yu, S. (1998) Depressive dis- orders among the Chinese elderly in a suburban commu- nity. Public Health Nursing, 15, 196-200.
doi:10.1111/j.1525-1446.1998.tb00339.x
[25] Chong, M.Y., Tsang, H.Y., Chen, C.S., et al. (2001) Com- munity study of depression in old age in Taiwan: Preva- lence, life events and socio-demographic correlates. Brit- ish Journal of Psychiatry, 178, 29-35.
doi:10.1192/bjp.178.1.29
[26] Chiu, H.C., Chen, C.M., Huang, C.J. and Mau, L.W. (2005) Depressive symptoms, chronic medical conditions and functional status: A comparison of urban and rural elders in Taiwan. International Journal of Geriatric Psy- chiatry, 20, 635-644. doi:10.1002/gps.1292
[27] Tsai, Y.F., Yeh, S.H. and Tsai, H.H. (2005) Prevalence and risk factors for depressive symptoms among community- dwelling elders in Taiwan. International Journal of Geri- atric Psychiatry, 20, 1097-1102.
doi:10.1002/gps.1413
[28] Beekman, A.T., Copeland, J.R. and Prince, M.J. (1999) Review of community prevalence of depression in later life. British Journal of Psychiatry, 174, 307-311. doi:10.1192/bjp.174.4.307