Abstract. Objective: The authors examined the sociodemograph-ics and psychobehavioral characteristsociodemograph-ics of undergraduate US college students who abstain from alcohol. Participants: The respondents were 5,210 undergraduates from 32 colleges and uni-versities. Methods: A survey was mailed to 300 randomly selected
students per institution (spring 2000 or 2001). The response rate was 56.2%. Results: Overall, 20.5% of the students abstained.
Pre-dictors of abstention included the student’s own negative attitude toward alcohol use; perception of friends’ alcohol attitudes; male gender; being under age 21; abstaining in high school; non–Greek member or pledge; nonathlete; nonsmoker; non–marijuana user; participant in a religious group; working either 0 or 10+ hours per week for salary; having a mother who abstains; and having a close friend who abstains. Conclusion: Additional research on
abstain-ers is warranted. Campus-based prevention programs should be grounded in a better understanding of how motives not to drink are developed and sustained in high school and college.
Keywords: abstention, alcohol, college health, college student lcohol puts drinkers at risk for a variety of health and other consequences. With college students, campus administrators are principally concerned about the immediate need to prevent deaths and injuries resulting from episodes of heavy drinking. By 1 estimate, approximately 1,700 students (aged 18–24 years) enrolled in 2- and 4-year institutions die each year from alcohol-related causes, mostly because of motor vehicle crashes.
A
Sociodemographic and Psychobehavioral
Characteristics of US College Students Who
Abstain From Alcohol
Jiun-Hau Huang, SM, ScD; William DeJong, PhD; Laura Gomberg Towvim, MSPH;
Shari Kessel Schneider, MSPH
More than 600,000 students are hit or assaulted by another drinking student each year, and 97,000 are victims of alco-hol-related sexual assault or date rape.1
Extensive research has been undertaken to understand the predictors and correlates of heavy drinking among college students. Previous research established that male students drink more heavily than females.2 White students are highest in heavy drinking, whereas Black students are lowest and Hispanic/Latino students are at an intermedi-ate level.2 According to Baer,3 other individual-level fac-tors examined in relation to heavy drinking by students include family history and parents’ alcohol use, personality traits (eg, impulsivity, conventionality, sociability), drinking motives, alcohol expectancies, perceived social norms, and social affiliation (eg, participation in intercollegiate athlet-ics, membership in a fraternity or sorority).
Researchers have also examined environmental factors that influence heavy alcohol consumption by college stu-dents. In their review of the literature, Presley et al4 listed several key factors, including alcohol outlet density, alco-hol pricing, type of institution (2- vs 4-year), institutional affiliation (eg, women’s college, historically black college or university), presence of a Greek system, presence of an intercollegiate athletic program, and region.
This body of research has focused on heavy drinking by college students while giving relatively little attention to the phenomenon of abstention. The 2001 College Alcohol Study (CAS) revealed that 19.3% of students attending 4-year insti-tutions were abstainers during the past year, up significantly from 16.4% in 1993.5 Sex differences in abstention have shift-ed over time. The 1993 CAS showshift-ed that 17.0% of women and 15.7% of men abstained, whereas 18.7% of women and 20.1% of men did so in 2001.5 These findings were not statisti-cally tested, nor were other predictors of abstention examined. An investigation on the basis of the 1999 CAS showed that Dr Huang is with the Institute of Health Policy and Management
at National Taiwan University’s College of Public Health in Taipei, Taiwan and the Department of Society, Human Development, and Health at the Harvard School of Public Health in Boston, MA. Dr DeJong is with the Department of Social and Behavioral Sciences at Boston University’s School of Public Health. Ms Towvim and Ms Schneider are with Education Development, Inc’s Center for College Health and Safety, Newton, MA.
students attending colleges that ban alcohol are more likely to abstain, though whether that is because of the policy or because of student self-selection is unclear.6
To date, no other published studies have examined predic-tors and correlates of abstention among college students. Clearly, further research is warranted. We should not assume that abstainers are simply the opposite of heavy drinkers. Note that the 2001 CAS found that men were more likely than women to be classified as abstainers, but also as heavy drink-ers.5 By studying abstainers more closely, researchers may gain new insights that can inform college prevention efforts.
Studies of alcohol abstention among other US populations are also sparse. Hillman and Haskin7 found that in a small sample of high school seniors, those who reported abstaining had significantly higher grade point averages (GPAs) and more frequently attended religious services. A general house-hold survey found that US residents aged 12 years and older who held negative beliefs about the effects of alcohol (expec-tancies) were more likely to abstain.8 A study of Black and White women ages 19 to 70+ from a representative sample of households in Erie County, New York, found that alcohol abstainers were older, more religious, more likely to be black, and more likely to have lower socioeconomic status.9
Spoth et al10 reported that adolescents who have stron-ger affectional relationships with their parents and closer friendships with prosocial peers are more likely to abstain. Other research has examined the role of parental alcohol use. A longitudinal study found that parents who were lifelong abstainers more often had children who abstained or drank lightly as adults.11 In a review of international research, Plant et al12 found that parents who drink heavily are more likely to have children who drink heavily, but also children who are more likely to abstain or drink lightly. Finally, a prospective study found that adolescents who had typical nondrinker images as their goal states were more likely to abstain from drinking.13
We designed the present investigation, which uses baseline survey data collected at 32 US colleges and universities for the Social Norms Marketing Research Project,14 to explore the sociodemographic and psychobehavioral correlates of alcohol abstention among college students. Knowledge of the characteristics that differentiate abstainers from drinkers in college can inform future intervention programs designed to reduce high-risk and underage drinking on campus.
On the basis of the previous literature, we expected abstention rates to be higher among men, students with high-er GPAs, those participating more frequently in a religious group, those with more negative attitudes toward alcohol, and those with close friends who abstain. The complex relation-ship between parental alcohol use and abstention precluded us from stating firm hypotheses regarding the association between abstention and mother’s or father’s alcohol use.
METHODS
The Survey of College Alcohol Norms and Behavior (SCANB) was administered annually each spring to students from 32 4-year institutions of higher education (IHEs) that
participated in the Social Norms Marketing Research Project (SNMRP), a 5-year project designed to assess the effectiveness of social norms marketing in reducing high-risk drinking.14 Our analysis used baseline data collected for the SNMRP.
The 32 IHEs represent all 4 US census regions (North-east, North Central, West, and South). They range in size from approximately 2,000 to 31,000 undergraduates and vary in terms of sector (private vs public), percentage of residential students, and student body demographics.
The human subjects committees at the Education Devel-opment Center, Inc. and all 32 participating IHEs approved the study procedure.
Survey Content
The SCANB is a self-administered, voluntary, and anon-ymous mail survey that asks about students’ alcohol-related attitudes, perceptions, and behaviors. The baseline SCANB administered to a first cohort of IHEs (SNMRP/Study 1) in 2000 consisted of 64 questions on student characteristics, alcohol use and its consequences, reasons for drinking and abstaining from alcohol, perceptions of campus alcohol norms, campus and community alcohol policies, and per-ceived social capital. The baseline SCANB administered to a second cohort of IHEs (SNMRP/Study 2) in 2001 con-sisted of 54 items; the number of questions was decreased to encourage higher response rates.
Alcohol Consumption
The SCANB defined a drink as “a bottle of beer (12 oz.), a glass of wine (4 oz.), a wine cooler (12 oz.), or a shot of liquor (1 oz.) served straight or in a mixed drink.” Concern-ing their own alcohol use, the respondents answered 4 key questions: (1) “During the past 30 days, on how many occa-sions did you use each of the following substances—alco-hol (beer, wine, liquor)?” The response options (scored 1–7) were never, 1 to 2 times, 3 to 5 times, 6 to 9 times, 10 to 19 times, 20 to 39 times, and 40 or more times.
For the next 3 questions, a numerical fill-in response box allowed students to enter 00 to 99 drinks, thus creating an interval-level scale. (2) “What is the average number of drinks you consume in a week?” (3) “When you party, how many drinks do you usually have?” (4) “Think back over the last 2 weeks. What was the greatest number of drinks you consumed at 1 sitting? For how many hours did you drink?” A second numerical fill-in response box allowed students to report the duration of the drinking episode.
To be classified as an abstainer, a student had to report no alcohol use in response to all 4 consumption questions. A stu-dent reporting alcohol use in response to 1 or more questions was classified as a drinker. Students who did not respond to 1 of the 4 questions were still classified, but those who failed to respond to 2 or more questions were excluded from the analysis.
Alcohol Use by Parents and Closest Friend
The respondents were asked to describe the typical use of alcohol by their mother (or female guardian), father (or male guardian), and closest friend (nonromantic). Response cat-egories included abstainer, light drinker, moderate drinker,
heavy drinker, and problem drinker. In the analysis, a dummy variable was created for abstainer, with drinker as the reference group.
Tobacco and Other Drug Use
The respondents reported on how many occasions in the past 30 days they had used tobacco (smoked), tobacco (chew, snuff), marijuana, and other drugs (not including drugs prescribed by a medical doctor). The response scale was the same as that used when asking about their 30-day alcohol use (see above). In the analysis, for each question, a dummy variable was created for nonuser, with those using a substance 1 or more times as the reference group.
Alcohol Use in High School
The respondents were asked to describe their use of alcohol during their last year of high school, using the same response scale as that used when asking about others’ typical alcohol use (see above). In the analysis, a dummy variable was created for
high school abstainer, with drinker as the reference group.
Attitude Toward Alcohol Use
Respondents indicated which of 5 statements best represent-ed their own attitude toward drinking alcoholic beverages: (1) Drinking is never a good thing to do.
(2) Drinking is all right, but a person should not get drunk.
(3) Occasionally getting drunk is okay as long as it doesn’t interfere with academics or other respon- sibilities.
(4) Occasionally getting drunk is okay even if it does interfere with academics or other responsibilities. (5) Frequently getting drunk is okay if that’s what an
individual wants to do.
Respondents used the same scale to report the most com-mon attitude acom-mong students in general at their school and among their friends. For each of the 3 questions, separate dummy variables were created for responses 1 and 2, with respondents giving responses 3, 4, or 5 (“Getting drunk is okay”) as the reference group.
Perceptions of Others’ Alcohol Use
Respondents were asked to state on how many occasions a typical student at their school had consumed alcohol in the past 30 days. The response scale was the same as that used when asking about their own 30-day alcohol use. In the analysis, we created a dummy variable for those citing no alcohol use by the typical student, with those citing alcohol use 1 or more times as the reference group.
Respondents also indicated the average number of drinks consumed by the typical student at their school in a week and the number of drinks students at their school have when they party. For both questions, respondents were asked to answer separately for men and women using numerical fill-in response boxes. Ffill-inally, the respondents were asked to estimate the percentage of students at their school who do not consume alcoholic beverages. For this question, a numerical fill-in response box allowed students to enter 0% to 100%.
Perceptions of Campus Drinking Norms and Attitudes
The respondents were asked to state the number of drinks they believe most students at their school think is appropriate for students to have when they party, reporting separately for men and women using numerical fill-in response boxes.
Respondents also reported to what extent they agreed with a set of 10 statements regarding drinking-related attitudes on campus:
(1) The social atmosphere on this campus discourages alcohol use.
(2) Students at this school feel pressured to drink alcohol. (3) It’s easy to make friends at this school without drinking alcohol.
(4) Students assume that everyone at this school drinks alcohol.
(5) Students at this school will let you make your own decisions about drinking alcohol.
(6) Students at this school respect you if you don’t drink alcohol.
(7) Students view this school as a big ‘party school. (8) Students at this school who abstain from drinking alcohol don’t fit in.
(9) Abstaining from alcohol or light drinking is the norm at this school.
(10) Students at this school think that heavy or binge drinking is okay.
The response alternatives (scored 1–4) were strongly
disagree, disagree, agree, and strongly agree. Negatively worded items (ie, 2, 4, 7, 8, and 10) were reverse scored.
Response scores for the 10 items were added to create the Perception of Campus Drinking Attitudes Scale (PCDAS). Higher scores on the PCDAS indicate perceptions of drink-ing-related attitudes on campus that are more favorable toward abstention. If a respondent had not answered 3 or fewer items, values were input for the missing responses using the mean of the other item scores. Coefficient alpha of the 10-item PCDAS was calculated to assess its internal consistency reliability.12
Activities
The respondents were asked to report the number of hours per week they spent in several group-oriented extracurricular activities, including: community service (dummy variables for 0–2, 3–9, and 20+ hours, with 10–19 hours as the refer-ence group); Greek/social club (dummy variables for 0 and 1–5 hours, with 6+ hours as the reference group); substance
abuse prevention peer education group (dummy variable for participants, with nonparticipants as the reference group);
religious group (dummy variables for 1 to 2, 3 to 5, and 6+ hours, with nonparticipants as the reference group); and
var-sity athletic team (dummy variables for 0 and 1–5 hours, with 6+ hours as the reference group). A dummy variable was also created for each of these group activities to indicate whether a participant was in a leadership role, with the exception of the substance abuse prevention group because of the small number of self-identified leaders (n = 5).
In addition, the respondents also reported the number of hours per week they spent on the following activities:
studying outside of class (dummy variables for 0–2 and 20+ hours, with 3–19 hours as the reference group); watching
TV/videos (dummy variables for 0 and 1–5 hours, with 6+ hours as the reference group); and working for salary/wages (dummy variables for 0 and 10+ hours, with 1–9 hours as the reference group).
These activity-related variables have different category breakdowns and reference groups. For each variable, we combined certain categories because of low frequency counts for some of the response alternatives, and how this was best broken-down differed by variable. Nonparticipa-tion in the activity was almost always a separate category, except when there were too few respondents in the 0-hour per week category to keep it separate. For each variable, the category with the lowest abstention rate in the univariate analysis was selected as the reference group.
Control and Background Variables
The SCANB included 16 control/background variables of interest, including gender (dummy variable for male, with female as the reference group); age (dummy variables for < 21 and 24+, with 21–23 years as the reference group);
race/ethnicity (dummy variables for African American/ Black, Asian, Hispanic/Latino, and Native American/Native Hawaiian/Pacific Islander/Other, with Caucasian/White as the reference group); personal relationship status (dummy variable for married, separated/divorced, or widowed, with single as the reference group); student status (dummy vari-able for part-time status, with full-time status as the refer-ence group); student classification (dummy variables for freshman, sophomore, and junior, with senior as the refer-ence group); and GPA (dummy variable for B+ or higher, with B or lower as the reference group).
Additional variables included location of residence (dummy variable for on campus, with off campus as the reference group); type of residence (dummy variables for house/apartment, residence hall/dorm, and other, with fra-ternity/sorority house as the reference group); living
situ-ation (dummy variables for living alone and living with family/other, using living with 1 or more roommates as the reference group); parental education (dummy variable for neither parent being a college graduate, with 1 or both parents being a college graduate as the reference group);
number of close student friends (dummy variable for having 0–4 close student friends, with having 5+ as the reference group); year of survey administration (dummy variable for 2000, with 2001 as the reference group); and timing of
survey completion (dummy variable for during/after spring break, with before spring break as the reference group).
The SCANB also asked about involvement in a fraternity/
sorority (dummy variable for non–Greek member/pledge, with Greek member/pledge as the reference group) and
involve-ment in intercollegiate athletics (dummy variable for nonath-lete, with athlete as the reference group). Students were said to be a college athlete if they indicated “intercollegiate athlete” when asked about extracurricular activities or if they indicated spending time each week on a varsity athletic team.
Sampling Method
The baseline SCANB was mailed to 300 randomly select-ed undergraduate students at each of the 32 participating IHEs (N = 9,600). The baseline survey was administered at 18 IHEs in the spring of 2000 (SNMRP/Study 1) and at the 14 remaining IHEs in the spring of 2001 (SNMRP/Study 2). Each registrar provided a list of degree-seeking undergradu-ates, including full- and part-time students. This sampling frame excluded students with out-of-state addresses listed as their current or local address. For each IHE, its random sample of 300 students was stratified by class year (fresh-man, sophomore, junior, senior).
Survey Administration
Each IHE had a separate mailing schedule on the basis of its academic calendar, with the first survey mailing sent 3 to 4 weeks after the beginning of the spring semester, in all cases well after New Year’s Day, but also several weeks prior to spring break. This time period has been used in other national surveys.5 One college survey manual15 expressly recommends this time period, in part because drinking pat-terns during the fall are greatly affected by the frequency of special events (football weekends) and holidays (Hallow-een, Thanksgiving) associated with drinking.16
For SNMRP/Study 1, a teaser postcard was mailed prior to the first survey mailing to alert students that the survey would be arriving soon; this was not done for SNMRP/Study 2 1 year later. The second survey mailing arrived approxi-mately 2 weeks prior to each IHE’s spring break. The third was sent 2 to 3 weeks after spring break. The fourth mail-ing, sent approximately 2 weeks after the third mailmail-ing, was an abbreviated (2-page) version of the SCANB, which did not include policy-related questions.
Nonrespondents received a reminder postcard a few days after the first survey mailing and again 2 to 3 weeks after the second survey mailing. Project staff made reminder telephone calls after the second and third survey mailings to answer questions and encourage completion of the survey. Both rounds of reminder calls involved up to 3 attempts to reach each student in person; on the third attempt, the caller left a message requesting that the survey be completed.
The cover letter for each survey mailing served as the informed-consent document. Students did not have to participate and could leave a question blank if they did not want to answer it. To preserve anonymity, no identifying information was put on either the survey instrument or its stamped return envelope. Rather, with every survey mailing, students received a postcard with a unique code number, with instructions to mail the post-card separately from the survey itself to indicate that they had completed the survey or did not wish to participate.
Monetary incentives were used to increase response rates. A $1 bill was included with the first survey mailing as an up-front incentive.17 Students completing the survey became eligible for 3 drawings: 1 $100 cash prize per IHE for stu-dents returning the survey in 1 week; 5 $50 cash prizes per IHE for students responding by the end of the semester; and 1 $500 national prize for 1 student responding by the end of
the semester. With SNMRP/Study 2, the national prize was increased to $1,000 to encourage a higher response rate.
Response Rate
A total of 330 of the 9,600 surveyed students were removed from the sample. Reasons for removal included the following: 2 or more pieces of undeliverable mail were returned; telephone contact revealed that students were no longer enrolled, had already graduated, or were spending the semester abroad; the registrar verified that nonrespond-ing students who could not be reached by telephone were not enrolled during the survey period; or participants indi-cated on their survey that they were not enrolled or were in graduate or professional school.
These adjustments resulted in a final sample size of 9,270 students. The number of completed surveys was 5,210, for a final response rate of 56.2%. This response rate is com-parable to those of other recent national studies such as the CAS, which had a response rate of 52% in its most recent survey in 2001.5 Response rates for individual IHEs ranged from 45.3% to 71.4%. Of the surveys received, 4,858 (93.2%, or 52.4% of the final sample) were full-length sur-veys. The remaining 352 surveys (6.8%) were abbreviated versions sent in the final mailing.
The reported analyses are on the basis of the full-length sur-vey responses from 4,798 students, after excluding 19 students who did not indicate whether they were enrolled as under-graduates and 41 students who said they were former problem drinkers in recovery, either presently or during high school.
Statistical Analysis
All statistical analyses were performed using SAS Ver-sion 8.2.18 Descriptive statistics were examined for all variables. Relatively little data was missing for the alcohol use measures, ranging from 0.8% to 2.3%. For each mea-sure, cross-tabulations showed that the demographic traits of respondents who provided usable data closely matched those for the sample as a whole (no difference greater than 0.4 percentage points). Responses were then examined for particularly extreme or implausible values, which were very rare (involving less than 0.5% of the respondents per measure). These responses were conservatively truncated to lower values. For example, if a respondent said that the average male or female student consumed more than 80 drinks per week, the response was reduced to 80.
For categorical independent variables, univariate associa-tions with being an abstainer were examined using chi-square tests, and for continuous independent variables, univariate associations with abstention were assessed using 2-sample
t-tests. For the group activities of community service, Greek/ social club, religious group, and varsity athletic team, chi-square analyses were conducted to compare the abstention rates of those in a leadership role with other participants. Because leaders spend more time with these activities, additional chi-square analyses were conducted to determine whether being in a leadership role interacted with amount of participation time or operated independently of it.
SAS stepwise automated model selection procedures were used to fit multivariate logistic regression models estimating the odds of being an abstainer. Variables that had significant (p < .05) univariate associations with abstention were entered into the stepwise selection procedures. Alpha levels of .25 and .05 were specified for entry into and for remaining in the model, respectively.19 All 16 SCANB control/background variables were forced into each model regardless of their significance levels.
Two sets of models were developed. One set adjusted for being a college athlete and Greek membership (being a fraternity/sorority member or pledge). The other set adjusted instead for the reported number of hours per week spent participating on a varsity athletic team and in Greek/social club activities. Once the preliminary final models were obtained, all nonsignificant independent variables that had been excluded were added back into the models individu-ally to assess for potential confounding. Following stan-dard practice, confounders were defined as any added-in variables that caused the regression coefficients of any significant covariates to change by 10% or more. All identi-fied confounders were included in the final models. The goodness-of-fit of both final models was assessed using the Hosmer and Lemeshow test.19 With this procedure, unlike the likelihood ratio test, a small test statistic with p < .05 is needed to demonstrate a significantly good fit of the model.
In addition, both models were recalculated to take into account that students were nested in IHEs. This was accom-plished using hierarchical nonlinear modeling, which esti-mates variance components at the student and IHE level. Partitioning variance in this way accounts for the variance in student-level outcomes that can be attributed to differ-ences between IHEs. The number of surveys varied across IHEs. Hence, a weighting factor was calculated for each IHE as the mean number of respondents across all 32 IHEs divided by the number of respondents for that IHE.
RESULTS
Background Characteristics of the Student Sample
The final sample size was 4,798 respondents. Sample sizes for particular variables differed somewhat because of missing values. Total percentages sometimes add up to more than 100% because of rounding error.
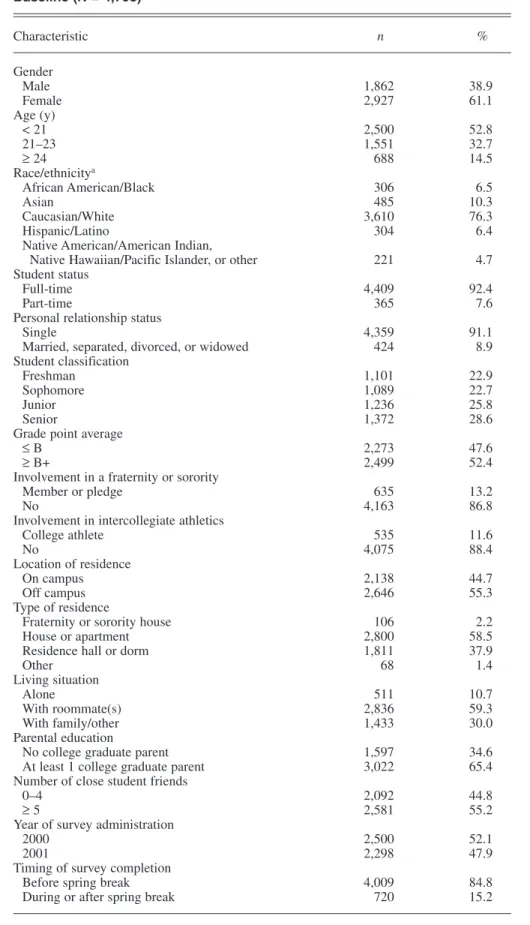
Background characteristics are reported in Table 1. The sample included more women than men. More than half of the students were under age 21 years, and just over three-fourths of the students were Caucasian. More than 90% of the students were single. Almost two-thirds of the students had at least 1 parent who was a college graduate.
More than 90% of the students were full-time. There were slightly more juniors and seniors in the sample than freshmen and sophomores. Just over half had a GPA of B+ or higher. Fraternity/sorority members and pledges consti-tuted 13.2% of the sample. Approximately 1 in 10 students (11.6%) was a college athlete. The majority of students lived off campus; most lived in a house or apartment. Nearly 6 in
TABLE 1. Background Characteristics of the Student Sample from the 2000 and 2001 Survey of College Alcohol Norms and Behavior (SCANB) at Baseline (N = 4,798) Characteristic n % Gender Male 1,862 38.9 Female 2,927 61.1 Age (y) < 21 2,500 52.8 21–23 1,551 32.7 ≥ 24 688 14.5 Race/ethnicitya African American/Black 306 6.5 Asian 485 10.3 Caucasian/White 3,610 76.3 Hispanic/Latino 304 6.4
Native American/American Indian,
Native Hawaiian/Pacific Islander, or other 221 4.7 Student status
Full-time 4,409 92.4
Part-time 365 7.6
Personal relationship status
Single 4,359 91.1
Married, separated, divorced, or widowed 424 8.9 Student classification
Freshman 1,101 22.9
Sophomore 1,089 22.7
Junior 1,236 25.8
Senior 1,372 28.6
Grade point average
≤ B 2,273 47.6
≥ B+ 2,499 52.4
Involvement in a fraternity or sorority
Member or pledge 635 13.2
No 4,163 86.8
Involvement in intercollegiate athletics
College athlete 535 11.6 No 4,075 88.4 Location of residence On campus 2,138 44.7 Off campus 2,646 55.3 Type of residence
Fraternity or sorority house 106 2.2
House or apartment 2,800 58.5
Residence hall or dorm 1,811 37.9
Other 68 1.4 Living situation Alone 511 10.7 With roommate(s) 2,836 59.3 With family/other 1,433 30.0 Parental education
No college graduate parent 1,597 34.6
At least 1 college graduate parent 3,022 65.4 Number of close student friends
0–4 2,092 44.8
≥ 5 2,581 55.2
Year of survey administration
2000 2,500 52.1
2001 2,298 47.9
Timing of survey completion
Before spring break 4,009 84.8
During or after spring break 720 15.2
Note. Sample sizes vary slightly due to missing values.
10 lived with 1 or more roommates, and more than half of the students had 5 or more close student friends.
Prevalence of Alcohol Abstention
Of the 4,798 students in the final sample, 18 respondents had missing information for 2 or more alcohol consumption questions. Among the remaining 4,780 students, about 1 in 5 (20.5%) was a current abstainer.
Univariate Analyses Control and Background Variables
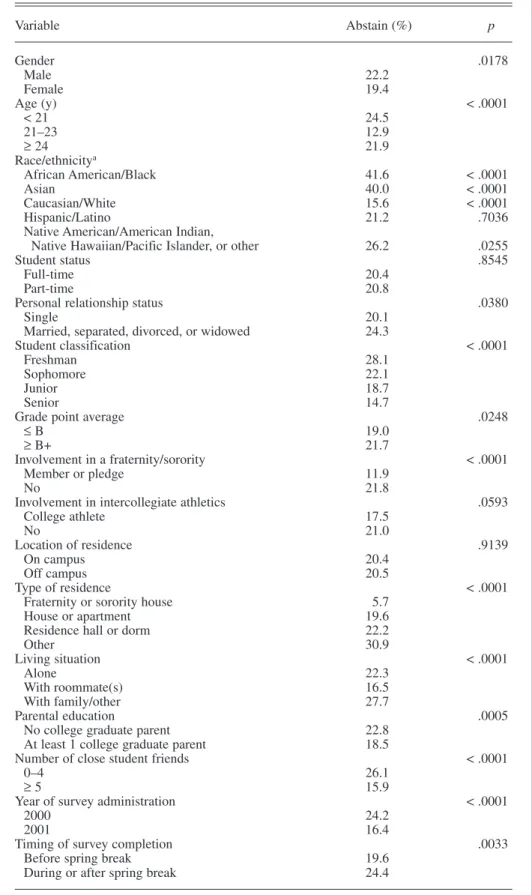
Table 2 presents the results of chi-square tests examining the relationship between each of the 16 control/background variables and abstention status.
Of note, male students were significantly more likely to abstain than female students (χ2[2, N = 4,772] = 5.62, p = .0178). Students under age 21 years were the most likely to abstain, followed by those aged 24 years or older; those aged 21 to 23 years were the least likely to abstain. Com-parisons across the 3 age groups were highly significant (χ2[2, N = 4,721] = 80.91, p < .0001).
Respondents could check multiple categories for race and ethnic background. Accordingly, we conducted a chi-square test for each race/ethnicity group separately, comparing group members versus nonmembers. Self-identified African Americans (χ2[1, N = 4,715] = 91.31, p < .0001) and Asians (χ2[1, N = 4,715] = 127.84, p < .0001) were significantly more likely to abstain, whereas whites were significantly less likely to abstain (χ2[1, N = 4,715] = 210.62, p < .0001). Being Native American, Native Hawaiian, Pacific Islander, or other was slightly associated with abstention (χ2[1, N = 4,715] = 4.99, p = .0255), but being Hispanic was not sig-nificantly related to abstention.
Also of note, freshmen were the most likely to abstain, followed by sophomores, juniors, and seniors (χ2[3, N = 4,780] = 71.12, p < .0001). Having a GPA of ≥ B+ versus ≤ B had a small but significant association with abstention
(χ2[1, N = 4,754] = 5.04, p = .0248).
Fraternity/sorority members and pledges were far less likely to abstain than non-Greek students (χ2[1, N = 4,780] = 33.39, p < .0001). In contrast, the comparison of college athletes and nonathletes was only near significant (χ2[1, N = 4,603] = 3.56, p = .0593).
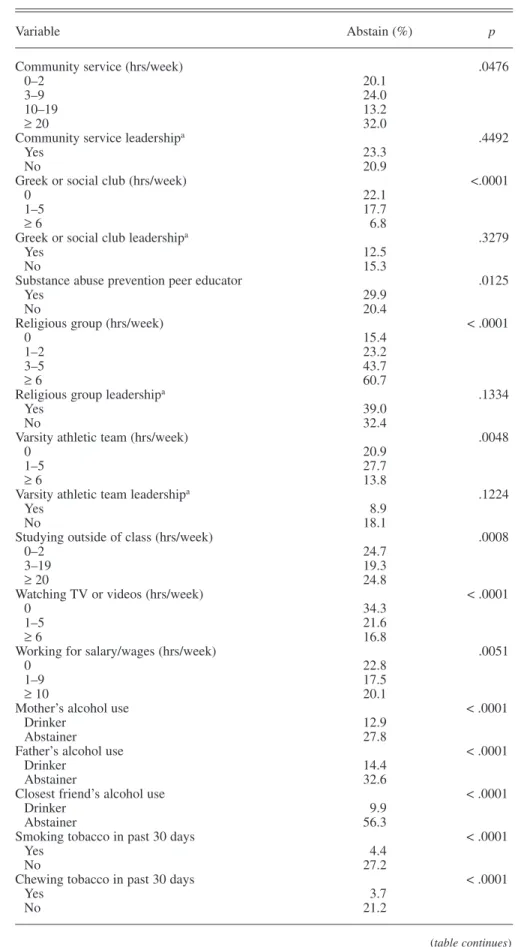
Table 3 presents the univariate associations between sev-eral categorical independent variables and student alcohol abstention, which are described in the following section.
Alcohol Use by Parents and Closest Friend
Students were more likely to abstain when their mother was an abstainer (χ2[1, N = 4,249] = 149.08, p < .0001), their father was an abstainer (χ2[1, N = 4,076] = 163.04, p < .0001), and their closest friend was an abstainer (χ2[1, N = 4,456] = 926.93, p < .0001).
Tobacco and Other Drug Use
Students who did not smoke, chew tobacco, use mari-juana, or use other drugs during the 30 days preceding the survey were significantly more likely to abstain from
alcohol than those who reported use of these substances (all p < .0001).
Alcohol Use in High School
Students who abstained in high school were more likely to abstain in college than those who drank in high school (χ2[1, N = 4,694] = 783.09, p < .0001).
Attitude Toward Alcohol Use
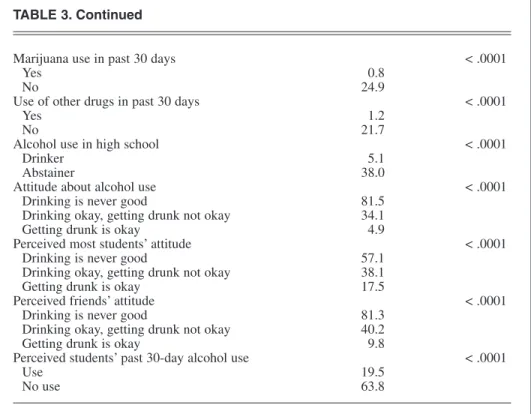
Students who agreed that drinking is never a good thing to do were the most likely to abstain (81.5%), followed by those who felt that drinking is okay but getting drunk is not okay (34.1%) and those who felt that getting drunk is okay (4.9%). This pattern of results was statistically significant (χ2[2, N = 4,633] = 1,619.25, p < .0001).
Similar relationships to abstention were found when respondents indicated how students in general and their friends feel about drinking, with those believing that others agreed that drinking is never a good thing to do being the most likely to abstain (p < .0001 in both cases).
Perceptions of Campus Drinking Norms and Attitudes
Students who perceived that a typical student did not use alcohol during the past 30 days were significantly more likely to abstain compared with those who perceived that a typical student did use alcohol (χ2[1, N = 4,612] = 95.21,
p < .0001).
Table 4 presents the univariate associations between student alcohol abstention and several continuous variables related to perceptions of others’ alcohol use. The survey respondents indicated their level of agreement with 10 statements regarding drinking-related attitudes on campus. Response scores for the 10 items were added to create the PCDAS. The scale had good internal consistency, with a Cronbach’s coefficient alpha of .81 (standardized). Higher scores on the PCDAS indicate perceptions of drinking-related attitudes on campus that are more favorable toward abstention. Compared with drinkers, abstainers had higher scores on the PCDAS, indicating that they were more likely to perceive pro-abstention attitudes on campus (p < .0001). Abstainers also gave lower estimates of the number of drinks that most students at their school think is appropri-ate for male and female students to have when they party (p < .0001 in both cases). Moreover, compared with drinkers, abstainers provided consistently lower estimates of alcohol consumption by male and female college students and thought a larger percentage of other students were abstain-ers (p < .0001 in all cases).
Activities
As shown in Table 3, participation in community service was significantly but mildly associated with abstention (χ2[3, N = 4,633] = 7.92, p = .0476). It should be noted, however, that relatively small numbers of students reported higher participation levels, which led to decreased statisti-cal power. For example, there were only 25 students who spent 20+ hours per week on community service, although the highest abstention rate (32.0%) was found in this group.
TABLE 2. Univariate Associations between 16 SCANB Control Variables and Alcohol Abstention Among College Students
Variable Abstain (%) p Gender .0178 Male 22.2 Female 19.4 Age (y) < .0001 < 21 24.5 21–23 12.9 ≥ 24 21.9 Race/ethnicitya African American/Black 41.6 < .0001 Asian 40.0 < .0001 Caucasian/White 15.6 < .0001 Hispanic/Latino 21.2 .7036
Native American/American Indian,
Native Hawaiian/Pacific Islander, or other 26.2 .0255
Student status .8545
Full-time 20.4
Part-time 20.8
Personal relationship status .0380
Single 20.1
Married, separated, divorced, or widowed 24.3
Student classification < .0001
Freshman 28.1
Sophomore 22.1
Junior 18.7
Senior 14.7
Grade point average .0248
≤ B 19.0
≥ B+ 21.7
Involvement in a fraternity/sorority < .0001
Member or pledge 11.9
No 21.8
Involvement in intercollegiate athletics .0593
College athlete 17.5 No 21.0 Location of residence .9139 On campus 20.4 Off campus 20.5 Type of residence < .0001
Fraternity or sorority house 5.7
House or apartment 19.6
Residence hall or dorm 22.2
Other 30.9 Living situation < .0001 Alone 22.3 With roommate(s) 16.5 With family/other 27.7 Parental education .0005
No college graduate parent 22.8
At least 1 college graduate parent 18.5
Number of close student friends < .0001
0–4 26.1
≥ 5 15.9
Year of survey administration < .0001
2000 24.2
2001 16.4
Timing of survey completion .0033
Before spring break 19.6
During or after spring break 24.4
Note. p values obtained from chi-square tests. SCANB = Survey of College Alcohol Norms and Behavior.
aThe comparison groups for Black, Asian, White, Hispanic, and Native American/Native Hawaiian/Pacific
Islander/other are non-Black (18.9%), non-Asian (18.1%), non-White (35.6%), non-Hispanic (20.3%), and non–Native American/Native Hawaiian/Pacific Islander/other (20.1%), respectively.
TABLE 3. Univariate Associations between SCANB Categorical Independent Variables and Alcohol Abstention Among College Students
Variable Abstain (%) p
Community service (hrs/week) .0476
0–2 20.1
3–9 24.0
10–19 13.2
≥ 20 32.0
Community service leadershipa .4492
Yes 23.3
No 20.9
Greek or social club (hrs/week) <.0001
0 22.1
1–5 17.7
≥ 6 6.8
Greek or social club leadershipa .3279
Yes 12.5
No 15.3
Substance abuse prevention peer educator .0125
Yes 29.9
No 20.4
Religious group (hrs/week) < .0001
0 15.4
1–2 23.2
3–5 43.7
≥ 6 60.7
Religious group leadershipa .1334
Yes 39.0
No 32.4
Varsity athletic team (hrs/week) .0048
0 20.9
1–5 27.7
≥ 6 13.8
Varsity athletic team leadershipa .1224
Yes 8.9
No 18.1
Studying outside of class (hrs/week) .0008
0–2 24.7
3–19 19.3
≥ 20 24.8
Watching TV or videos (hrs/week) < .0001
0 34.3
1–5 21.6
≥ 6 16.8
Working for salary/wages (hrs/week) .0051
0 22.8
1–9 17.5
≥ 10 20.1
Mother’s alcohol use < .0001
Drinker 12.9
Abstainer 27.8
Father’s alcohol use < .0001
Drinker 14.4
Abstainer 32.6
Closest friend’s alcohol use < .0001
Drinker 9.9
Abstainer 56.3
Smoking tobacco in past 30 days < .0001
Yes 4.4
No 27.2
Chewing tobacco in past 30 days < .0001
Yes 3.7
No 21.2
Among community service participants, those in a leader-ship role were not significantly more likely to abstain.
Students who did not participate in Greek/social club activities were more likely to abstain than those who did, whereas among participants, the more time that was spent, the less likely students were to abstain (χ2[2, N = 4,612] = 35.52, p < .0001). Among participants, those
in a leadership role were not significantly more likely to abstain.
Participants in substance abuse prevention peer education groups were more likely to abstain than nonparticipants (χ2[1, N = 4,599] = 6.24, p = .0125). The effect of leader-ship was not assessed because of the extremely small num-ber of peer education leaders (n = 5).
TABLE 4. Univariate Associations between SCANB Continuous Independent Variables and Alcohol Abstention Among College Students
Abstainers Drinkers
Variable M SD M SD
Perception of Campus Drinking Attitudes Scale (PCDAS) score 27.7 4.6 27.0 4.2 Other students’ beliefs about appropriate number of drinks for
male students to have when partying 6.0 4.0 7.8 3.5
Other students’ beliefs about appropriate number of drinks for
female students to have when partying 4.0 3.3 5.0 2.3
Perceived percentage of students who are abstainers 26.6 21.1 23.0 18.2 Perceived average number of drinks consumed by male students
in a week 9.2 9.0 12.5 9.4
Perceived average number of drinks consumed by female students
in a week 6.5 7.4 8.0 6.1
Perceived average number of drinks consumed by male students
when partying 7.1 4.6 8.7 3.9
Perceived average number of drinks consumed by female students
when partying 5.1 4.0 5.7 2.8
Note. p values obtained from 2-sample t tests. p < .0001 for all variables. SCANB = Survey of College Alcohol Norms and Behavior.
TABLE 3. Continued
Marijuana use in past 30 days < .0001
Yes 0.8
No 24.9
Use of other drugs in past 30 days < .0001
Yes 1.2
No 21.7
Alcohol use in high school < .0001
Drinker 5.1
Abstainer 38.0
Attitude about alcohol use < .0001
Drinking is never good 81.5
Drinking okay, getting drunk not okay 34.1
Getting drunk is okay 4.9
Perceived most students’ attitude < .0001
Drinking is never good 57.1
Drinking okay, getting drunk not okay 38.1
Getting drunk is okay 17.5
Perceived friends’ attitude < .0001
Drinking is never good 81.3
Drinking okay, getting drunk not okay 40.2
Getting drunk is okay 9.8
Perceived students’ past 30-day alcohol use < .0001
Use 19.5
No use 63.8
Note. p values obtained from chi-square tests. SCANB = Survey of College Alcohol Norms and Behavior.
aAnalyses of leadership variables include participants of the corresponding group activity only. Substance
TABLE 5. Effect Modification of Participation in Religious Group Activities, by Leadership Role Among Religious Group Participants
Participation Abstention (%)
Hours per In a leadership Not in a leadership
week n role (%) role (%) pa
1–2 870 21.1 23.3 .8211
3–5 355 37.8 44.3 .4504
≥ 6 168 44.8 71.3 .0006
a2 x 2 comparisons of leaders and nonleaders in relation to alcohol abstention, stratified by level of
participation time. p values obtained from chi-square tests.
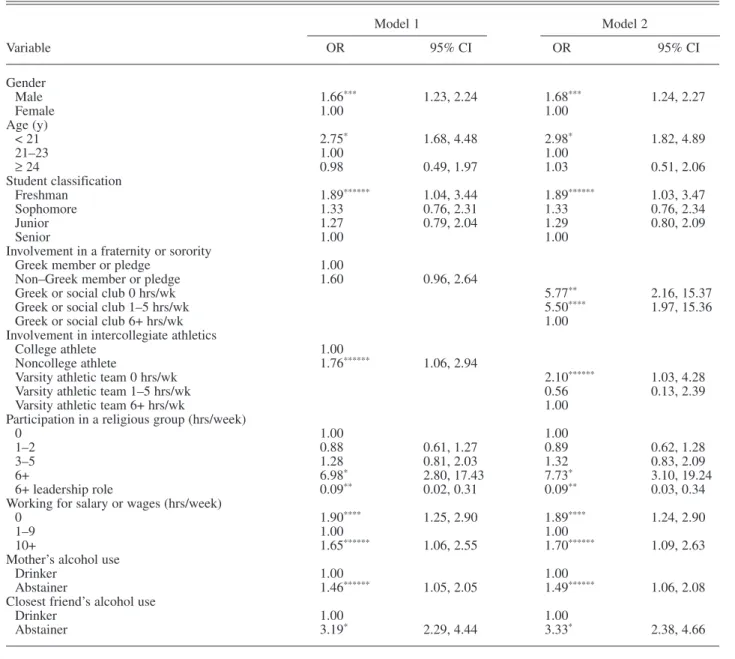
TABLE 6. Final Multivariate Logistic Regression Models Estimating the Odds of Alcohol Abstention in College
Model 1 Model 2 Variable OR 95% CI OR 95% CI Gender Male 1.66*** 1.23, 2.24 1.68*** 1.24, 2.27 Female 1.00 1.00 Age (y) < 21 2.75* 1.68, 4.48 2.98* 1.82, 4.89 21–23 1.00 1.00 ≥ 24 0.98 0.49, 1.97 1.03 0.51, 2.06 Student classification Freshman 1.89****** 1.04, 3.44 1.89****** 1.03, 3.47 Sophomore 1.33 0.76, 2.31 1.33 0.76, 2.34 Junior 1.27 0.79, 2.04 1.29 0.80, 2.09 Senior 1.00 1.00
Involvement in a fraternity or sorority
Greek member or pledge 1.00
Non–Greek member or pledge 1.60 0.96, 2.64
Greek or social club 0 hrs/wk 5.77** 2.16, 15.37
Greek or social club 1–5 hrs/wk 5.50**** 1.97, 15.36
Greek or social club 6+ hrs/wk 1.00
Involvement in intercollegiate athletics
College athlete 1.00
Noncollege athlete 1.76****** 1.06, 2.94
Varsity athletic team 0 hrs/wk 2.10****** 1.03, 4.28
Varsity athletic team 1–5 hrs/wk 0.56 0.13, 2.39
Varsity athletic team 6+ hrs/wk 1.00
Participation in a religious group (hrs/week)
0 1.00 1.00
1–2 0.88 0.61, 1.27 0.89 0.62, 1.28
3–5 1.28 0.81, 2.03 1.32 0.83, 2.09
6+ 6.98* 2.80, 17.43 7.73* 3.10, 19.24
6+ leadership role 0.09** 0.02, 0.31 0.09** 0.03, 0.34
Working for salary or wages (hrs/week)
0 1.90**** 1.25, 2.90 1.89**** 1.24, 2.90
1–9 1.00 1.00
10+ 1.65****** 1.06, 2.55 1.70****** 1.09, 2.63
Mother’s alcohol use
Drinker 1.00 1.00
Abstainer 1.46****** 1.05, 2.05 1.49****** 1.06, 2.08
Closest friend’s alcohol use
Drinker 1.00 1.00
Abstainer 3.19* 2.29, 4.44 3.33* 2.38, 4.66
Participation time in religious group activities was directly related to abstention (χ2[3, N = 4,617] = 337.84, p < .0001). Nonparticipants were the least likely to abstain. Among participants, the greater the time spent in activities, the higher the abstention rate. Although religious group leaders spent more time in activities than did other participants, the leaders were not significantly more likely to abstain. Inter-estingly, stratified analyses controlling for participation time revealed that, among participants who spent 6+ hours per week in religious group activities, those in a leadership role (44.8%) were significantly less likely to abstain (χ2[1, N = 168] = 11.87, p = .0006) compared to nonleaders (71.3%). As shown in Table 5, being in a leadership role was not an effect modifier of religious group participation among those spending either 1–2 or 3–5 hours per week.
Students not on a varsity athletic team had an abstention rate ((20.9%) comparable to that for the overall student sample (20.5%). Athletes spending 1–5 hours per week were more likely to abstain (27.7%) than those spending 6+ hours per week (13.8%). The overall pattern of results was statistically significant (χ2[2, N = 4,595] = 10.67, p = .0048). Varsity athletic team leaders were somewhat less likely to abstain than their teammates, but this effect was not statistically significant, perhaps because of the small number of leaders in the sample (n = 45). For this reason, stratified analyses of being in a leadership role, controlling for participation time, were not performed.
Regarding other activities, students who spent either 0–2 hours or 20+ hours per week studying outside of class were more likely to abstain than those who spent 3–19 hours per
week (χ2[2, N = 4,701] = 14.28, p = .0008). Those who spent no time watching TV or videos (34.3%) were the most likely to abstain, followed by those spending 1–5 hours (21.6%) and 6+ hours (16.8%) per week (χ2[2, N = 4,710] = 45.48, p < .0001). Students who did not work for salary/ wages were more likely to be abstainers than those who did work (χ2[2, N = 4,711] = 10.54, p = .0051).
Multivariate Logistic Regression Models
Table 6 presents the 2 final multivariate logistic regres-sion models estimating the odds of alcohol abstention. Both models included the 16 SCANB control/background variables and 9 significant associates of abstention. Both models also included 10 confounding variables, which are listed in a footnote to Table 6.
Two models were developed: (1) Model 1, adjusting for Greek membership (being a fraternity/sorority member or pledge) and being a college athlete and (2) Model 2, adjust-ing instead for the reported number of hours per week spent participating in Greek/social club activities and on a varsity athletic team. In addition, Model 2 included the varsity athletic team leadership variable to control for its confound-ing effect on varsity participation time. Greek/social club leadership was not found to have a confounding effect on participation time and thus was not included in the model.
Both Model 1 and Model 2 passed the Hosmer and Leme-show goodness-of-fit test (Model 1: χ2[8, N = 2,908] = 15.43,
p = .0513; Model 2: χ2[8, N = 2,882] = 8.38, p = .3976). For both models, the ROC curve was .94, indicating that both models fit the data well and had good predictive values (ie,
TABLE 6. Continued
Smoking tobacco in past 30 days
Yes 1.00 1.00
No 1.93***** 1.19, 3.13 1.89****** 1.16, 3.09
Marijuana use in past 30 days
Yes 1.00 1.00
No 7.37* 2.65, 20.52 7.59* 2.69, 21.42
Alcohol use in high school
Drinker 1.00 1.00
Abstainer 4.97* 3.44, 7.18 5.03* 3.48, 7.28
Attitude about alcohol use
Drinking is never good 26.39* 15.24, 45.69 28.12* 16.02, 49.37 Drinking okay, getting drunk not okay 4.83* 3.35, 6.95 4.90* 3.39, 7.07
Getting drunk is okay 1.00 1.00
Perceived friends’ attitude
Drinking is never good 3.25**** 1.46, 7.26 3.07***** 1.36, 6.93 Drinking okay, getting drunk not okay 1.03 0.72, 1.48 0.98 0.68, 1.41
Getting drunk is okay 1.00 1.00
Note. CI = confidence interval; OR = odds ratio. Both Models 1 and 2 are adjusted for the following SCANB control variables not shown in the table: race/ethnicity, personal relationship status, student status, grade point average, location of residence, type of residence, living situation, parental education, number of close student friends, year of survey administration, and timing of survey completion. Both models control for the following confounding variables from the SCANB: father’s alcohol use, participation in community service, other students’ attitude toward drinking, typical students’ past 30-day alcohol use, average number of drinks consumed by male and female students in a week, average number of drinks consumed by male and female students when partying, and other students’ beliefs about the appropriate number of drinks for male and female students to have when partying. In addition, Model 2 includes the varsity athletic team leadership variable to control for its confounding effect on varsity participation time. Full descriptions of these variables can be found in the Methods section.
model-predicted probability of abstention was highly concor-dant with observed abstention in the data).
As an ancillary step, the 2 final models were recalculated using hierarchical nonlinear modeling, which took into account that students were nested in IHEs. Because the odds ratios in the hierarchical nonlinear models were not substantially different from those in the final multivariate logistic regression models, we only report results from the latter in Table 6 and in the following sections.
Control and Background Variables
Male students were found to be 66% to 68% more likely to abstain than female students in this sample (odds ratio [OR] = 1.66 and 1.68 in Models 1 and 2, respectively). Students under age 21 years were almost 3 times as likely to abstain as those aged 21 to 23 years (OR = 2.75 and 2.98 in Models 1 and 2, respectively). Those aged 24 years or older were not significantly different from those aged 21 to 23 years. Even after controlling for age in the multivariate models, freshmen were still found to be nearly 2 times as likely to abstain as seniors (OR = 1.89 in both Models 1 and 2).
In Model 1, students who were not a Greek member or pledge were somewhat more likely to abstain, though this was not statistically significant (OR = 1.60, 95% confidence interval [CI] = 0.96–2.64, p = .0702). In Model 2, students who did not participate in Greek/social club activities were almost 6 times as likely to abstain as those who spent 6+ hours per week in such activities (OR = 5.77). Furthermore, students who spent 1–5 hours per week were 5.5 times as likely to abstain than those who spent 6+ hours per week (OR = 5.50).
In Model 1, nonathletes were found to be almost 2 times as likely to abstain as athletes (OR = 1.76). In Model 2, stu-dents who did not participate in varsity athletic team activi-ties were more than 2 times as likely to abstain as those who spent 6+ hours per week doing so (OR = 2.10). Those who spent 1–5 hours and 6+ hours per week in varsity athletic team activities were not significantly different in their odds of abstention.
Five SCANB control/background variables remained statistically significant in the final models. The remaining 11 control/background variables, which were forced into the final models but are not shown in Table 6, are listed in a footnote to the table.
Categorical Independent Variables
Students whose mother was an abstainer were almost 1.5 times as likely to abstain as those whose mother was a drinker (OR = 1.46 and 1.49 in Models 1 and 2, respec-tively). Students whose closest friend was an abstainer were more than 3 times as likely to abstain as those whose closest friend was a drinker (OR = 3.19 and 3.33 in Models 1 and 2, respectively).
Compared with students who smoked tobacco in the 30 days preceding the survey, those who did not were almost 2 times as likely to abstain from alcohol (OR = 1.93 and 1.89 in Models 1 and 2, respectively). Compared with students who used marijuana in the 30 days preceding the survey,
those who did not were more than 7 times as likely to abstain from alcohol (OR = 7.37 and 7.59 in Models 1 and 2, respectively). As expected, students who abstained from alcohol in high school were approximately 5 times as likely to abstain in college as those who drank in high school (OR = 4.97 and 5.03 in Models 1 and 2, respectively).
Students’ own attitude toward alcohol use appeared to be the strongest associate of their abstaining behavior. Com-pared with students who felt that getting drunk is okay, those who felt that drinking is never a good thing to do were more than 25 times as likely to abstain (OR = 26.39 and 28.12 in Models 1 and 2, respectively). Those who felt that drinking is okay but getting drunk is not okay were almost 5 times as likely to abstain (OR = 4.83 and 4.90 in Models 1 and 2, respectively).
Similarly, those who perceived that their friends felt that drinking is never a good thing to do were more than 3 times as likely to abstain than those who perceived that their friends felt that getting drunk is okay (OR = 3.25 and 3.07 in Models 1 and 2, respectively). Those who perceived that their friends felt that drinking is okay but getting drunk is not okay were not significantly different in their abstaining behavior from those who perceived that their friends felt that getting drunk is okay.
Students who spent 6+ hours per week in religious group activities, compared with those who did not participate, were approximately 7 times as likely to abstain (OR = 6.98 and 7.73 in Models 1 and 2, respectively). Among religious group participants who spent 6+ hours per week, those in a leadership role were 91% less likely to abstain than those not in a leadership role (OR = 0.09 in Models 1 and 2). Religious group participants who spent 1–2 or 3–5 hours per week were not significantly different from those who did not participate.
Compared with students who worked 1–9 hours per week for salary/wages, those who did not work were almost 2 times as likely to abstain (OR = 1.90 and 1.89 in Models 1 and 2, respectively). Those who worked 10+ hours per week were 65% to 70% more likely to abstain (OR = 1.65 and 1.70 in Models 1 and 2, respectively).
COMMENT
The present investigation shows that approximately 1 in 5 undergraduates attending 32 4-year colleges and universi-ties across the United States was a current abstainer. This finding replicates the results of a nationally representative survey of 4-year college students conducted in 2001.5
In this study, a negative attitude toward alcohol use was the strongest predictor of being an abstainer. More than 80% of students who agreed that drinking is never a good thing to do were abstainers. Among students who approved of drinking but not getting drunk, just over one-third were abstainers. More research is needed to explore the develop-ment of a negative attitude toward alcohol and the salient beliefs that support that attitude.
In this context, it is important to underscore that students who did not smoke tobacco or use marijuana were also
more likely to abstain from alcohol. For many students, alcohol abstention may be part of a broader decision to avoid all substance use, an idea consistent with the youth problem-behavior framework.20
Drinking while in high school is a strong predictor of heavy drinking while attending college.21 Similarly, we found that students who abstained in high school were much more likely to abstain in college as well. A better understanding of what encourages students to make a per-sonal decision to abstain while in high school may suggest ways to sustain that decision when they are making the transition into college. To inform this work, more research is needed to explore which individual and environmental factors influence high school abstainers to continue abstain-ing or begin drinkabstain-ing when attendabstain-ing college.
The present study found that proportionately more male than female students abstained from alcohol. Even in the multivariate analysis, with several other fac-tors held constant, men were nearly twice as likely as women to abstain. This result is consistent with a finding reported for the CAS,5 but the present investigation is the first to establish this gender difference as part of a gen-eral examination of predictors and covariates of alcohol abstention. As noted, gender differences in abstention have shifted over time. Abstention rates reported for vari-ous CAS administrations show greater rates of abstention for women in 1993 and 1997 but greater abstention rates for men in 1999 and 2001. This shift, if borne out by other studies, could have major implications for cam-pus-based prevention programs designed to discourage underage alcohol consumption.
Importantly, students under age 21 years were almost 3 times as likely to abstain as students aged 21 to 23 years. This result suggests that the minimum legal drinking age of 21, although imperfectly enforced, may have a restraining effect on underage alcohol consumption. It is important to remember, however, that the data examined here come from a cross-sectional survey. In fact, this finding may be the result of a cohort effect, a possibility that future research can examine. If longitudinal studies confirmed this finding, this would reinforce the need for stricter and more consis-tent enforcement of minimum age drinking laws.22
Even after adjusting for the effect of age, freshmen were found to be nearly twice as likely to abstain, compared with seniors. Abstention rates for sophomores and juniors were intermediate. This finding cannot be attributed to the ages of the students, as age and student classification are signifi-cant predictors in the final multivariate logistic regression models. Instead, this pattern of results suggests that expo-sure to college drinking norms gradually induces larger and larger proportions of students to begin drinking alcohol.
This study found that maternal but not paternal absti-nence from alcohol significantly increased the odds of a student being an abstainer. Despite the cross-sectional study design, there is a clear temporal relationship here, which suggests that the mother’s abstinence was a causal factor in determining the student’s decision to abstain while
attend-ing college. Further research is needed to explore why the mother’s abstinence may have greater influence. Campus-based prevention programs should try to maximize the influence of parents who abstain or drink lightly.
Students whose closest friend was an abstainer were more than 3 times as likely to abstain as those whose closest friend was a drinker. Students who abstained were also more likely to state that their friends believe that drinking is never a good thing to do. Without longitudinal research, it is impossible to know whether these findings are the result of peer influ-ences or the result of abstainers simply choosing like-minded friends. In the context of a community-based prevention trial, other researchers have suggested that similarity in alcohol use among adolescent friends may be more related to peer influence processes than to friendship selections.23
Being a Greek member or pledge was not negatively asso-ciated with being an abstainer. On the other hand, students who did not participate or who spent only 1–5 hours per week participating in Greek or social club activities were more than 5 times as likely to abstain as students who spent 6+ hours per week. Hence, membership itself is not a useful predic-tor, but level of participation is. It is important to note that students can participate in Greek/social club activities with-out being a member or pledge. These findings suggest that college administrators can promote delayed onset of alcohol consumption through policies designed to restrict underage students’ participation in these social organizations.
Previous research has shown that college athletes are more likely than other students to engage in heavy drink-ing.24 We found that nonathletes were more likely to abstain than students involved in intercollegiate athletics. Athletic coaches and other college administrators need to redouble their efforts to discourage alcohol use among student ath-letes, especially among underage students.
Students who participated in religious group activities for 6+ hours per week were 7 times as likely to be abstainers as nonparticipants, whereas those who spent only 1–5 hours per week did not differ significantly from nonparticipants. This finding suggests that some minimum level of par-ticipation is needed before parpar-ticipation in a religious group acts as a protective factor against alcohol consumption. Future research is needed to identify what mediates this effect. Another intriguing finding worthy of future study is that among the religious group participants who spent 6+ hours per week, those in a leadership role were much less likely to abstain than those who were not in a leadership role. Meanwhile, as a prevention strategy, campus officials should ensure that students are aware of campus religious groups they may wish to join.
Students who did not work for salary or wages and those who worked 10+ hours per week were more likely to abstain than those who worked 1–9 hours per week. Future research is needed to explore this pattern of results. Other research has shown that adolescents aged 14–17 years who work are more likely to drink than those who do not work.25 There may be demographic differences between these 2 groups of adolescents. In addition, those who work have
more disposable income and may be more often exposed to adults and peers who drink. Similar factors may operate among college students. At the same time, students who work 10+ hours per week may be more dependent on this income to support themselves while in school, rather than to generate disposable income.
In the present study, univariate analysis showed that hav-ing a higher GPA had a small but significant association with abstention, but it did not remain as an independent predictor in the multivariate logistic regression models. Similarly, other studies have shown that problematic alco-hol use is associated with academic difficulties, but that the magnitude of this association is weaker when additional predictors of academic failure are taken into account.26–27
Limitations
Three limitations of the study should be noted. First, we relied solely on student self-report to determine abstention status. Using self-report from anonymous or confidential questionnaires is a commonly accepted method in substance use studies with college students, producing population-level data that are generally valid and reliable.28–30 That said, future studies of abstention should consider using additional meth-ods to validate self-reports, such as reports from best friends or family members. An important strength of the study is that to be classified as an abstainer, a student had to report no alcohol use in response to all 4 consumption questions, a method that greatly improves classification accuracy.31
A second limitation is our survey response rate of 56.2%. Clearly, response rates at this level reduce the generalizabil-ity of the findings. That noted, our response rate is compa-rable to those of other recent national studies, most notably the widely cited CAS, which had a response rate of 52% in its most recent survey in 2001.5
A third limitation is that the students in our sample were not drawn from a randomly selected set of colleges and universities. To investigate whether our sample was typical of the larger college student population, we compared our sample (SCANB) with the 2001 CAS, which was drawn from a randomly selected set of 119 4-year institutions.5 The 2 student samples are comparable (all percentages are listed as CAS v. SCANB): (1) female, 64.0% vs 61.1%; (2) under age 21–years, 50.2% vs 52.8%; (3) White, 74.0% vs 76.3%; (4) freshman, 23.0% vs 22.9%; (5) fraternity/soror-ity member, 12.0% vs 13.2%; (6) heavy, episodic drinking (defined for men as 5 or more drinks at 1 sitting in the last 2 weeks, and for women as 4 or more drinks), 44.4% vs. 46.3%; and (7) abstaining, 19.3% (self-report for past year) vs. 20.5% (consistent response to 4 consumption measures). These findings suggest that our sample is representative, or at least typical, of the general college student population.
Conclusion
By closely examining the sociodemographic and psy-chobehavioral characteristics of college students who chose not to drink, we identified several key variables that dif-ferentiate abstainers from their peers who drink. Additional
research on abstainers is clearly warranted. For campus-based prevention programs to be optimally effective, it is crucial that program planners have a better understanding of how negative alcohol expectancies and motives not to drink are developed.
ACKNOWLEDGMENTS
This study was supported by grant R01-AA-12471 from the National Institute on Alcohol Abuse and Alcoholism and the US Department of Education, Education Development Center. The views expressed in this article are those of the authors and do not necessarily reflect the official position of the NIAAA or the US Department of Education.
The authors gratefully acknowledge the substantial con-tributions made by members of the research team, espe-cially Jennifer Allard, Ingrid Bruns, Karen Kaphingst, Amy Stern, and Cameron Ware.
NOTE
For comments and further information, please address correspondence to Dr William DeJong, Boston Univer-sity School of Public Health, Social and Behavioral Sci-ences, 715 Albany St, Boston, MA 02118, USA (e-mail: wdejong@bu.edu).
REFERENCES
1. Hingson R, Heeren T, Winter M, Wechsler H. Magnitude of alcohol-related mortality and morbidity among US college stu-dents ages 18–24: changes from 1998 to 2001. Annu Rev Public Health. 2005;26:259–279.
2. O’Malley PM, Johnston LD. Epidemiology of alcohol and other drug use among American college students. J Stud Alcohol Suppl. 2002;14:23–39.
3. Baer JS. Student factors: understanding individual variation in college drinking. J Stud Alcohol Suppl. 2002;14:40–53.
4. Presley CA, Meilman PW, Leichliter JS. College factors that influence drinking. J Stud Alcohol (suppl). 2002;14s:82s–90s.
5. Wechsler H, Lee JE, Kuo M, Seibring M, Nelson TF, Lee H. Trends in college binge drinking during a period of increased prevention efforts: findings from 4 Harvard School of Pub-lic Health College Alcohol Study surveys. J Am Coll Health. 2002;50:203–217.
6. Wechsler H, Lee JE, Gledhill-Hoyt J, Nelson TF. Alcohol use and problems at colleges banning alcohol: results of a national survey. J Stud Alcohol. 2001;62:133–141.
7. Hillman SB, Haskin JM. Personality and drug abstention in adolescents. Psychol Rep. 2000;87:1023–1026.
8. Leigh BC, Stacy AW. Alcohol expectancies and drinking in different age groups. Addiction. 2004;99:215–217.
9. Darrow SL, Russell M, Cooper ML, Mudar P, Frone MR. Sociodemographic correlates of alcohol consumption among Afri-can-American and white women. Womens Health. 1992;18:35–51.
10. Spoth R, Redmond C, Hockaday C, Yoo S. Protective fac-tors and young adolescent tendency to abstain from alcohol use: a model using two waves of intervention study data. Am J Com-munity Psychol. 1996;24:749–770.
11. Webster DW, Harburg E, Gleiberman L, Schork A, DiFran-ceisco W. Familial transmission of alcohol use: I. Parent and adult offspring alcohol use over 17 years–Tecumseh, Michigan. J Stud Alcohol. 1989;50:557–566.
12. Plant MA, Orford J, Grant M. The effects on children and adolescents of parents’ excessive drinking: an international review. Public Health Rep. 1989;104:433–442.