www.elsevier.comrlocatermarchem
Nutrient budgets for the South China Sea basin
Chen-Tung Arthur Chen
a,), Shu-Lun Wang
b,1, Bing-Jye Wang
a,2, Su-Cheng Pai
c,3 aInstitute of Marine Geology and Chemistry, National Sun Yat-sen UniÕersity, Kaohsiung 804, Taiwan, ROC
b
Department of Marine EnÕironmental Engineering, National Kaohsiung Institute of Marine Technology, Kaohsiung 811, Taiwan, ROC
c
Institute of Oceanography, National Taiwan UniÕersity, Taipei, Taiwan, ROC Received 8 July 1999; received in revised form 23 April 2001; accepted 24 April 2001
Abstract
Ž . Varying atmospheric forcing and an elaborate geography make for a complex flow in the South China Sea SCS . Throughout the year, the surface waters of the Kuroshio flow into the SCS, while the surface waters of the SCS flow out
Ž . Ž .
through the Bashi Channel. Cumulatively, there is a small ; 1 Sv net outflow of surface water 0–350-m depth from the
Ž .
SCS in the wet season, but a net inflow ; 3 Sv in the dry season through the Bashi Channel. The differences are mainly made up by inflow and outflow of Sunda Shelf Water in the wet and dry seasons, respectively.
Seawater, phosphorus, nitrogen and silicate budgets were calculated based on a box model. The results point out an
Ž . Ž .
intermediate water outflow 350–1350-m depth into the West Philippine Sea WPS through the Bashi Channel in both the Ž .
wet and dry seasons, though this, along with the nutrients it carries, is slightly larger in the dry season 2 Sv than in the wet Ž1.8 Sv . More importantly, the export of nutrient-laden SCS intermediate water through the Bashi Channel subsequently.
Ž . y2 y1
upwells onto the East China Sea ECS shelf. The denitrification rate for shelves in the SCS is 0.11 mol N m year , calculated by balancing the nitrogen budget. The oxygen consumption and the nutrient regeneration rates, based on the mass-balance and the one-dimensional advection–diffusion models, stand between those for the Bering Sea and the Sea of Japan. q 2001 Elsevier Science B.V. All rights reserved.
Keywords: South China Sea; East China Sea; Nutrient budgets; Flux; Denitrification; Upwelling
1. Introduction
Ž .
The South China Sea SCS is the largest marginal sea in the world with an area of 3.5 = 106 km2 and
)
Corresponding author. Tel.: 525-5146; fax: q886-7-525-5346.
Ž .
E-mail addresses: ctchen@mail.nsysu.edu.tw C.-T.A. Chen ,
Ž .
slwang@mail.nkimt.edu.tw S.-L. Wang , scpai@ccms.ntu.edu.tw
ŽS.-C. Pai .. 1 Fax: q886-7-364-5672. 2 Fax: q886-7-525-5346. 3 Fax: q886-2-2362-7358.
an average depth of about 1350 m. The southern and southwestern regions comprise the shallow Sunda Shelf and the Gulf of Thailand, with an average depth of 50 m. Although the Sunda Shelf connects to the Indian Ocean through the Strait of Malacca, the major passage is to the Java Sea through the even shallower Karimata and Gelasa Straits. The northern and northwestern regions are wide shelves leading to
Ž .
the East China Sea ECS through the 50-m deep Taiwan Strait. The central and northeastern parts of the SCS are rather deep, at over 5500 m in some places. The only deep connections from any part of the SCS to the outside are the 400-m deep Mindoro 0304-4203r01r$ - see front matter q 2001 Elsevier Science B.V. All rights reserved.
Ž .
( ) C.-T.A. Chen et al.r Marine Chemistry 75 2001 281–300 282
Strait, which leads to the Sulu Sea, and the 2200-m deep Bashi Channel, which opens to the Philippine Sea. The seasonally reversing monsoon winds play an important role in determining the upper ocean circulation, but the combination of such variable atmospheric forcing and the complex geometry con-tributes to the complicated dynamics of the flow in the SCS.
One example illustrates the complexity of the system. In November 1990, based on the Acoustic
Ž .
Doppler Current Profiler data, Chen 1995 observed a westward inflow of Kuroshio water above 400 m in the northern Bashi Channel, but an eastward outflow in the central Bashi Channel. A month later,
Ž .
based on geostrophic calculations, Liu et al. 1996 reported an outflow in the northern Bashi Channel above 1000 m and an inflow in the central and southern Channel. Even more complicated in the SCS are the nutrient dynamics, which have been poorly studied and are, therefore, little understood. These are very much subject to flow patterns within the area. Previous flux studies have often given a net
Ž
flow in or out of the Bashi Channel e.g. Wyrtki,
.
1961 . However, the surface Kuroshio water that flows into the SCS is salty, but relatively nutrient poor, and what raised questions is that the surface water that flows out of the SCS is relatively fresh, but slightly nutrient rich. A net seawater flux is not at all informative in itself as it may actually be on the opposite direction of the salt and nutrient fluxes. It is clear that both the inward and outward fluxes through the Bashi Channel must be investigated.
Further, the SCS is a major fishing ground, with the fishing industry providing the livelihood of mil-lions of fishermen in the surrounding territories. Like the ECS, the SCS receives large amounts of nutrients in the form of river discharge to support
productiv-Ž .
ity. But it has been pointed out Chen, 1996 that even with two of the largest rivers in the world,
Ž .
namely the Changjiang Yangtze River and the
Ž .
Hunghe Yellow River , the ECS receives only a small portion of its nutrient input from rivers. In-stead, upwelling is the major source of nutrients
ŽChen et al., 1995 . The SCS also experiences inten-. Ž
sive upwelling Chen and Huang, 1995; Chao et al.,
.
1996 , but the share of its contribution to the eu-photic zone compared with that of river discharge has not been determined. We have taken several
cruises aboard the RrV Ocean Researcher 1 in the SCS and, in particular, near the Bashi Channel. Here, we report data from two cruises and preliminary seawater and nutrient budgets based on a box model. The rates of oxygen consumption and nutrient regen-eration were calculated based on the mass-balance and one-dimensional advection–diffusion models.
2. Sampling locations and methods
As part of the World Ocean Circulation
Experi-Ž .
ment WOCE , data were collected on board RrV
Ž .
Ocean Researcher 1 OR . OR cruise No. 462
cov-Ž
ered the Pacific Repeated Section 20 PR 20, across
21845XN from below the southern tip of Taiwan to
.
1308E in September 1996. Fig. 1 shows a segment of the section covered near the Bashi Channel. The OR cruise No. 508 traversed a greater portion of the SCS in November 1997, as part of the South China
Ž .
Sea Monsoon Experiment SCSMEX . The locations of the sampling stations are shown in Fig. 1. The shipboard temperature and salinity were determined with an SBE 911 plus CTD
Conductivity–Tempera-Ž .
ture–DepthrPressure CTD unit manufactured by Sea-Bird. Discrete samples were collected at various depths with a Rosette sampler fitted with 2.5-l Niskin bottles and mounted on the Sea-Bird CTD unit for the determination of salinity, dissolved oxygen, ni-trite, nitrate, phosphate and silicate. Data from the sensors of the CTD units were obtained during both the downcast and upcast. Discrete water samples were picked up during the upcast. The CTD unit was lowered and raised at a rate of about 1.0 mrs
Ž .
Salinity S in the discrete samples was
deter-mined by measuring conductivity with an AU-TOSAL salinometer, which was calibrated with
Ž .
IAPSO standard seawater batch No. P128 . The
precision of the measurements was 0.003. The data from the AUTOSAL were used to check salinity of the CTD. Dissolved oxygen in the discrete samples
Ž
was measured by direct spectrophotometry Pai et
.
al., 1993 , with a precision of about 0.32% at the 190
y1
Ž y1. Ž y1.
mmol kg level. Nitrate NO3 plus nitrite NO2
was measured by reducing nitrate to nitrite, and then identifying nitrite by means of the pink azo dye
Ž .
wŽ . Ž .
Fig. 1. OR 508 station locations and the WOCE PR 20 line. Arrows indicate, schematically, major surface currents 1 Kuroshio; 2
Ž . Ž . Ž . Ž .
outflowing SCS surface water; 3 Kuroshio branch; 4 outflowing SCS surface water; 5 incoming China coastal current in winter; 6
Ž . Ž . x
incoming Sulu Sea water through the Mindoro Strait; 7 outflowing SCS surface water in winter and; 8 incoming Sunda Shelf Water .
injection analyzer with an on-line Cd coil. The
preci-sion of this method was about 1% at 35 mmol kgy1
,
y1
Ž y1.
and 3% at 1 mmol kg . Nitrite NO2 was
deter-Ž
mined from the pink azo dye method Strickland and
.
Parsons, 1972; Pai et al., 1990a using a flow
injec-tion analyzer for a precision of 0.02 mmol kgy1
.
Ž y3.
Phosphate PO4 was studied under the
molybde-Ž
num blue method Murphy and Riley, 1962; Pai et
.
al., 1990b using a flow injection analyzer. The
precision of the measurements was about 0.5% at 2.8
mmol kgy1
and 3% at 0.1 mmol kgy1
. Silicate
ŽSiO2. was measured with the silicomolybdenum
Ž .
blue method Fanning and Pilson, 1973 using a flow injection analyzer. The precision of the method was
about 0.6% at 150 mmol kgy1
and 2% at 5 mmol kgy1
( ) C.-T.A. Chen et al.r Marine Chemistry 75 2001 281–300 284
Ž . Ž . Ž . Ž . 3y Ž . y Ž .
Ž .
( ) C.-T.A. Chen et al.r Marine Chemistry 75 2001 281–300 286
Ž .
3. Description of results
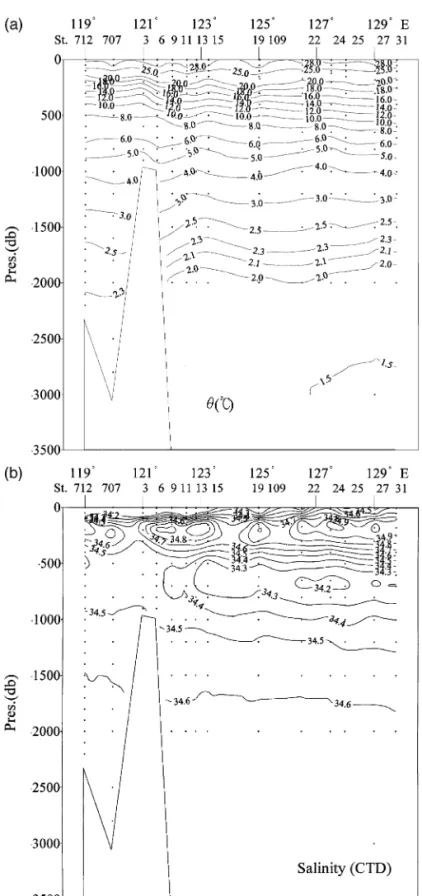
In Fig. 2, the vertical distribution of the West
Ž .
Philippine Sea WPS water is characterized by
ex-Ž
tremes in salinity. A shallow salinity maximum S )
. X
35.0 is centered at approximately 150 m at 21845 N, 1308E. The maximum salinity layer clearly extends to the SCS, but the salinity is reduced to below 34.8
X
Ž .
at 21845 N, 1198E in the SCS Fig. 2 . A pronounced
Ž
minimum salinity core the North Pacific
Intermedi-.
ate Water, S - 34.2 at about 600 m in the WPS extends to a lesser degree across the Bashi Channel into the SCS and shoals to about 500 m, while the minimum salinity increases to above 34.4. The corre-sponding east–west temperature contours also shoal toward the west. Intensive upwelling and vertical mixing tend to reduce the extreme signals in the SCS; thus, making both salinity extremes less
pro-Ž .
nounced Fig. 2 .
Ž .
Chen and Huang 1996 and Chen and Wang
Ž1998 reported that a mid-depth boundary between.
350 and 1350 m encompassing the Smin layer seems
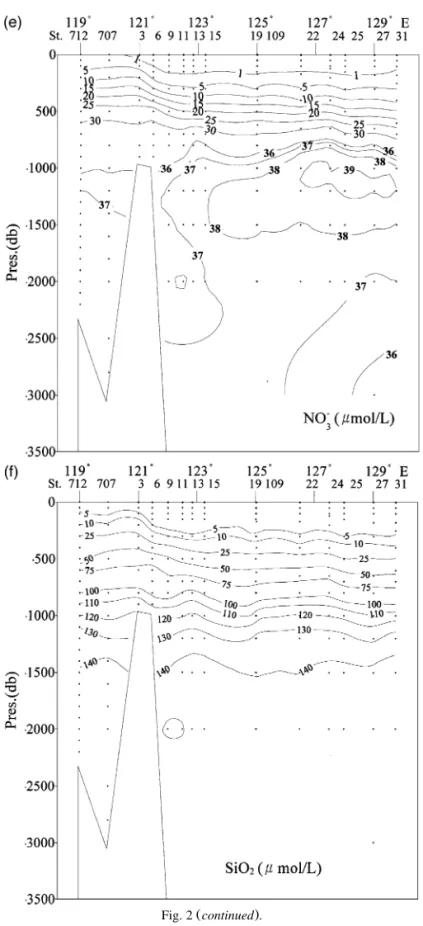
to exist near 1228E above the continental slope near the Bashi Channel. To the east of it, the water mass belongs to the WPS, whereas to the west, it is mainly SCS water. The S s 34.4 contour does not extend to the interior of the SCS. In terms of chemical parame-ters, the most striking difference between the SCS and WPS is that the apparent oxygen utilization
ŽAOU, based on the oxygen solubility equation of
.
Chen, 1981 , nitrate and phosphate all show a
maxi-Ž .
mum at about 1200 m in the WPS Fig. 2 . This is typical in many open oceans. Yet, the maximum is
Ž
not as apparent in the SCS Gong et al., 1992; Chen
.
and Huang, 1995, 1996; Chen and Wang, 1998 . This intermediate water at 1200 m in the WPS does flow into the SCS, but not to any great extent.
Ž .
Observational data Chen and Huang, 1996 and
Ž .
model calculations Chao et al., 1996 have shown that SCS Intermediate Water, defined by Chen and
Ž .
Huang 1996 as between 350 and 1350 m, and by
Ž .
Chao et al. 1996 as between 600 and 1200 m, also flows out of the SCS year-round. That the intermedi-ate wintermedi-ater in the WPS flows into the SCS cannot be ignored, if it did not, there would be no salinity minimum, however weak, nor maximum in other chemical properties at all. What is important to note, however, is that outflow far surpasses inflow.
Ž
Previous studies Wang, 1986; Liu and Liu, 1988;
.
Chao et al., 1996 consistently point out that the SCS deep and bottom waters originate in the WPS year-round, and intensive upwelling and vertical mixing occur in the SCS. The Luzon Strait, with the deepest sill at 2200 m, forms the only deep connection between the WPS and the SCS, thus the physical and chemical properties remain essentially constant be-low 2200 m in the SCS. It is to be noted that because of the low dissolution rate of siliceous shells, silicate does not show a maximum in either the SCS or the WPS, and the concentration increases steadily with depth. The rate of increase is high above 1500 m, but very much reduced below. Of significance, for wa-ters above 1000 m, the nutrient contours all shoal westwardly from the WPS to the SCS.
Ž .
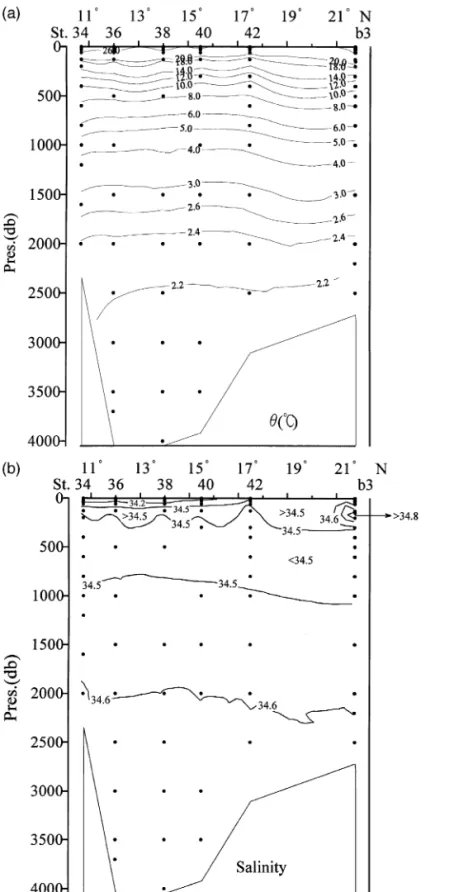
Chen and Huang 1995 reported that the SCS flushes rather quickly, on the order of 40 years, which means the intermediate, deep and bottom wa-ters are essentially the same age. Because of the short residence time, the amount of particulate matter decomposition in the water column is sufficient to produce only a small maximum of chemical proper-ties in the vertical profiles. These profiles look more like the Atlantic instead of like the Pacific, where deep waters are much older than that in the Atlantic. Waters in the SCS proper can be said to be relatively uniform, especially those below 2000 m. Fig. 3a–f shows the north–south cross-sections of u , S, AOU, nitrate, phosphate and silicate in the eastern part of the SCS basin. The potential temperature is above 2.1 8C even at 4000 m, and this is almost 0.8 8C warmer than in the WPS at the same depth. The salinity is also quite uniform at about 34.6 " 0.1 below 1000 m. However, there is a weak salinity minimum layer at about 500 m with a weak salinity maximum above it. These signatures, albeit weak, can be traced to their sources in the WPS. At stations south of 208N, a thin layer of fresher water with salinity below 33.05 lies near the surface. This low-salinity water clearly has its origin in the southern SCS.
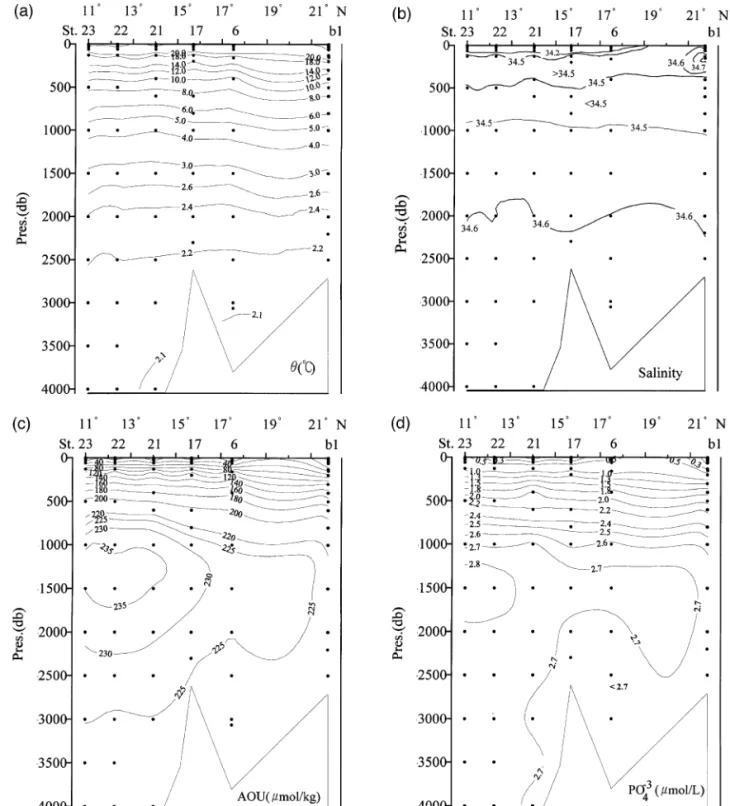
Fig. 3c shows the north–south cross-section of AOU in the eastern SCS basin. All waters deeper than about 2000 m originate in the 2000-m deep WPS water outside the Bashi Channel. The incoming waters sink, spread out, upwell, turn around and finally flow out of the SCS as intermediate water
( ) C.-T.A. Chen et al.r Marine Chemistry 75 2001 281–300 288
Ž . Ž . Ž . Ž . 3y Ž . y Ž .
Fig. 3. North–south cross-sections of a u , b S, c AOU, d PO4 , e NO3 and f SiO for OR 508 in the eastern part of the South2
Ž .
Fig. 3 continued .
through the channel. The AOU data below 800 m are consistent with the flow pattern: younger waters with
AOU below 225 mmol kgy1
exist throughout the
water column at the northernmost station, but exist only in the bottom water at the more southern sta-tions. An AOU maximum, signifying older water,
( ) C.-T.A. Chen et al.r Marine Chemistry 75 2001 281–300 290
exists at about 1500 m, and the signal seems to be
Ž
clearer in the more southern stations. Nitrate Fig.
. Ž .
3d and phosphate Fig. 3e also have a maximum at
Ž .
about 1500 m or slightly shallower. Silicate Fig. 3f , however, has a deeper maximum at about 2200 m because the dissolution rate of siliceous shells is
Ž . Ž . Ž . Ž . 3y Ž . y Ž .
Fig. 4. North–south cross-sections of a u , b S, c AOU, d PO4 , e NO3 and f SiO for OR 508 in the western part of the South2
Ž .
Fig. 4 continued .
lower than the decomposition rate of organic parti-cles. These nutrient data are also consistent with the flow pattern.
Fig. 4a–f shows the corresponding north–south cross-sections of u , S, AOU, nitrate, phosphate and silicate in the western part of the SCS basin. The general features are similar to those found in the eastern basin, which is consistent with the notion that the SCS flushes rapidly. The bottom water is ex-tremely homogeneous, with a salinity of 34.608 " 0.001 in both the eastern and western basins and a potential temperature of 2.11 " 0.02 8C. Within the precision of our measurements, no systematic differ-ences in physical or chemical parameters could be distinguished for the bottom waters in the cross-sec-tions.
4. Water and salt budgets
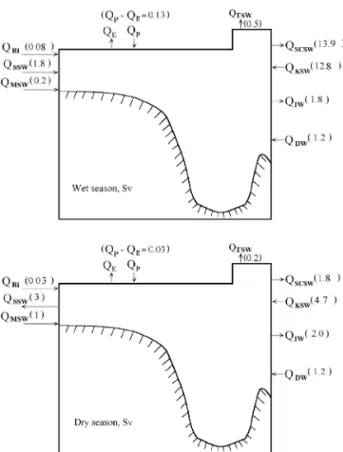
The principle of conservation of water mass and salt is applied to estimate water fluxes that have not been measured directly. Since there is a large sea-sonal contrast in the SCS, budgets are calculated for both wet and dry seasons. The principle of conserva-tion of water mass dictates that the water flowing into the SCS must be balanced by the water flowing out plus the water piled up within the SCS. Over the years, there can be no accumulation, but there is indeed a sea-level change between wet and dry seasons. Given that the sea level varies 10 cm be-tween the wet and dry seasons, the water balance for the SCS is:
Q q Q q Q qQ qQ qQ
Ri P SSW MSW KSW DW
sQ q QE TSWqQSCSWqQIWqD Q,
Ž .
1where Q is the water flux in weight unit, and the subscripts Ri, P, SSW, MSW, KSW, DW, E, TSW, SCSW and IW denote river input, precipitation, Sunda Shelf water, Mindoro Strait water, Kuroshio surface water, deep water, evaporation, Taiwan Strait water, SCS surface water and intermediate water, respectively. DQ denotes the accumulation or release of water due to sea-level changes. All fluxes are average values for the wet and the dry seasons, each 6 months long.
( ) C.-T.A. Chen et al.r Marine Chemistry 75 2001 281–300 292
Fig. 5. Water budgets in the wet and dry seasons.
Because of large differences between the wet
ŽMay–October and dry seasons November–April ,. Ž .
Ž .
the box model Fig. 5 was applied for each season.
Ž .
In the wet season, the volume of precipitation QP
Ž . 6 y1
exceeds evaporation QE by 0.13 = 10 t s . The
volumes of groundwater and sewage inflows are not known, but are assumed to be 10% of the river
Ž 6 y1.
runoff. The QRi 0.08 = 10 t s therefore
repre-Ž
sents the sum of all three Wyrtki, 1961; Han, 1995;
.
Milliman et al., 1995 . The salt balance is:
Q S q Q S qQ S Ri Ri SSW SSW MSW MSW qQKS WSKSWqQDWSDW sQTSWSTSWqQSCSWSSCSWqQIWSIWqD Q ,S 2
Ž .
where S is the salinity and DQ is the accumulationS
or release of salt mainly due to the difference in salinity between the wet and dry seasons.
The salinity of various water masses is listed in Table 1. The flow through the Strait of Malacca is taken as zero. For the wet season, the Java and Sulu
6 y1
Ž .
Seas export 2 = 10 t s seawater QSSW; Table 1
into the SCS. The outflow through the Taiwan Strait
6 y1
Ž .
is 0.5 = 10 t s QTSW . The intermediate water
between 350 and 1350 m is a mixture of the up-welled deep water and surface water. The deep water
Table 1
Ž 6 y1.
Salinity and water fluxes =10 t s of various water masses for the South China Sea
Wet season Dry season References
S Flux S Flux
Ž . Ž . Ž .
Ri 0 0.08 "0.02 0 0.03 "0.01 Milliman et al. 1995 , this work
Ž .
Q y QP E 0 0.13 0 0.03 Wyrtki 1961
Ž . Ž . Ž .
SSW 32.2 1.8 32.4 y3 Wyrtki 1961 , Chu 1972 , NOAA 1994a ,
Ž .
Frische and Quadfasel 1990
Ž . Ž .
MSW 33.4 0.2 33.4 1 Wyrtki 1961 , INDOPAC 1978 ,
Ž . Ž .
Frische and Quadfasel 1990 , NOAA 1994a
Ž . Ž .
TSW 33.8 y0.5 34 y0.2 Fujien Oceanological Institute 1988 , Zhang et al. 1991 ,
Ž . Ž .
Wang and Chen 1992 , Wang and Yuan 1997 ,
Ž .
Chen and Wang 1999
Ž . Ž . Ž .
SCSW 34.33 y13.9 "1.8 34.4 y1.8 "0.2 Chen et al. 1996a, 1997, 1998 , this work
Ž . Ž . Ž .
KSW 34.75 12.8 "1.1 34.85 4.7 "0.4 Chen et al. 1996a, 1997, 1998 , this work
Ž . Ž . Ž . Ž .
IW 34.51 y1.8 "0.4 34.52 y2.0 "0.4 Han 1995 , Chen et al. 1996a, 1997, 1998 , this work
Ž . Ž . Ž . Ž .
DW 34.6 1.2 "0.2 34.6 1.2 "0.2 Liu and Liu 1988 , Chen et al. 1996a, 1997, 1998 Positive and negative numbers represent inflow and outflow, respectively.
below 1350 m flows into the SCS year-round at the 6 y1 Ž . rate of 1.2 = 10 t s QDW : Q sQ qQ ,
Ž .
3 IW DW Smix and Q S sQ S qQ S ,Ž .
4 IW IW DW DW Smix SCSWwhere QSm ix is the amount of surface water mixed
in. The QIW calculated from these two equations for the wet season is 1.5 Q or 1.8 = 106 t sy1
, which
DW
Ž
flows out of the SCS Chao et al., 1996; Chen and
.
Huang, 1996; Chen et al., 1996a, 1997 .
As for salt balance, it is assumed that the annual average conditions remain steady over a long time period in the SCS, but that in the wet season, the surface water above 350 m becomes fresher with exports of 8.8 = 1019 g of salt. In the dry season, the SCS accumulates the same amount of salt. Given the above, the amount of surface water flowing out of
Ž .
the SCS through the Bashi Channel QSCSW in the
wet season is calculated at 13.9 = 106 t sy1
and the
Ž .
Kuroshio water flowing into the SCS QKS W is
6 y1
Ž .
12.8 = 10 t s Fig. 2 .
For the dry season, Q y Q s 0.03 = 106 t sy1
P E
and Q s 0.03 = 106 t sy1
. The SCS exports 3 =
Ri
106 t sy1
seawater into the Java Sea but imports 1 = 106 t sy1
from the Sulu Sea. The outflow through the Taiwan Strait is 0.2 = 106 t sy1
. The
deep inflow is taken as 1.2 = 106 t sy1
and the intermediate water outflow is 1.67 QDW or 2.0 = 106
y1 Ž . Ž .
t s based on Eqs. 3 and 4 . From the box model,
the Q is calculated at 1.8 = 106 t sy1
, and the
SCSW
Q at 4.7 = 106 t sy1
. Indeed, higher fluxes have
KS W
been observed in the Bashi Channel, but a large portion of the exchange is at or near the channel and
Ž
does not really enter the SCS Wyrtki, 1961; Chao et
.
al., 1996; Chen and Huang, 1996 .
The exchange time of deep water in the system
Ž
can be calculated simply as t s the mass in the SCS
. 15 6 y1
below 1350 m rQDWs1.5 = 10 tr1.2 = 10 t s ;
thus t s 40 years. For the intermediate water, t s
Žthe mass in the SCS between 350 and 1350 m rQ. IW.
The relevant mass is 0.7 = 1015 t, and the average
Q is 1.9 = 106t sy1
, so t s 12 years relative to its
IW
source deep water, making the residence time of the intermediate water in the SCS 52 years. For the
Ž
surface layer in the wet season, t s the mass in the
. Ž SCS above 350 m r Q q Q y Q q QRi P E SSWq . 15 Ž QMS WqQKSW s1.23 = 10 tr 0.08 q 0.13 q 1.8 . 6 y1 q0.2 q 12.8 = 10 t s , hence t s 2.6 years. In Ž
the dry season, the surface exchange time is t s the
. Ž
mass of the SCS above 350 m r Q q Q y Q qRi P E
. 15 Ž
Q qQ s1.23 = 10 tr 0.03 q 0.03 q 1 q
MS W KSW
. 6 y1
4.7 = 10 t s ; so t s 6.8 years.
These exchange rates for the surface water are all longer than 6 months mainly because a rather thick
Ž .
surface layer 350 m was selected in this study. The exchange rate for the top layer must be much higher than the layer below, say at 100 m. On average, the 350-m-thick surface layer has a residence time of about 4.7 years.
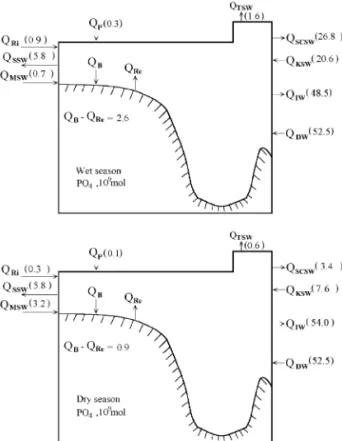
5. Phosphorus budgets
The P balance is represented as:
Q Y q Q Y qQ Y Ri Ri SSW SSW KSW KSW qQ Y qQ q Q DW DW P Re sQ Y qQ Y qQ Y qQ , TSW TSW SCSW SCSW IW IW B 5
Ž .
where Y denotes the concentration of P in eachmedium, QP is the aerosol input, and QRe and QB
are the amounts of P released from or deposited to the sediments. The relevant fluxes are given in Table 2 and in Fig. 6. There is an imbalance of 1.1 = 109 mol in the wet season, i.e. an accumulation of P. The imbalance of P in the dry season is y1.1 = 109 mol, i.e. export of P. These figures and the zero annual imbalance all fall within the uncertainties of the calculation, lending support to the internal consis-tency of the water fluxes. It is noteworthy that the SCS exports P through the Bashi Channel because the import of P by the relatively P-poor KSW is not sufficient to compensate for the export by the rela-tively P-rich SCSW. In addition, the outflowing intermediate water, with essentially all of its P sup-plied by the deep water, turns northward after leav-ing the Bashi Channel. Subsequently, this water upwells onto the ECS shelf, providing P to the shelf
Ž
water which is short of P relative to N Chen et al.
.
insignifi-( ) C.-T.A. Chen et al.r Marine Chemistry 75 2001 281–300 294
Table 2
Ž y1. Ž 9 .
Concentrations mmol kg and fluxes =10 mol for 6 months of P for the South China Sea
Wet season Dry season References
Concentration Flux Concentration Flux
Ž . Ž . Ž . Ž . Ž .
Ri 0.7 0.9 "0.2 0.7 0.3 "0.06 Meybeck 1993 , Han 1995 , Zhang 1996
Ž . Ž . Ž .
SSW 0.2 5.8 0.12 y5.8 Wyrtki 1961 , Chu 1972 , NOAA 1994b
Ž . Ž .
MSW 0.2 0.7 0.2 3.2 INDOPAC 1978 , NOAA 1994b ,
Ž .
San Diego-McGlone et al. 1999
Ž .
TSW 0.2 y1.6 0.2 y0.6 Fujien Oceanological Institute 1988 ,
Ž . Ž . Ž .
Wang 1991 , Hong 1994 , Hong and Dai 1994 ,
Ž .
Chen and Wang 1998, 1999
Ž . Ž . Ž . Ž .
SCSW 0.12 y26.8 "3.5 0.12 y3.4 "0.3 Han 1995 , Chen et al. 1996a, 1997, 1998 , this work
Ž . Ž . Ž .
KSW 0.1 20.6 "1.9 0.1 7.6 "0.7 Chen et al. 1996a, 1997, 1998 , this work
Ž . Ž . Ž . Ž .
IW 1.67 y48.5 "9.6 1.67 y54.0 "10.8 Han 1995 , Chen et al. 1996a, 1997, 1998 , this work
Ž . Ž . Ž . Ž .
DW 2.71 52.5 "10.5 2.71 52.5 "10.5 Han 1995 , Chen et al. 1996a, 1997, 1998 , this work
Ž . Ž .
B–Re y2.6 "0.8 y0.9 "0.3 Lai and Liu, 1994,
Su and Wang, 1994, Wang, 1999, this work Positive and negative numbers represent inflow and outflow, respectively.
cant role in sustaining high productivity in either the
Ž .
ECS Chen and Wang, 1999 or the SCS. The net P deposition in the sediment alone is greater than the
Fig. 6. P budgets in the wet and dry seasons.
riverine input. Supplies from the Sulu Sea and from upwelling provide the P needed for new production.
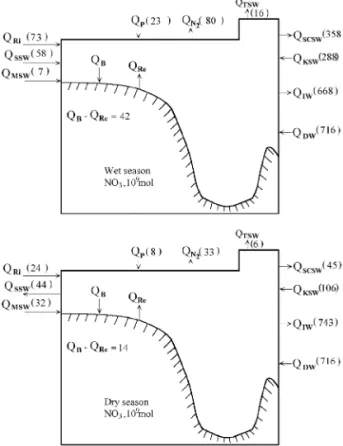
6. Nitrogen budgets
Nitrogen fluxes are more complicated since acid
Ž .
deposition QP adds nitrogen to the SCS. Further,
nitrogen fixation by cyanobacteria utilizes N ,2
thereby contributing additional nitrogen to the SCS. On the other hand, denitrification converts nitrate to
NH , N O and N , which degas at the air–sea3 2 2
interface. No data regarding either nitrogen fixation or denitrification in the SCS is available. The
un-known net air–sea exchange is taken to be Q ,N
2
which is calculated by balancing the nitrogen budget:
Q Y q Q Y qQ Y qQ Y Ri Ri SSW SSW KSW KSW DW DW qQ q QP Re sQ Y qQ Y qQ Y TSW TSW SCSW SCSW IW IW qQ q QB N .
Ž .
6 2The relevant fluxes are given in Table 3 and Fig. 7. Here, it was assumed that the imbalances are due to the differences in the rates of nitrogen fixation and denitrification. Accordingly, the N budget suggests net denitrification in both seasons, totaling 114
Ž"129 = 10 mol year. 9 y1 or 0.03 "0.04 mol NŽ .
my2
yeary1
Table 3
Ž y1. Ž 9 .
Concentrations mmol kg and fluxes =10 mol for 6 months of N for the South China Sea
Wet season Dry season References
Concentration Flux Concentration Flux
Ž . Ž . Ž . Ž .
Ri 60 73 "15 60 24 "5 Meybeck 1993 , Zhang 1996
Ž . Ž .
QP – 23 – 8 Chen et al. 1994 , Han 1995 ,
Ž . Ž .
Ayers et al. 1997 , Chen and Wang 1997
Ž . Ž . Ž .
SSW 2 58 0.9 y44 Wyrtki 1961 , Chu 1972 , NOAA 1994b
Ž . Ž .
MSW 2 7 2 32 INDOPAC 1978 , NOAA 1994b ,
Ž .
San Diego-McGlone et al. 1999
Ž . Ž .
TSW 2 y16 2 y6 Fujien Oceanological Institute 1988 , Wang 1991 ,
Ž . Ž .
Hong 1994 , Hong and Dai 1994 ,
Ž .
Chen and Wang 1999 , this work
Ž . Ž . Ž .
SCSW 1.6 y358 "47 1.6 y45 "4 Chen et al. 1996a, 1997, 1998 , this work
Ž . Ž . Ž .
KSW 1.4 288 "26 1.4 106 "10 Chen et al. 1996a, 1997, 1998 , this work
Ž . Ž . Ž .
IW 23 y668 "134 23 y743 "148 Chen et al. 1996a, 1997, 1998 , this work
Ž . Ž . Ž .
DW 37 716 "143 37 716 "143 Chen et al. 1996a, 1997, 1998 , this work
Ž . Ž . Ž .
B–Re – y42 "15 – y14 "4 Lai and Liu 1994 , Su and Wang, 1994,
Wang, 1999, this work
Ž . Ž .
Net denitrification – y80 "91 – y33 "92 This work
Positive and negative numbers represent inflow and outflow, respectively.
uncertainty, is smaller than that recorded in the ECS
Ž0.1 mol N my2 yeary1.or the North Sea 0.05–1.46Ž
y2 y1. Ž .
mol N m year Chen and Wang, 1999 .
Codis-Fig. 7. N budgets in the wet and dry seasons.
Ž . y2 y1
poti 1995 gave 0.06 mol N m year as the
gross denitrification rate for the global oceans.
Mid-Ž .
delburg et al. 1996 summarized the gross global denitrification rates in shelf sediments as between
0.32 and 0.37 mol N my2
yeary1
. Seitzinger and
Ž . y2 y1 Ž .
Giblin 1996 gave 0.25 mol N m year gross
in the North Atlantic shelf sediments. More recently,
Ž .
Wollast 1998 obtained a gross global shelf average
of 0.137 mol N my2
yeary1
. If it is assumed that denitrification in the SCS occurs only on the shelf, then the net rate is 0.11 " 0.12 mol N my2 yeary1,
which is lower than the gross rates reported above. Since the nitrification rate in the SCS is not known, it is as yet not possible to estimate the gross rate. As with phosphate, a large amount of nitrate both in the SCSW and in the intermediate water is exported through the Bashi Channel.
Rivers flowing into the SCS, like the ECS, have very low phosphorus contents. The NrP ratio is 86, which is far greater than the Redfield ratio of 16. If the phytoplankton depended solely on the riverine input of nutrients for their growth, the phosphorus would be depleted quickly although there would still be an excess of nitrate. On the other hand, the influx
Ž
of seawater through the Sunda Shelf only in the wet
.
season , and the year-round upwelling and inflow through the Bashi Channel and the Mindoro Strait bring in seawater with an NrP slightly lower than
( ) C.-T.A. Chen et al.r Marine Chemistry 75 2001 281–300 296
the Redfield ratio. These incoming seawater masses contribute to productivity in the SCS the most. Along
Ž
with upwelling which occurs in the SCS Shaw et
.
al., 1996; Chao et al., 1996 , the intermediate water transports more nitrate and phosphate out of the SCS than the deep water brings in. The excess can only come from the decomposition of sinking organic particles, which is discussed later.
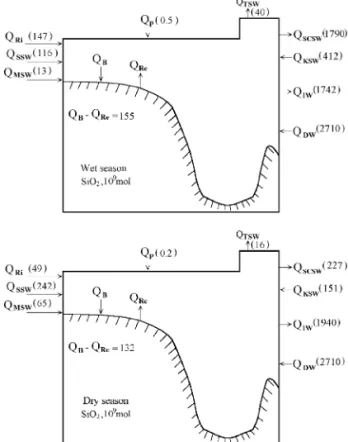
7. Silicate budgets
Ž .
The Si balance can also be represented by Eq. 5 . The relevant fluxes are given in Table 4 and Fig. 8. Unlike P and N, far less Si is transported out of the SCS by the intermediate water than is brought in through deep-water influx. This is because siliceous particles do not dissolve as readily as organic parti-cles decompose. This means a larger portion of Si reaches the sediment. The net burial of biogenic silica is taken as the residual in the box model and is
155 and 132 = 109 mol for 6 months for the wet and
dry seasons, respectively. These fluxes are large compared with P and N, but is small compared with the total sediment deposit. This is because only the biogenic siliceous particles produced from dissolved Si in the SCS was taken into account. Aeolian dust particles and suspended particles, such as sand, transported by rivers, were not included. Note the
SCSW transports about 2 = 1012 mol of Si a year
Fig. 8. Si budgets in the wet and dry seasons.
out of the SCS vs. 0.56 = 1012 mol input from
KSW. The net export is an order of magnitude more than the riverine input. Much of this excess comes from the upwelling of deep waters.
Table 4
Ž y1. Ž 9 .
Concentrations mmol kg and fluxes =10 mol for 6 month of Si for the South China Sea
Wet season Dry season References
Concentration Flux Concentration Flux
Ž . Ž . Ž . Ž . Ž .
Ri 121 147 "29 121 49 "10 Meybeck 1993 , Han 1995 , Zhang 1996
Ž . Ž .
QP y 0.5 y 0.2 Wyrtki 1961 , Chu 1972
Ž . Ž . Ž .
SSW 4 116 5 y242 Wyrtki 1961 , Chu 1972 , NOAA 1994b
Ž . Ž .
MSW 4 13 4 65 INDOPAC 1978 , Frische and Quadfasel 1990 ,
Ž . Ž .
NOAA 1994b , San Diego-McGlone et al. 1999
Ž . Ž .
TSW 5 y40 5 y16 Fujien Oceanological Institute 1988 , Wang 1991 ,
Ž . Ž .
Hong and Dai 1994 , Chen and Wang 1998, 1999
Ž . Ž . Ž . Ž .
SCSW 8 y1790 "232 8 y227 "20 Han 1995 , Chen et al. 1996a, 1997, 1998 , this work
Ž . Ž . Ž .
KSW 2 412 "37 2 151 "14 Chen et al. 1996a, 1997, 1998 , this work
Ž . Ž . Ž . Ž .
IW 60 y1742 "157 60 y1940 "175 Han 1995 , Chen et al. 1996a, 1997, 1998 , this work
Ž . Ž . Ž . Ž .
DW 140 2710 "542 140 2710 "542 Han 1995 , Chen et al. 1996a, 1997, 1998 , this work
Ž . Ž .
B–Re y y155 "47 – y132 "40 This work
8. Error analysis
The above results must be interpreted with a certain degree of caution since they are of a prelimi-nary nature. Insufficient data are available for seawa-ter fluxes and nutrient concentrations across the Sunda Shelf and the Mindoro Strait. These fluxes are
Ž .
large Wyrtki, 1961 and may even significantly
contribute to the Pacific Indian Ocean throughflow
ŽMetzger and Hurlburt, 1995 . Another great uncer-.
tainty concerns the amount of deep water inflow through the Bashi Channel. This value is the most
Ž . Ž .
sensitive term in Eqs. 1 and 2 . Errors in QDW,
estimated at "20%, result in "20% error in all fluxes related to IW. These errors propagate to "10% error in fluxes related to SCSW in the dry season and "1% error in the wet season. Another sensitive item is the riverine freshwater flux where fluctua-tions of "20% are not unusual. These would propa-gate to "9% errors in fluxes related to KSW and
SCSW. Altogether, the errors in QDW and QRi
prop-agate to, respectively, "13% and "9% in QSCSW
and QKS W in the wet season and 9% in both QSCSW
and QKS W in the dry season. These uncertainties, in absolute terms, are given in Tables 1–4. The largest relative uncertainty is in the net denitrification rate. The Sunda Shelf fluxes are also critical, but there are
Ž .
no estimates other than those of Wyrtki 1961 . Since nutrient concentrations are known to better than
"1%, errors in nutrient fluxes are mainly due to
errors in the water fluxes mentioned above. Since there are no data, however, organic nutrients were not considered in the calculations here.
9. Decomposition rates of particles
Since the SCS is semi-enclosed, the calculation of the decomposition and dissolution rates of particles based on the mass-balance method is straightfor-ward. The approach assumes that the source of the deep SCS water is at 2000 m immediately outside the Bashi Channel. The water in the SCS proper, say at 2000 m, is between 40 and 52 years older than the source water, and the increase in AOU, nitrate, phosphate and silicate are 27 " 2, 2.47 " 0.10, 0.16
" 0.02 and 8 " 2 mmol kgy1
, respectively. These increases have OrN and NrP ratios of 10.9 " 2.0
and 15 " 2, respectively, and are in good agreement
Ž
with the Redfield ratios of 8.6 and 16 Chen et al.,
. Ž y1 y1.
1996b . The rates of increase in mmol kg year
Ž . Ž .
are: 0.59 " 0.12 AOU , 0.054 " 0.016 nitrate ,
Ž . Ž
0.0035 " 0.0010 phosphate and 0.17 " 0.05
sili-.
cate .
For waters between about 800 and 3000 m where the urS plot is relatively linear, the one dimensional advection–diffusion model can be performed
follow-Ž .
ing the method of Craig and Weiss 1970 . The
resultant JrW for oxygen, nitrate, phosphate and silicate are y5.40 " 1.00, 0.81 " 0.17, 0.09 " 0.04 and 4.70 " 0.11 mmol kgy1
kmy1
, respectively, where J is the consumption or production rate, and
W is the upwelling rate. These rates represent OrN
and NrP ratios of 6.7 " 2.0 and 9 " 4, respectively, both lower than the Redfield ratios.
The upwelling rate of 0.055 km yeary1
was
Ž
obtained by dividing the distance upwelling the
.
3000-m deep water to the 800-m intermediate depth by the residence time of 40 years for deep water. The oxygen consumption rate from multiplying JrW by the upwelling rate gives 0.30 " 0.06 compared to 0.59 " 0.12 mmol kgy1
yeary1
from the mass-bal-ance method above. The nitrate, phosphate and sili-cate production rates are 0.045 " 0.010, 0.005 " 0.002 and 0.26 " 0.07 mmol kgy1 kmy1,
respec-tively. These are in fair agreement with the above estimations based on mass-balance.
These rates are compared with those for the Bering
Ž .
Sea and the Sea of Japan Table 5 . Clearly, the rates for the SCS sit in between, with the highest in the Sea of Japan and the lowest in the Bering Sea. It should be cautioned, however, that these rates have different reference states. The Bering Sea rates are relative to the source waters from the Weddell Sea, rendering the deep Bering Sea waters very old, to the
Ž .
order of 600 years Chen et al., 1996c . For waters of the same local surface production and downward flux of sinking particles, older waters have fewer fine suspended particles left for decomposition or dissolution. Further, these particles are more refrac-tory. In contrast, the Sea of Japan deep waters are very young, to the order of 120 years relative to the
Ž .
source within the Sea Chen et al., 1996c . More particles remain for decomposition and the remain-ing particles are more labile, brremain-ingremain-ing about such high rates. The SCS deep water is only 40 years
( ) C.-T.A. Chen et al.r Marine Chemistry 75 2001 281–300 298
Table 5
Ž y1 y1.
Consumption or production rates of oxygen and nutrients in the deep South China Sea Basin mmol kg year
a a
SCS Bering Sea Sea of Japan
Mass balance 1-d model Mass balance Mass balance
Oxygen consumption rate 0.59 " 0.12 0.30 " 0.06 0.2 1.13 " 0.04
NO production rate3 0.054 " 0.016 0.045 " 0.010 0.012 0.12 " 0.008 PO production rate4 0.0035 " 0.0010 0.005 " 0.002 0.0011 0.0091 " 0.0004
SiO production rate2 0.17 " 0.05 0.26 " 0.07 0.17 0.52 " 0.02
a
Ž .
Taken from Chen et al. 1996c .
older than the source water, which is several hundred
Ž .
years old based on C-14 data Broecker et al., 1986 . As a result, the rates are much lower than those of the Sea of Japan.
10. Conclusions
Recent hydrographic and nutrient data collected in the SCS indicate that salinity, AOU and nutrient extremes are less pronounced than in the West Philippine Sea. This is because of the intensive upwelling and rapid flushing of the SCS. Box model
Ž .
results indicate that in the wet season, 13.9 "1.8 Sv SCS surface water flows out of the Bashi
Chan-Ž .
nel, while 12.8 "1.1 Sv Kuroshio surface water enters it. The nutrient-rich SCSW exports 26.8
Ž"3.5 = 10 mol P, 358 "47 = 10 mol N and. 9 Ž . 9
Ž . 9
1790 "232 = 10 mol Si out of the Bashi
Chan-Ž . 9
nel, while the KSW imports 20.6 "1.9 = 10 mol
Ž . 9 Ž . 9
P, 288 "26 = 10 mol N and 412 "37 = 10
mol Si through the channel. The intermediate water
Ž .
flows out of the SCS at a rate of 1.8 "0.36 Sv,
Ž . 9
carrying with it 48.5 "9.6 = 10 mol P, 668
Ž"134 = 10 mol N and 1742 "157 = 10 mol. 9 Ž . 9
Si. Balancing the N budgets gives a net
denitrifica-Ž . 9
tion rate of 80.4 "91 = 10 mol over 6 months. In the dry season, the fluxes are significantly
Ž .
reduced. The SCSW exports 1.8 "0.2 Sv seawater,
Ž . 9 Ž . 9
3.4 "0.3 = 10 mol P, 45 "4 = 10 mol N and
Ž . 9
227 "20 = 10 mol Si out of the Bashi Channel,
Ž .
while the KSW imports 4.7 "0.4 Sv seawater, 7.6
Ž"0.7 = 10 mol P, 106 "10 = 10 mol N and. 9 Ž . 9
Ž . 9
151 "14 = 10 mol Si through the channel. The
Ž .
SCS intermediate water exports 2.0 "0.4 Sv
sea-Ž . 9 Ž . 9
water, 54 "11 = 10 mol P, 743 "148 = 10
Ž . 9
mol N and 1940 "175 = 10 mol Si out of the
SCS through the Bashi Channel. The net
denitrifica-Ž . 9
tion rate is 33 "92 = 10 mol over 6 months. The net export of nutrients in the SCSW is mainly
sup-Ž .
ported by deep water inflow. The rate is 1.2 "0.2
Ž . 9
Sv seawater, 52.5 "10.5 = 10 mol P, 716
Ž"143 = 10 mol N and 2710 "542 = 10 mol. 9 Ž . 9
Si in both the wet and dry seasons. The outflowing SCSW is relatively nutrient-rich compared with the KSW, and plays an important role in the ECS. To a certain extent, the intermediate water also upwells onto the ECS shelf, thus providing nutrients to sup-port its high productivity. As a result, the SCS acts as a pump which moves nutrients from the deep water and eventually to the euphotic zone.
Acknowledgements
The authors wish to thank the National Science
Ž
Council for supporting this research
NSC89-2611-.
M110-001 . The assistance of C.T. Liu, M.H. Huang, W. Lucas, and the captain and crew of the RrV Ocean Researcher 1 is also greatly appreciated. Two anonymous reviewers and M. Altabet gave construc-tive criticisms, which strengthened the manuscript.
References
Ayers, G., Gillett, R., Hara, H., 1997. Acid deposition in East
Ž .
Asia and Oceanic. In: Whelpdale, D.M., Kaiser, M.S. Eds. , Global Acid Deposition Assessment. World Meteorological Organization Global Atmosphere Watch No. 106, pp. 107–134. Broecker, W.S., Patzert, W.C., Toggweilar, J.R., Stuiver, M., 1986. Hydrography, chemistry and radioisotopes in the South-east Asian basins. J. Geophys. Res. 91, 14345–14354.
Chao, S.Y., Shaw, P.T., Wu, S.Y., 1996. Deep water ventilation in the South China Sea. Deep-Sea Res. 43, 445–466. Chen, C.T.A., 1981. Oxygen solubility in seawater. In: Battino, R.
ŽEd. , Solubility Data Series. Oxygen and Ozone, vol. 7,.
Pergamon, Oxford, pp. 41–55.
Chen, C.T.A., 1995. Fluxes of seawater and some dissolved chemicals in the Bashi Strait, Chin. J. Oceanol. Limnol. 13, 240–246.
Chen, C.T.A., 1996. The Kuroshio Intermediate Water is the major source of nutrients on the East China Sea continental shelf. Oceanol. Acta 19, 523–527.
Chen, C.T.A., Huang, M.H., 1995. Carbonate chemistry and the anthropogenic CO2 in the South China Sea. Acta Oceanol. Sin. 14, 47–57.
Chen, C.T.A., Huang, M.H., 1996. A mid-depth front separating the South China Sea water and the West Philippine Sea water. J. Oceanogr. 52, 17–25.
Chen, C.T.A., Wang, B.J., 1997. Acidification of lakes and reser-voirs in Taiwan. Geochem. J. 31, 345–355.
Chen, C.T.A., Wang, S.L., 1998. Influence of intermediate water in the western Okinawa Trough by the outflow from the South China Sea. J. Geophys. Res. 103, 12683–12688.
Chen, C.T.A., Wang, S.L., 1999. Carbon, alkalinity and nutrient budgets on the East China Sea continental shelf. J. Geophys. Res. 104, 20675–20686.
Chen, C.T.A., Wang, B.J., Hsu, H.C., Hung, J.J., 1994. Rain and lake waters in Taiwan: composition and acidity. Terr. Atmos.
Ž .
Oceanic Sci. 5 4 , 573–584.
Chen, C.T.A., Ruo, R., Pai, S.C., Liu, C.T., Wong, G.T.F., 1995. Exchange of water masses between the East China Sea and the Kuroshio off northeastern Taiwan. Cont. Shelf Res. 15, 19–39. Chen, C.T.A., Wang, S.L., Huang, M.H., 1996a. Preliminary data report of ocean researcher 1 cruises 403 and 418 B, Inst. Mar. Geol. Tech. Rep. No. 25, Nat. Sun Yat-sen Univ., 199 pp. Chen, C.T.A., Lin, C.M., Huang, B.T., Chang, L.F., 1996b. The
stoichiometry of carbon, hydrogen, nitrogen, sulfur and oxy-gen in the particular matter of the western North Pacific marginal seas. Mar. Chem. 54, 179–190.
Chen, C.T.A., Gong, G.C., Wang, S.L., Bychkov, A.S., 1996c. Redfield ratios and regeneration rates of particulate matter in the Sea of Japan as a model of closed system. Geophys. Res.
Ž .
Lett. 23 14 , 1785–1788.
Chen, C.T.A., Wang, S.L., Wang, B.J., Lin, Y.P., Li, F.C., Shu L.M., Chen, L.C., 1997. Preliminary data report of Ocean Researcher 1 cruises 433, 434 and 462, Inst. Mar. Geol. and Chem. Tech. Rep. No. 32, Nat. Sun Yat-sen Univ., 173 pp. Chen, C.T.A., Wang, S.L., Wang, B.J., Lin, Y.P., Liu, W.H., Li,
F.C., Chen, L.C., 1998. Preliminary data report of Ocean Researcher I cruises 508 and Ocean Researcher III 403, Inst. Mar. Geol. and Chem. Tech. Rep. No. 33, Nat. Sun Yat-Sen Univ., 137 pp.
Chu, T.Y., 1972. Oceanographic data of the South China Sea Researcher 1 cruises 1 and 2, Inst. Oceanogr. Special Publica-tion: No. 2, Nat. Taiwan Univ., 74 pp.
Codispoti, L.A., 1995. Is the ocean losing nitrate? Nature 376, 724.
Craig, H., Weiss, R.F., 1970. The GEOSECS 1969
intercalibra-tion staintercalibra-tion: introducintercalibra-tion and hydrographic features, and total CO –O relationships. J. Geophys. Res. 75, 7641–7647.2 2
Fanning, K.A., Pilson, M.E.Q., 1973. On the spectrophotometric determination of dissolved silica in natural waters. Anal. Chem. 45, 136–141.
Frische, A., Quadfasel, D., 1990. Hydrography of the Sulu Sea.
Ž .
In: Rangin, C., Silver, E., Von Breymann, M.T. Eds. , Pro-ceedings of the Ocean Drilling Program, Initial Reports, vol. 124, Texas A&M University, College Station, pp. 101–104. Fujien Oceanological Institute, 1988. A Comprehensive
Oceano-graphic Survey of the Central and Northern Part of the Taiwan
Ž .
Strait. Kexue Pub., Beijing, 423 pp. in Chinese .
Gong, G.C., Liu, K.K., Liu, C.T., Pai, S.C., 1992. The chemical hydrography of the South China Sea west of Luzon and a comparison with the West Philippine Sea. Terr. Atmos. Oceanic Sci. 3, 587–602.
Han, W.Y., 1995. Marine Chemistry of the Nansha Islands and South China Sea. China Ocean Press, Beijing, 376 pp.
Ž .
Hong, H.S. Ed. , 1994. Marine Biogeochemistry Research Pa-pers. Xiamen Univ. Press, Xiamen, China, 283 pp.
Hong, H.S., Dai, M.H., 1994. Biogeochemical studies of biologi-cally important elements in the Taiwan Strait. In: Zhou, D.
ŽEd. , Oceanology of China Seas, vol. V1, Kluwer Academic.
Publishing, Boston, pp. 201–212.
INDOPAC, 1978, Data report, Univ. Calif. Scripps Inst. Oceanogr. SID 78–21, 424 pp.
Lai, Z.L., Liu, K.K., 1994. The distribution of carbon, nitrogen and sulfur in surfacial sediments on the continental shelf and slope in northern South China Sea. Acta Oceanogr. Taiwan. 32, 30–44.
Liu, C.T., Liu, R.J., 1988. The deep current in the Bashi Channel. Acta Oceanogr. Taiwan. 20, 107–116.
Liu, Q.Y., Liu, Z.T., Zheng, S.P., Xu, Q.C., Li, W., 1996. The deformation of Kuroshio in the Luzon Strait and its dynamics.
Ž
J. Ocean Univ. Qingdao 26, 413–420 in Chinese with English
.
abstract .
Metzger, E.J., Hurlburt, H.E., 1995. Coupled dynamics of the South China Sea, the Sulu Sea and the Pacific Ocean. J.
Ž .
Geophys. Res. 101 C5 , 12331–12352.
Meybeck, M., 1993. C, N, P and S in rivers: from sources to global inputs. In: Wollast, R., Mackenzie, F.T., Chou, L.
ŽEds. , Interactions of C, N, P, and S Biogeochemical Cycles.
and Global Change. Springer, Berlin, pp. 163–193.
Middelburg, J.J., Soetaert, K., Herman, P.M.J., Heip, C.H.R., 1996. Denitrification in marine sediments: a model study. Global Biogeochem. Cycle 10, 661–673.
Milliman, J.D., Rutkowski, C.M., Meybeck, M., 1995. River
Ž .
Discharge to the Sea, A Global River Index GLORI . LOICZ Core Project Office, Netherlands, 125 pp.
Murphy, J., Riley, J.P., 1962. A modified single solution method for the determination of phosphate in natural waters. Anal. Chim. Acta 27, 31–36.
NOAA, 1994a. World Ocean Atlas 1994, V.3: Salinity, NOAA Atlas NESDIS 3, 99 pp.
NOAA, 1994b. World Ocean Atlas 1994, V.1: Nutrients, NOAA Atlas NESDIS 1, 150 pp.
( ) C.-T.A. Chen et al.r Marine Chemistry 75 2001 281–300 300
the pink azo dye in the determination of nitrite in natural waters. Anal. Chim. Acta 232, 345–349.
Pai, S.-C., Yang, C.-C., Riley, J.P., 1990b. Effects of acidity and molybdate concentration on the kinetics of the formation of the phosphoantimonylmolybdenum blue complex. Anal. Chim. Acta 229, 115–120.
Pai, S.-C., Gong, G.-C., Liu, K.-K., 1993. Determination of dissolved oxygen in seawater by direct spectrophotometry of total iodine. Mar. Chem. 41, 343–351.
San Diego-McGlone, M.L., Jacinto, G.S., Dupra, V.C., Narcise, I.S., Padayao, D.O., Velasquez, I.B., 1999. A comparison of nutrient characteristics and primary productivity in the Sulu and South China Sea. Acta Oceanogr. Taiwan. 37, 219–229. Seitzinger, S.P., Giblin, A.E., 1996. Estimating denitrification in North Atlantic continental shelf sediments. Biogeochemistry 35, 235–260.
Shaw, P.T., Chao, S.Y., Liu, K.K., Pai, S.C., Liu, C.T., 1996. Winter upwelling off Luzon in the northeastern South China Sea. J. Geophys. Res. 101, 16435–16448.
Strickland, J.D.H., Parsons, T.R., 1972. A Practical Handbook of Seawater Analysis. Fisheries Research Board of Canada, Ot-tawa, Canada, 310 pp.
Su, G.Q., Wang, T.X., 1994. Basic characteristics of modern sedimentation in South China Sea. In: Zhou, D., Liang, Y.B.,
Ž .
Zeng, C.K. Eds. , Oceanology of China Seas, vol. 2, Kluwer Academic Publishing, Boston, pp. 407–418.
Wang, J., 1986. Observation of abyssal flows in the northern South China Sea. Acta Oceanogr. Taiwan. 16, 36–45. Wang, Y.H., 1991. Marine Atlas of Boshi Sea, Yellow Sea, East
China Sea, Chemistry. China Ocean Press, Beijing, 257 pp. Wang, P.X., 1999. Response of Western Pacific marginal seas to
glacial cycles: paleoceanographic and sedimentological fea-tures. Mar. Geol. 156, 5–39.
Wang, J., Chen, C.S., 1992. On the distribution of bottom cold waters in Taiwan Strait during summertime. La mer 30, 213–221.
Wang, H.C., Yuan, Y.C., 1997. Calculation of currents in the Taiwan Strait during summertime. Acta Oceanol. Sin. 19, 10–20.
Wollast, R.J., 1998. Evaluation and comparison of the global carbon cycle in the coastal zone and in the open ocean. In:
Ž .
Brink, K.H., Robinson, A.R. Eds. , The Sea, vol. 10, Wiley, New York, pp. 213–252.
Wyrtki, K., 1961. Physical oceanography of the southeast Asian waters. Scientific results of marine investigations of the South China Sea and the Gulf of Thailand, Scripps Institution of Oceanography, La Jolla, CA, NAGA report, vol. 2, 195 pp. Zhang, J., 1996. Nutrient elements in large Chinese estuaries.
Cont. Shelf Res. 16, 1023–1045.
Zhang, Y.K., Wang, X.C., Zhang, Q.L., Wang, C.M., 1991. Bottom current in Taiwan Strait. Oceanol. Limnol. Sin. 22,
Ž .