Effect
of
Polycarbonate Molecular Weight on
Polymer Blends of Polycarbonate and
ABS
JIANN-SHINC WU,* SHU-CHEN SHEN, and FENG-CHIH CHANC
Institute of Applied Chemistry, National Chiao Tung University, Hsinchu, Taiwan, Republic of China
SYNOPSIS
The melt viscosity of polycarbonate/acrylonitrile-butadiene-styrene ( PC / ABS ) blends relative to PC is significantly lower, even lower than that of pure ABS in some compositions. Annealing above the TB of PC coalesces and coarsens phase structure in core and skin regions. Increase in the molecular weight of PC in PC /ABS blends results in low-temper- ature fracture toughness improvement but suffers from the disadvantage of higher melt viscosity. The selection of PC in PC/ABS blends must be a compromise between the toughness advantages of higher PC molecular weight and the disadvantages of higher melt viscosity. 0 1993 John Wiley & Sons, Inc.
I N T R O D U C T I O N
Polymer science and technology have undergone tremendous growth during the last two decades, particularly through chemical diversification. The concept of physically blending two or more existing polymers to create new products has attracted great interest and resulted in wide commercial utilization.
Polymer blends of polycarbonate ( PC ) with acry-
lonitrile-butadiene-styrene ( ABS ) provide a bal- ance of toughness, heat resistance, and ease of pro- cessing a t a cost lower than that of the high-perfor- mance thermoplastic PC. Since the appearance of the first PC/ABS patent nearly three decades ago,l blends or alloys of PC/ABS have been some of the most successful commercial polyblend products.
Numerous key patents have been specifi-
cally dealing with many aspects of properties, such as heat distortion temperature, impact strength, processability, or flame resistance. Fundamental studies of PC/ABS blends in terms of mechanical, rheological, morphological, and thermodynamic properties have been extensively reported in the open literature.'0-26 However, only limited work has been reported concerning, specifically, the effect of PC molecular weight in PC-ABS blends. Most lit-
* To whom correspondence should be addressed. Journal of Applied Polymer Science, Vol. 50, 1379-1389 (1993)
0 1993 John Wiley & Sons, Inc. CCC 0021-8995/93/081379-11
erature do not give reasons why the particular PC or ABS was selected in their studies. Molecular weight of the blend component is a n important vari- able, especially as a major component, that can sig- nificantly influence essentially all the above-men- tioned properties of the resultant PC /ABS blends. The main objective of this study is to obtain a better understanding of the effect of changing the PC mo-
lecular weight and to provide better guidance for
proper selection of the starting materials in the PC/ ABS blends.
EXPERIMENTAL
Materials
Natural grades of PCs, Calibre*, from Dow Chemical
Co. with melt flow rates (MFR) of 3, 6, 10, 15, 20,
and 60 were used in this study (Table I). PC with
MFR = 15 (PC15) was considered as the general
purpose grade and was selected as the blend com- ponent in this PC/ABS polyblend studies when the PC molecular weight was not treated as a variable. ABS with 18% rubber content was obtained from Grand Pacific Petrochemical Corp. of Taiwan.
Melt Blending and Specimens Preparation
Melt blending was prepared by a corotating 30 mm-
diameter twin-screw extruder with a n L / D ratio of
29. The standard ASTM
4
in. specimens were pre-Table I Melt Flow Rate and Molecular Weight of PCs MFR MIU Mn 3 6 10 15 20 60 35,900 31,500 28,200 25,100 24,100 18,100 13,300 11,600 10,600 9,700 9,600 8,300
Data extracted from Refs. 29 and 30.
pared using a n Arburg 3 oz injection-molding ma-
chine. The temperatures of extrusion and injection molding were adjusted to give the optimized pro- cessing conditions according to the blending com- positions and the materials selected. Component
weight ratio, PC/ABS = 65/35, was close to most
commercially available products and was chosen to study the effect of PC MFR in this study.
Characterizations
The melt rheological properties were examined by a capillary rheometer, Model Rheograph 2001, Gottfert, Germany. Procedures for the mechanical properties-tensile, flexural, and standard notched Izod impact a t various temperatures-and the crit-
ical strain energy release rate ( G c ) were described
in our previous report^.^^-^' The injection-molded
specimens were annealed as a function of time at 175OC under atmosphere conditions. Phase mor- phologies of the blends have been characterized by
both transmission (TEM ) and scanning electron
microscopy (SEM). The fracture surfaces of the specimens were examined by SEM after etching with
30% KOH aqueous solution up to a maximum of 30
min, rinsing with water, and coating with gold. The TEM thin-layer specimens were cut by a microtome and stained with 2% OsOI solution for 6 h. The dif-
ferential scanning calorimetry (DSC ) measurements
were carried out using a Seiko differential scanning
calorimeter, Model SSC-5000. TB was taken as the
temperature at which the heat capacity reached one- half of the entire step change as observed on the thermogram.
RESULTS AND
DISCUSSION
h 0) v1 0 1000 a h 4 v1 0 0 v1 W .r(
3
4 \ PC15 PC15/ABS=80/20 PC15/ABS=65/35 pC15/ABS=50/50 PC15/ABS=35/65 PC15/ABS=20/80 100 I I 10shi& rate (1/$oy
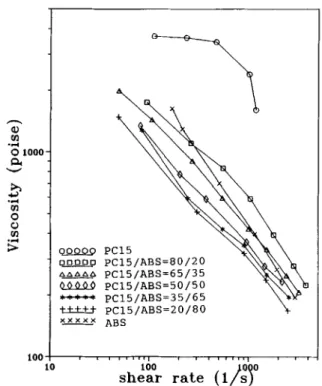
Figure 1
blends at 250°C.
Melt viscosity vs. shear rate of PC15/ABS
ing conditions such as melt extrusion or injection molding. Figures 1 and 2 show the apparent melt viscosity vs. shear rate of PC15/ABS blends a t 25OOC. The presence of ABS, even at as low as 20%, is able to reduce the melt viscosity of PC signifi- cantly. The presence of 35% or higher ABS in the blends results in viscosity close to or even lower than ABS. A similar phenomenon was also reported pre- viously.21 The viscosity of polymeric materials changes greatly with temperature and the plots of
1 / T vs. viscosity a t constant shear rate ( 100 and
A
08880 shear rate 100 0-1
* shear rate 500 6-1 t ~ + +
-
shear rate 800 8-1shear rate I100 6-1
0 2soo a
Melt Rheological Properties
The rheological properties of polyblend provide im-
EFFECT OF PC MW ON PC/ABS BLENDS 1381 h Q m 0 a .r( Y
24-
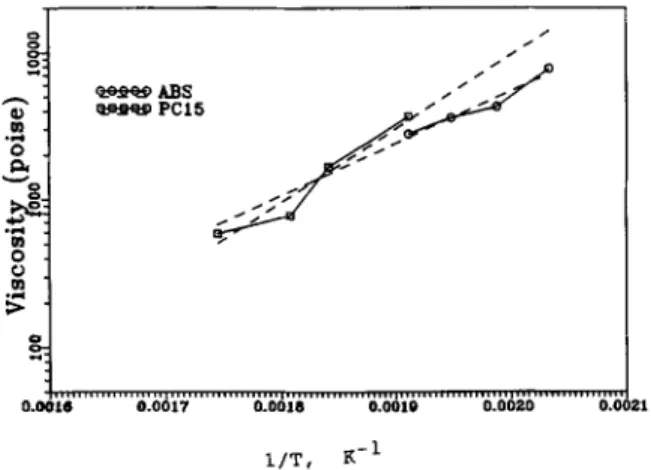
.r( d m -0 . 0 m -.d1000 s-') for PC15 and ABS are shown in Figures
3 and 4. The viscosities of PC15 and ABS are fairly
close, 3700 vs. 2800 poise, a t 250°C and low shear
rate (100 s-l, Fig. 3). At a higher shear rate of 1000
s-l, the ABS viscosity is significantly lower than that of PC15,470 vs. 2400 poise, as shown in Figure 4. That means that the viscosity of ABS in the typ-
ical PC
/
ABS blend processing temperatures is muchmore shear-sensitive than is that for PC. Figure 5 shows the effect of PC molecular weight on melt
viscosity for the blends of PC15/ABS = 65/35
composition. PC with greater viscosity, due to higher PC molecular weight, also results in higher viscosity of the PC15/ABS blends, as would be expected.
SEM and TEM Morphologies of the Blends
As mixtures of two polymers are deformed during flow, complex morphologies can develop. Pieces of one polymer may be drawn into filaments that may remain as filaments or break up into small drops or connect to each other to give an interconnected net- work. Under some conditions, ribbons or sheets of one polymer can be formed inside of the other poly-
mer. Thus, rheologically related morphologies of
polymer blends are very complex. By careful control of the etching condition, the features of phase do- mains can be obtained.
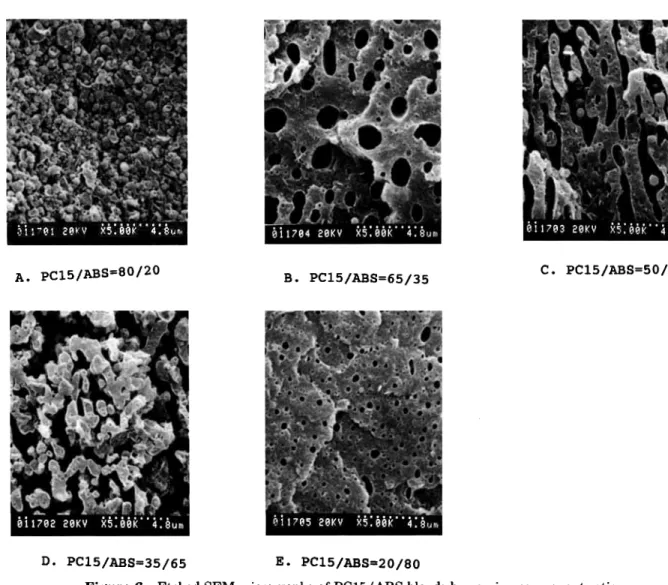
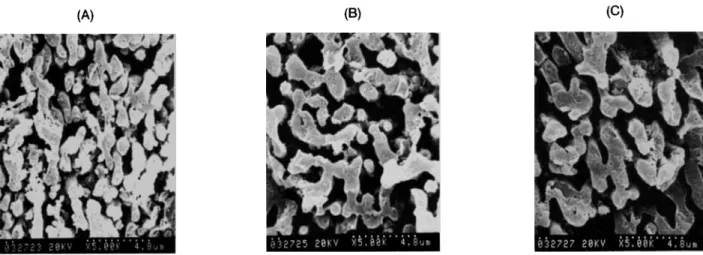
Figure 6 shows the SEM morphologies of the
cryogenic fractured surfaces perpendicular to flow direction of the PC15/ABS blends with various
component ratios. Figure 6 ( A ) shows the SEM
morphology of the blend containing 80% PC15.
Since PC15 is the major and continuous phase in the blend, the fine particles shown in Figure 6 ( A ) probably come from the ABS particles that have
P
ABS PC15
0 . o x 1
Figure 3
A B S at lower shear rate of 100 s-'.
Plots of melt viscosity vs. 1/T for PC15 and
1/T, K - l
Figure 4
ABS at higher shear rate of 1000 s-l.
Plots of melt viscosity vs. 1 / T for PC15 and
been etched out and recoated on the surface and this is certainly not the original morphology of the blend. The blends with 65 and 50% PC15 exhibit co-continuous morphologies as shown in Figure
6 ( B ) and ( C )
.
Because of the higher viscosity ofPC15 than that of ABS as mentioned earlier, the blend with 35% PC15 results in PC15 as a spherical
and dispersed phase, as shown in Figure 6 ( D )
.
Fig-ure 6 ( E ) shows the morphology of the blend with
20% PC15 where the volume fraction of these
h Q, m .rl 0 a R ml000 0 0 m v
5
F
Qeeea PC3/ABS=65/35 w a e a PC6/ABS=65/35 ~&-&&6 PClO/ABS=65/35 Q++# PC15/ABS=65/35 m*+ PC20/ABS=65/35 U-H+ PC60/ABS=65/35 Figure 5 = 65/35 blends by varying PC MFR.A. pC15/ABS=80/20 B. PC15/ABS=65/35
c.
PC15/ABS=50/50D * pc15/ABS=35/65 E. pC15/ABSp20/80
Figure 6 Etched SEM micrographs of PC15/ABS blends by varying component ratio:
( A ) PC15/ABS = 80/20; ( B ) PC15/ABS = 65/35; (C) PC15/ABS = 50/50; ( D ) PC15/ ABS = 35/65; (E) PC15/ABS = 20/80.
spherical PC particle holes is estimated as less than
10%. This is a n indication that a significant amount
PC15 is dissolved in the ABS phase.
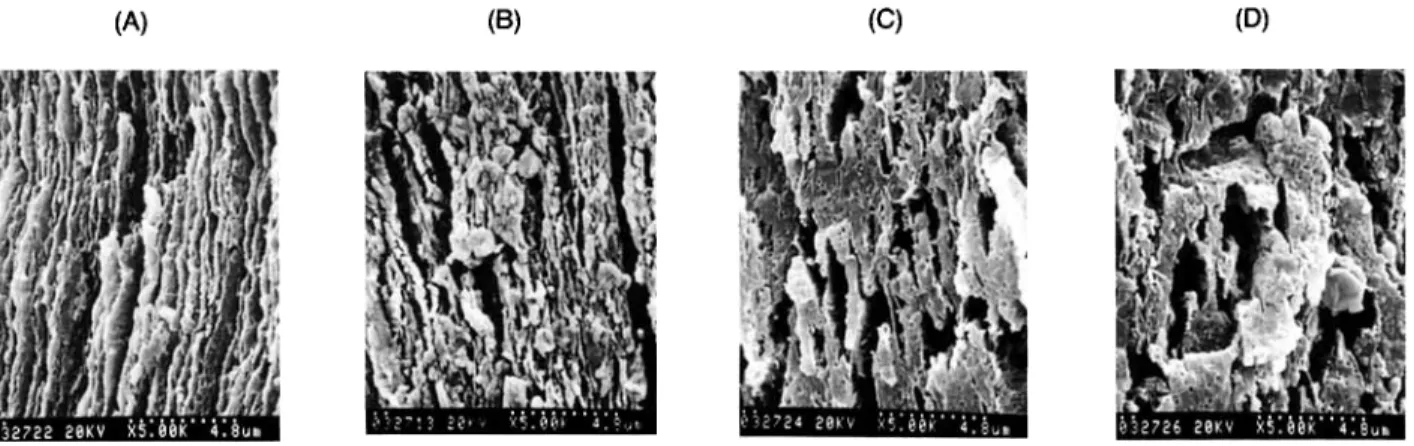
Figure 7 shows a few selected SEM morphologies
of PC/ABS = 65/35 blends, by varying the MFR
of PC, that were fractured in liquid nitrogen and under ambient conditions. The morphologies of the cryogenic fracture surfaces do not show significant
differences [Fig. 7 ( A ) , ( C )
,
and 7 ( E ) ] among theseblends. However, the more ductile blend (lower PC MFR) shows a much finer texture of the ambient
fracture surface [ compare Fig. 7 ( B )
,
( D ) and ( F ) ].
Greater surface shear yielding of the more ductile blend reflects in the resultant finer texture of the etched surface morphology. Besides the above-men- tioned complex factors dictating the phase mor-
phology, the presence of rubber in this triple-phase blend was reported previously to promote compat- ibility between PC and SAN.22 Figure 8 shows the
TEM micrograph of the PC15/ABS = 50/50 blend
where the rubber particles distributed in the SAN phase are irregular. This ABS is the blended product from a higher rubber content ABS and SAN, and
this high-rubber ABS is the product directly from
the polymerization reactor.
Effect of Annealing
Figure 9 shows the skin layer SEM micrographs of
the PC15/ABS = 65/35 blend after annealing for
different times. The skin layer possesses an oriented sheetlike, multilayer composite structure before an- nealing because of high shear during injection mold-
EFFECT OF PC MW ON PC/ABS BLENDS 1383
A. PC3, c r y o g e n i c C. PC10, c r y o g e n i c
E. pC20, c r y o g e n i c
B. P C ~ , ambient D. PC10, ambient I?. PC20, ambient
Figure 7 Etched SEM micrographs of the cryogenic and ambient fracture surfaces of PC/ABS = 65/35 blends by varying PC M F R ( A ) PC3, cryogenic; ( B ) PC3, ambient;
( C ) PC10, cryogenic; ( D ) PC10, ambient; ( E ) PC20, cryogenic; ( F ) PC20, ambient.
ing [Fig. 9 ( A ) ]
.
After annealing, the multilayer-like skin structure appears to have restructured and
creates large holes, as shown in Figure 9 ( B ) - ( D )
.
Figure 10 shows the annealing effect on the core region taken from the fracture surfaces perpendic- ular to the direction of injection molding. Upon an- nealing, the phases coarsen and transform into a nearly dispersed type structure. Since the annealing temperature is significantly lower than the typical
injection-molding temperature ( 175OC vs. 250°C)
,
we would expect a much higher rate of phase coar- sening a t the melt-processing condition. Phase morphology coarsening of the PC/SAN system was previously reported.24 When annealing above the Tg of PC under zero-shear condition, interfacial tension provides the driving force to coarsen the phases in this partially miscible PC/ABS blending system.
The mechanisms contributing to the reduction in interfacial contact for this co-continuous system are considered to include coalescence, retraction, and thread breakup processes, in contrast to an occluded system that would require only coalescence of dis- crete particles.24
Tg of the Blends by DSC
Table I1 shows the Tg of the PC15/ABS with various
compositions. The partial miscibility between PC
and SAN has been well recognized. The Tg of the
PC-rich phase decreases with the increase of ABS
content, whereas the TB of the SAN-rich phase in-
creases with increase of PC content, as would be
expected. The difference between ATg(PC) in the PC-rich phase and AT,( ABS) in the ABS-rich phase is insignificant. The observed ATg(PC) and
Figure 8
blend.
TEM micrograph of PC15/ABS = 65/35
ATg(ABS) in the PC15/ABS = 50/50 blend are
11.4 and 9.5OC, respectively. Therefore, we expect the weight fraction of ABS dissolved in the PC-rich phase and the weight fraction of PC component dis- solved in the ABS-rich phase to be comparable. Keitz et a1.16 also reported comparable AT'( PC) and
ATg(SAN), 7.OoC vs. 6.6"C, in the PC/SAN = 50/
50 blend with 26.7% AN content in SAN. Kim and Burns22 reported greater AT,(PC) ( 8 2 ° C ) in the PC-rich phase than ATg (ABS) (2.6OC) in the ABS-
rich phase from the blend of PC/ABS = 50/50 and
concluded that more of the ABS dissolved in the
PC-rich phase than did the PC dissolve in the ABS-
rich phase. Besides, the overall T, shifts observed
from our study are greater than those reported by Kim and Burns.22
The miscibility between PC and ABS depends on
the acrylonitrile (AN) content in the SAN phase l6
and the 38.3% AN content in SAN employed by Kim and Burns appears to be higher than the op- timized range for best miscibility for the PC/SAN blending system. Paul et al.15 reported that 27% AN in SAN has the maximum adhesion between PC and SAN in their lap-shear tests. There is somewhat of a controversy on how much AN content provides the best compatibility between PC and SAN. How- ever, AN content of 38.3% is believed to be higher than the optimized value for best compatibility. The AN content in SAN in the ABS that we employed is approximately 28%. The difference in AN content in SAN can explain the observed miscibility differ- ence between our results and results from Kim and Burns.22
Table I11 shows the Tg of PC/ABS blends by
varying PC MFR. The Tg shift of either the PC-rich
or SAN-rich phase depends on mutual solubility. Higher PC molecular weight in the blend shows higher T, and greater AT, (PC) in the PC-rich phase, probably due to better mixing, and, therefore, more of the SAN dissolved in the PC phase. The AT,( ABS) in the ABS-rich phase is at a maximum
with PC15, as shown in Table 111.
Tensile and Flexural Properties
The general trends obtained (data not shown) from the tensile and flexural properties of PC/ABS blends with different component ratios are very
Figure 9 Etched SEM skin morphologies of PC15/ABS = 65/35 blend annealed at
different times at 175OC: ( A ) before annealing; ( B ) annealed 5 min; (C) annealed 10 min;
EFFECT OF PC MW ON PC/ABS BLENDS 1385
(B) (C)
Figure 10 Etched SEM core morphologies of PC15/ABS = 65/35 blend annealed at different times at 175°C: ( A ) annealed 5 min; ( B ) annealed 10 min; ( C ) annealed 15 min.
similar to most literature previously r e p ~ r t e d . ' ~ * ' ~ , ~ ~ ~ ~ ' Modulus and yield strength are essentially additive,
but tensile elongation a t break has a pronounced minimum when plotted against blend composition.
Table IV shows the results of the blends with varying
PC molecular weight. Modulus and yield strength are essentially identical within experimental error, whereas the blend with PC3 shows an exceptionally high tensile elongation relative to other blends.
Izod Impact Properties
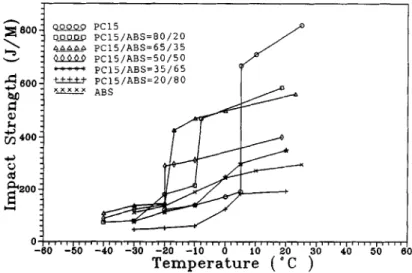
Figure 11 illustrates the Izod impact strength of the
PC15
/
ABS blends a t different temperatures. Theductile-brittle transition temperature (DBTT) de-
creases with the increase of ABS content up to 50%
of ABS. This is a typical result similar to any rubber- toughening thermoplastic system. Relative to PC, the impact strength of a PC/ABS blend is lower when the fracture is in the ductile mode but is higher
Table I1
Component Ratios
T8 of PClB/ABS Blends with Various
PC-rich Phase ABS-rich Phase
PC/ABS T8 (PC) T, (ABS) 100/0 146.7 - 80/20 140.4 - 65/35 138.6 111.2 50/50 135.3 110.6 35/65 131.7 109.7 20/80 130.3 107.7 0/100 - 101.1
in the brittle mode, similar to the rubber-toughening
PCs that we reported p r e v i o ~ s l y . ~ ~ When the PC
content is less than 50%, the ductile-brittle tran-
sition phenomenon is not very clearly defined and
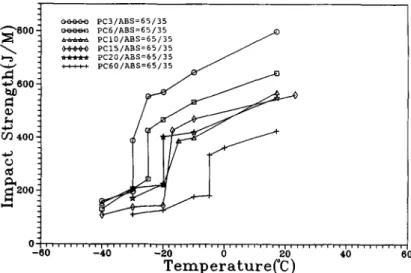
the toughening efficiency is poor. Figure 12 shows
similar plots for the PC/ABS blends by varying PC MFR. Higher PC molecular weight results in lower DBTT and greater fracture strength in both ductile and brittle modes. This result is not unexpected if we compare them with virgin PC with different mo- lecular weights, as shown in Figure 13.
Critical Strain Energy Release Rate, Gc
A fracture mechanics approach to impact testing was developed independently by Brown31 and Mar- shall et al.32 by assuming the specimen to exhibit bulk linear elastic behavior. This method allows for small-scale yielding at the notch tip providing that it still possesses bulk linear elastic behavior. Some- times, a small correction may be made to the crack
length ( a
+
rp, where rp is the plastic zone radius)to improve the accuracy of the calculation. There- fore, the experiments were purposely carried out a t low temperature (-40°C) and with a sharper notch
(0.125 mm notch radius ) to meet the criteria of this
method as closely as possible. The elastic energy,
Uc, absorbed as strain energy by the specimen at
fracture, can be expressed in terms of the compli-
ance, C:
Table I11 T, (PC), T, (ABS), AT, (PC), and AT, (ABS) of PC and PC/ABS = 65/35 Blends
AT, (PC) AT, (ABS)
Composition T g , PC TB, ABS in PC in SAN
-
-
-
PC3 153.2 PC3/ABS 141.3 107.7 11.9 6.6 PC6 149.4-
--
PC6/ABS 139.0 108.6 10.4 7.5 PClO 149.0 PClO/ABS 138.9 110.3 10.1 9.2 PC15 146.7-
--
PC15/ABS 138.6 111.2 8.1 10.1 PC20 148.5 PC2O/ABS 139.7 109.9 8.8 8.8 PC60 143.5 PCGO/ABS 135.8 108.6 7.7 7.5 ABS2 - 101.1-
-
-
-
- --
- -Table IV Tensile and Flexural Properties of PC/ABS = 66/35 Blends with Varying PC Melt Flowrate
PC
MFR
~~ ~
PC3 PC6 PClO PC15 PC20 PC60
Tensile
Modulus (MPa) 1880 1880 1840 1850 1870 1880
Yield stress (MPa) 62.6 60.3 59.2 63.6 61.8 62.0
Elongation (%) 88 33 31 35 35 26
Flexural
Modulus (MPa) 2050 2190 2020 2020 2170 2120
Yield stress (M.Pa) 88 91 89 84 91 89
( 2 )
P 2
dC'
2B dawhere B is the specimen thickness and a is the crack
tion. The critical strain energy release rate or frac-
ture energy, G,, derived from linear elastic fracture
mechanics, can be expressed by the following equa- tion:
G
= L X - QQQ2.g PC15 n o o o o PClS/ABS=80/20 U PC15/ABS=50/50-
PC15/ABS=35/65 W pC15/ABS=20/80 A U A PC15/ABS=65/35 %xXxx ABS o q , , , , I , . , I , , , I , , , I,,, I,,, I , , , , I , , , , , , I , , , , < , I40
-bo -ko-50
40
-io
b 1'0 do 3'040
510
t Temperature ( " C)
Figure 11
ponent ratios.
EFFECT OF PC MW ON PC/ABS BLENDS 1387
-
"600:E
:
2 :
z :
w-3
600: h D - & -c , : m 400- 4 -0 : L d : $200:
u -08860 PC3/ABSe65/35 eeeea PCb/ABS=65/35 bbbw PClO/ABS=65/35 W4+0 PC15/ABS=65/35 dw* pCZO/ABS=65/35 cccce PCbO/ABS=65/35 0 ( I ! I I I I I , , ( , , , , , , I , , I , , , , r , , , , l , , l , , , r , , ( , , , , , , , , , , , , , , , , , , , -60 -40 -20 0 20 40 Temp erat
ur
e('C
) Figure 12 PC MFR.Izod impact strength vs. temperature of PC/ABS = 65/35 blends by varying
length. By substituting eq. ( 1) into eq. ( 2 ) and rear-
ranging, the following equation can be obtained ( 4 )
U, = G, X B X
D
X d) ( 5 )Figures 14 and 15 show the plots of B X
D
X d) vs.impact energies of various PC/ABS blends. The
corresponding Gc was calculated from the slope of
the graph and the results are summarized in Table V. The blends with co-continuous phase structure,
C
U, = G, X B X
-
d C / d a ( 3 )
Equation (3) can be expressed in the following
equation by introducing the specimen width, D
,
andthe dimensionless geometric factor, 4:
1000 PC 3 Notch radius: 10 m i l \ 0 PC 20 PC 60
-
700- 600- L 500- U 400- ?J r c3, c a, U VJ U ius
300- H 200- 100- 0 Temperature 7.c )1.00 .( I ;;0.80
-
h5
0.60 Q w 4J 0 0.40 B 0.20 0.00 0.0 1.0 2.0 3.0 4.0 5.0 6.0 7.0 8.0 B x D x $ (lo5 x ~ 2 )Figure 14 Plots of impact energy vs. B X D X d for
PC15/ABS blends with different component ratios a t -40°C.
65 and 50% in PC15, show higher Gc values and this
range of the component ratio is of commercial in-
terest. For the blend with varying PC molecular
weight and a t a fixed component ratio, PC/ABS
= 6 5 / 3 5 , the resulting Gc increases with the increase of PC molecular weight. The blend with the lowest
molecular weight PC60 has the lowest Gc value.
Fracture toughness of PC is highly sensitive to its molecular weight, relative to other polymers, even above its critical entanglement molecular weight as
reported p r e v i o u ~ l y . ~ ~ These observed results are not
unexpected since the PC is the major component in
the PC/ABS = 6 5 / 3 5 blends.
CONCLUSIONS
1. Melt viscosities of PC/ABS blends relative
to pure PC are significantly lower, even lower
1.20 1 .oo c 2. 0.80 h I 4 w 4J 0.60
b
0.40 0.20 0.00 1.0 2.0 3.0 4.0 5.0 6.0 7.0 I B x D x+
(lo5 x R - ~ ) Table VVarious PC/ABS Blends
Fracture Energies, Gc, of Composition Gc (kJ/mz) PC15 PC15/ABS = 80/20 PC15/ABS = 65/35 PC15/ABS = 50/50 PC15/ABS = 35/65 PC15/ABS = 20/80 ABS PC3/ABS = 65/35 PC6/ABS = 65/35 PClO/ABS = 65/35 PCPO/ABS = 65/35 PCGO/ABS = 65/35 3.68 4.59 8.91 7.15 6.78 5.09 6.53 13.30 9.86 8.75 8.03 5.32
than those of pure ABS in several composi- tions.
2. The observed
AT,(
P C ) in tbsPC-rich phaseand AT,(ABS) in the ABS-rich phase are
comparable, an indication of close mutual
solubility of the two phases.
3. Annealing above Tg of PC coarsens the phase
structure of the blend.
4. Higher PC molecular weight has the tendency
to raise the viscosity of the PC/ABS blend.
5. Higher PC molecular weight increases the
ductility of the blends in terms of lower
DBTT and higher impact strength.
6 . The critical strain energy release rate, Gc, of the blend has a similar trend as that of the observed impact strength.
7. The component ratio of PC/ABS = 6 5 / 3 5
can be considered as a compromise compo- sition in terms of the product toughness, cost, and the processing melt viscosity.
8. The toughness advantages by increasing PC
molecular weight must be compensated by the
viscosity increase and this fact has to be taken into consideration in selecting the starting materials.
1. T. S. Grabowski, US. Pat. 3,130,177 (1964) (to Borg-
2. S. Furukawa et al., Jpn. Kokai 73,43,750 (1973) (to Warner Corp.).
Daicell Co. Ltd.)
.
Figure 15 Plots of impact energy vs. B X D X 4 for PC/ABS = 65/35 blends by varying PC MFR a t -4OOC.
3. R. Hasegawa et al., Jpn. Kokai 74,04,745 (1974) (to Teijin Ltd.)
.
EFFECT OF PC MW ON PC/ABS BLENDS 1389
4. E. Yonemitsu et al., Jpn. Kokai 75,85,651 (1975) ( t o
5. T. Kotani et al., Jpn. Kokai 76,128,356 (1976) (to
6. D. E. Henton, US. Pat. 4,218,544 (1980) ( t o Dow
7. D. Margotte et al., Ger. Offen. 3,002,662 (1981) ( t o
8. P. Y. Liu, US. Pat. 4,390,657 (1983) ( t o General
9. U. R. Grigo et al., U S . Pat. 4,472,554 (1984) (to Mo-
10. K. C. Rusch and R. H. Beck, J. Polym. Sci. Part C, 11. D. Stefan and H. L. Williams, J. Appl. Polym. Sci.,
12. V. Dobrescu and V. Cobxaru, J. Polym. Sci. Polym.
13. S. L. Cohen and N. R. Lazear, Plast. Eng., Aug., 23 14. T. Kusauchi and T. Ohta, J. Mater. Sci., 19, 1699 15. H. Suarez, J. W. Barlow, and D. R. Paul, J. Appl.
16. D. Keitz, J. W. Barlow, and D. R. Paul, J. Appl. Polym.
17. K. Koo, T. Inoue, and K. Miyasaka, Polym. Eng. Sci.,
18. G. Weber and J. Schocps, Angew. Makromol. Chem., Mitsubishi Gas Chemical Co.)
.
Japan Synthetic Rubber Co.). Chemical Co.)
.
Bayer A.G.)
.
Electric).bay Chemical Co.).
3 0 , 4 4 7 (1970). 18,1451 (1974). Symp., 6 4 , 2 7 (1978). (1982). ( 1984). Polym. Sci., 29,3253 ( 1984). Sci., 29,3131 (1984). 25, 741 (1985). 1 3 6 , 4 5 (1985).
19. R. E. Skochdopolc, C. R. Finch, and J. Marshall, Po-
lym. Eng. Sci., 2 7 , 6 2 7 (1987).
20. W. Y. ChiangandD. S. Hwung, Polym. Eng. Sci., 27,
632 ( 1987).
21. W. K. Chin and J . L. Hwang, in Advances in Polymer
Blends and Alloys Technology, M. A. Kohudic, Ed., Technomic, Lancaster, 1988, Vol. 1, p. 154.
22. W. N. Kim and C. M. Burns, Polym. Eng. Sci., 28,
1115 (1988).
23. K. W. Mclaughlin, Polym. Eng. Sci., 29,1560 (1989). 24. D. Quintens, G. Groeninckx, M. Guest, and L. Aerts,
25. J. J. Herpels and L. Mascia, Eur. Polym. J., 26,997 26. M. Ishikawa and I. Chiba, Polymer, 3 1,1232 ( 1990). 27. F. C. Chang and M. Y. Yang, Polym. Eng. Sci., 30,
28. F. C. Chang and Y. C. Hwu, Polym. Eng. Sci., 31, 29. F. C. Chang, J. S. Wu, andL. H. Chu, J. Appl. Polym.
30. F. C. Chang and H. C. Hsu, J. Appl. Polym. Sci., 43,
31. H. R. Brown, J. Mater. Sci., 8 , 9 4 1 (1973).
32. G. P. Marshall, J. G. Williams, and E. E. Turner, J.
Polym. Eng. Sci., 30,1474,1484 (1990).
( 1990). 543 ( 1990). 1509 (1991). Sci., 4 4 , 4 9 1 (1992). 1025 ( 1991 )