Production, Manufacturing and Logistics
Dynamic programming for delayed product differentiation
Hsi-Mei Hsu
*, Wen-Pai Wang
Department of Industrial Engineering and Management, National Chaio Tung University, 1001 Ta Hsueh Rd., Hsinchu 30050, Taiwan Received 1 September 1999; accepted 24 August 2000
Abstract
Product proliferation and demand uncertainty result in material requirement planning difficulties, which give rise to high inventories and low customer service. A design concept, delayed product differentiation, is advocated for reducing the impact due to inaccurate forecasts and shortening the order response time. In this paper, a dynamic programming model using an AND/OR graph is constructed to determine the product differentiation points. Taking into account the costs and benefits associated with delayed product differentiation points, we proposed an approach to suggest whether the designer ought to differentiate specific products from the common part set at each design stage. Finally, we illustrate an example to characterize the optimal product differentiation points.
Ó 2003 Elsevier B.V. All rights reserved.
Keywords: Dynamic programming; Differentiation point; Demand uncertainty; Product proliferation
1. Introduction
The expanding high customer service provision, rapidly changing technologies, and globalization all give rise to major challenges for manufacturers of high-technology products to compete in the world market [3,4,10,12]. Such an environment increases product proliferation and demand un-certainty, which engender forecasting quite diffi-cult. Inaccurate forecasts leads to high inventory investment and poor customer service. Most en-terprises strive for strategies that can respond
quickly to the diverse product needs and overcome the related operational challenges. Redesigning processes or products so as to defer the point of product differentiation positively address these formidable tasks. Deferring product differentiation points is thus a practicable design concept to de-crease the negative influences of product prolifer-ation and demand uncertainty [6,7,10].
Normally, a manufacturing process involves multiple stages, each requiring different parts or subassemblies. Increasing the level of part com-monality at an early stage of manufacturing pro-cess may delay the differentiation of products. Commonality here is defined as the use of a com-ponent by several different products. When used properly, part commonality may decrease the in-ventory cost, manufacturing cost, and so on. In this paper, a part-base implementation approach *Corresponding author. Tel.: 5731761; fax:
+886-3-5722392.
E-mail address:hsimei@cc.nctu.edu.tw(H.-M. Hsu).
0377-2217/$ - see front matter Ó 2003 Elsevier B.V. All rights reserved. doi:10.1016/S0377-2217(03)00018-3
of the product differentiation deferment is devel-oped for reacting to uncertainty, reducing inven-tory levels, and strengthening the flexibility for quick response to demand changes.
The principal design considerations for increas-ing part commonality level as much as possible are associated with traditional concerns which take into account manufacturability and performance, part relationship and sequence, geometric shape and features, and so on [7,9]. The deferral differ-entiation point concept reveals to redesign a pro-duction process so that the point of differentiation into multiple products in the process is delayed as much as possible. In addition, enhancing the level of part commonality exist a major problem, which the product differentiation points should be deter-mined under considerations of the costs and ben-efits in the design phase. Deferment with product design changes may require extra investment. For example, a keyboard manufacturer in Taiwan in-vests a lot of capital in module design for sup-plying variable demands of the final labeling of characters and symbols. Thus, a comprehensive analysis of the right product and process design for deferment should be carried out by taking into account all of the relevant cost and benefit factors involved in the design process. The corresponding arguments include the capital investment, the in-ventory holding costs and the processing costs. On the other hand, such a deferment design provides several benefits. Significant advantages involve increased flexibility in the process to cope with market uncertainties and lower inventory for the same target service level. Namely, the benefits in the form of inventory reduction or service im-provement are actually quite similar in many as-pects to the risk-pooling effect of multi-echelon inventory systems [5,14].
Although the issue of product differentiation deferment has provoked a great deal of discussion, little attention has been focused on the corre-sponding approaches. Lee and Tang [11] described a model that illustrates the costs and benefits as-sociated with delaying product differentiation. This model was however intended for strategic planning rather than tactical planning. As men-tioned above, proceeding with the cost and benefit analysis of deferment alternatives at each design
stage is crucial. Dynamic programming approach is a useful mathematical technique for making a sequence of interrelated decisions, which substan-tially reflect the specific features of product design problems. Such an approach has been successfully applied to many fields of production research [1,8,13,15].
Consequently, the main objective of this study was to construct a dynamic programming model to capturing the cost analysis of deferment design. The approach is accompanied with an AND/OR graph for representing the correspondent rela-tionship of decision against state, which may pre-sent an aggregation of multiple states. In the next section, we briefly describe the design concepts for deferring product differentiation. A product dif-ferentiation dynamic programming model (PDDP) is constructed and discussed in Section 3. In Sec-tion 4, an example is used to illustrate the suit-ability of the proposed model. Finally, we present some concluding remarks.
2. Concepts for deferring the product differentiation points
The major issues in the production system were efficiency in the 80s and quality in the 90s. Quick response associated with lead-time shortening advances the principal topic for the current pro-duction research. However, todayÕs market envi-ronment is characterized by diverse customer tastes and preferences, rapid technology develop-ment and globalization managedevelop-ment. These fac-tors result in the need for variety of products, which presents major challenges to production managers. In order to overcome the curse of prod-uct proliferation, an increasing trend towards re-designing the product and process so that the negative impacts of product variety can be ame-liorated has been emphasized.
Design for deferring product differentiation is a strategy whereby the final configuration of a product is postponed as much as possible, usually until a customer order is received. There are two types of postponement, which are time phase and form phase, respectively [9]. For most high-tech-nology and complex products, time postponement
strategy is commonly adopted that some of the differentiation tasks traditionally implemented at the central plant have moved to regional distri-bution centers for reacting to localization needs. Since it involves the entire global supply chain structure, there exist many influential factors that significantly enhance the analysis complexity. Aware of the distinct characteristics, volatile and difficult-to-predict demand, of high-technology products, a corresponding strategy of build-to-order (BTO) initiated by Dell and Gateway has continuously been adapted to capture the demand variability in the personal computer industry. A successful BTO achievement is Fujitsu that estab-lished a configuration center to proceed the final assembly in Tennessee.
Form postponement aims at standardizing the upstream stages as much as possible. Often, this is also accompanied by redesigning the product with increased modular structure and part commonal-ity, which presents the risk-pooling effect and extra capital investment. In general, multiple end-prod-ucts may share some common processes and/or parts in the initial stages of the production process. At some point in the process, specialized processes or components are then used to customize the work-in-process (WIP), which was a generic product up to that point in the process, into the different end-products. Such a point is usually known as the point of product differentiation. Form postponement refers to redesigning the pro-cess to delay the point of product differentiation. In this way, Compaq simplifies the product struc-ture, and then the complexity of product mix is reduced to enhance the effect of BTO implemen-tation. In addition, a 98/3 strategy, which indicates 98% of customer service level and 3 days of order fulfillment, is accomplished. In this paper, we concentrate our attention on form postponement to explore the differentiation point decisions in the manufacturing process.
A correct redesign analysis of product and process for deferring the product differentiation points should be achieved under prudent con-cerns of all the relevant cost factors impacted by deferment. As a general rule, risk-pooling effects involved in deferment strategy has significant im-pacts on inventory investment, which is a central
driver of deferment evaluation. In other words, product differentiation deferment should lead to lower inventory investment for the same service target level. The magnitude of inventory reduction generally depends on the timing of product dif-ferentiation points, the variability and interde-pendency of the different product demands, and the specific service targets. A formal model devel-oped by Lee [11] illustrated that the inventory can be reduced when the product differentiation point is deferred. Especially, the amount of inventory reduction is greater when the different product demands are more negatively correlated.
A practical analysis for deferment design may start with an evaluation of the amount of inven-tory investment needed by a new design that aimed at form postponement, while the same customer service level can be satisfied. In this study, we kept the customer service target as a constant, say as same as 98% accomplished by Compaq, and eval-uated different deferment design alternatives in terms of their associated inventory investment. The corresponding advantage is that we can avoid the difficulty of comparing alternatives, which have different combinations of inventory and service.
On the other hand, capital investment is re-quired for product and/or process redesign. Im-plementation costs such as retraining, retesting, retooling, common parts for multiple product versions, installation of special equipment at downstream process stage, are quantifiable and need to be considered in the redesign analysis. Since technology advances rapidly and product life cycle shortens gradually, the capital investment risks become increasingly higher. Hence, rede-signing the product and process for postponement strategy should take heed to above-mentioned cost factors. At this point, only few research attempts have been made at concrete analysis models or approaches. Since the solution procedure of dy-namic programming is designed to find an optimal policy for the overall problem, a prescription of the optimal policy decision is determined at each design stage. This approach provides a policy prescription of what to do under every possible circumstance. Therefore, in the following section we propose a dynamic programming model to provide a system-wide analysis concerning the
postponement design associated with the cost drivers mentioned above for the managers.
3. The product differentiation dynamic programming (PDDP) model
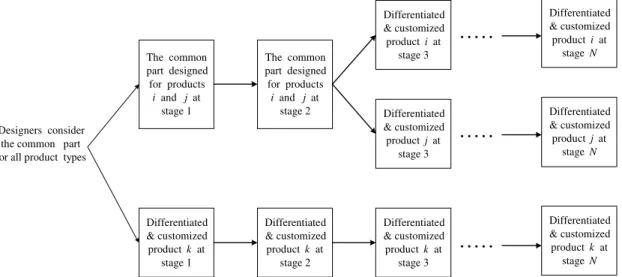
The production system considered in this paper is a divergent network. It represents that a product differentiated at some design stage will proceed to its own assembly operations in the remaining stages and will not be considered with other products for the possibility of a design common-ality (Fig. 1). It refers to part commoncommon-ality, which is the application of form postponement. Hence, the common pool set contains all types of products at the initial stage of the process. Following the progress of the process, the designer has to decide what product types should be differentiated from the common pool set at each design stage.
We considered an existing divergent production system that produces J types of products, where each product requires processes performed in N stages. The process stages of the manufacturing system are numbered in ascending order. A buffer is held to store the WIP inventory right after each stage. Each stockpoint controls its inventory level using a periodic review policy [2]. This policy means that the inventory position is reviewed each
unit time period. At each review, a replenishment order is issued so that the inventory position im-mediately after placing the order equals the order-up-to level S. Each stockpoint uses its own control parameter S. The levels are set to meet the target service levels. Moreover, we assumed that different stockpoints have the same review period (e.g. 1 week), and a replenishment order is issued on the same day (e.g. Monday).
All feasible designs for the manufacturing routing are initially established as the possible
states in each stage n, sðnÞ. The stage means that
designers ought to determine whether to continue with common processing or with some specific
processing. The state sðnÞ denotes a part, which is
the WIP for some products. An AND/OR graph applied here may generate all feasible designs for the product differentiation decisions. The branches of an AND/OR graph which are linked by arcs
represent AND alternatives which must be
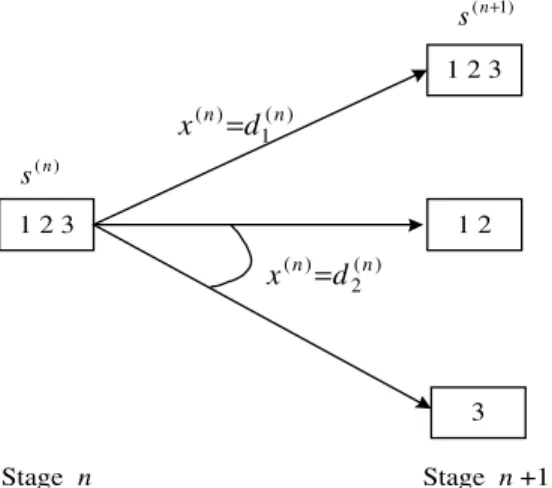
achieved simultaneously. When the branches are not linked by arcs, only one branch may be se-lected which implies OR alternatives. In an AND/ OR graph (Fig. 2), the design decision at stage n is denoted as xðnÞwhere xðnÞ¼ dkðnÞ, k¼ 1; 2; 3; . . . ; Kn,
and Knis total number of decisions for stage n. For
example as shown in Fig. 2, numbers in the
rect-angle of state sðnÞ stand for the WIP of final
product 1, 2, and 3. Selecting decision xðnÞ ¼ dðnÞ
1 The common part designed for products i and j at stage 1 Differentiated & customized product k at stage 1 The common part designed for products i and j at stage 2 Differentiated & customized product k at stage 2 Differentiated & customized product k at stage 3 Differentiated & customized product k at stage N Differentiated & customized product i at stage 3 Differentiated & customized product j at stage 3 Differentiated & customized product i at stage N Differentiated & customized product j at stage N Designers consider
the common part for all product types
. . . . . . . . . .
. . . . .
then moves the process from current state sðnÞ to
some state sðnþ1Þ at next stage, which denotes the
WIP of final product 1, 2, and 3. Meanwhile,
making decision xðnÞ¼ dðnÞ
2 indicates that one
spe-cific processing is required for the WIP of final product 1 and 2, and another for the WIP of final
product 3 only. In the case of xðnÞ ¼ dðnÞ
2 , state sðnÞ
(1 2 3) moves to two states (1 2) and (3)
simulta-neously at stage nþ 1. These two states are
rep-resented as SðxðnÞÞ, i.e., SðdðnÞ
2 Þ ¼ fð1 2Þ; ð3Þg.
The following notation was used to model the dynamic program for the design problem of product differentiation deferment:
N total stages in the system
n index of the stage, n¼ 1; 2; . . . :; N
J total product types
j index of the product, j¼ 1; 2; . . . :; J
Dj demands for product j per time period is
denoted by an i.i.d. random variable,
where it is normally distributed with (lj;rj)
b service level required for satisfying the
needs of back-end stage of the process
ltðsðnÞÞ processing lead-time required for
execut-ing operations of the common part
rep-resented by state sðnÞ
ICðsðnÞÞ extra investment costs for executing
op-erations of the common part represented
by state sðnÞ. This term is determined by
the allocation of the process and the extra design expenditure for the equipment or materials needed at stage n
PCðsðnÞÞ unit processing cost for executing
opera-tions of the common part represented by state sðnÞ
HCðsðnÞÞ unit inventory holding cost of the
spe-cific components for executing operations of the common part represented by state
sðnÞ. The buffer average inventory level of
the specific part for state sðnÞ is
IsðnÞ¼ P j2sðnÞlj 2 þ zsðnÞrsðnÞ ffiffiffiffiffiffiffiffiffiffiffiffiffiffiffiffiffiffiffiffiffi ltðsðnÞÞ þ 1 q
where rsðnÞ denotes the aggregation
stan-dard deviation of products represented by
sðnÞ and can be computed as
rsðnÞ¼ ffiffiffiffiffiffiffiffiffiffiffiffiffiffiffiffiffiffiffiffiffiffiffiffiffiffiffiffiffiffi Var X j2sðnÞ Dj 0 @ 1 A v u u u t ¼ ffiffiffiffiffiffiffiffiffiffiffiffiffiffiffiffiffiffiffiffiffiffiffiffiffiffiffiffiffiffiffiffiffiffiffiffiffiffiffiffiffiffiffiffiffiffiffiffiffiffiffiffiffiffiffiffiffiffiffiffiffiffiffiffiffiffiffiX j2sðnÞ r2 jþ 2 X j;k2sðnÞ; X j<k CovðDj; DkÞ s :
zsðnÞ is the safety factor that satisfies b and
can be computed as zsðnÞ ¼ ½1=2 ffiffiffiffiffiffiffiffiffiffiffiffi ð2=pÞ p ln½b=ð1 bÞ : 1 2 3 ) ( n s ) ( 1 ) (n n d x = Stage n Stage n +1 ) ( 2 ) (n n d x = ) 1 (n+ s 1 2 3 1 2 3
Fig. 2. An example of basic structure for design decisions among states of two successive stages in an AND/OR graph.
Table 1
product patterns and relative demand data
Pattern jðj ¼ 1; 2; 3; 4Þ Correlation Standard deviation
(1) Japan
(2) USA q12¼ 0:4; q13¼ 0:4; r12¼ 1096; r34¼ 1342;
(3) England q14¼ 0:4; q23¼ 0:3; r123¼ 894; r234¼ 1265;
(4) Germany q24¼ 0:3; q34¼ 0:1 r1234¼ 447
The cost function and recursive relationship of the proposed PDDP model are displayed as fol-lows:
fnðsðnÞ; xðnÞÞ the cost function for stage n as sðnÞand
xðnÞ are its current state and the
corre-sponding design decision, respectively. fnðsðnÞ; xðnÞÞ ¼ X sðnþ1Þ2SðxðnÞÞ Cðsðnþ1Þ; xðnÞÞ þ X sðnþ1Þ2SðxðnÞÞ fnþ1 ðsðnþ1ÞÞ; where f
nþ1ðsðnþ1ÞÞ indicates the corresponding
minimum costs of state sðnþ1Þat next stage.
Accordingly, recursive relationship is
fn ðsðnÞÞ ¼ Min X sðnþ1Þ2SðxðnÞÞ Cðsðnþ1Þ; xðnÞÞ 8 < : þ X sðnþ1Þ2SðxðnÞÞ fnþ1 ðsðnþ1ÞÞ 9 = ;: P
sðnþ1Þ2SðxðnÞÞCðsðnþ1Þ; xðnÞÞ the total operation cost
when design decision xðnÞ is adopted and the
dif-ferentiation process is moving to some state sðnþ1Þ,
sðnþ1Þ2 SðxðnÞÞ. In addition, Cðsðnþ1Þ; xðnÞÞ ¼ ICðsðnþ1ÞÞ þ PCðsðnþ1ÞÞ X j2sðnþ1Þ Dj þ HCðsðnþ1ÞÞI sðnþ1Þ;
which includes the extra investment cost, process-ing cost and inventory holdprocess-ing cost.
Table 2
Relative cost data for recursive function
sðnÞ xðnÞ sðnþ1Þ ICðsðnÞÞ PCðsðnÞÞ HCðsðnÞÞ sð1Þ1 d ð1Þ 1 s ð2Þ 1 3000 2 2 sð1Þ1 d ð1Þ 2 s ð2Þ 2 2000 4 4 sð1Þ1 d ð1Þ 2 s ð2Þ 3 2000 4 4 sð1Þ1 d ð1Þ 3 s ð2Þ 4 2500 5 4 sð1Þ1 d ð1Þ 3 s ð2Þ 5 1500 3 6 sð2Þ1 d ð2Þ 1 s ð3Þ 1 2000 6 4 sð2Þ1 d ð2Þ 1 s ð3Þ 2 1000 4 8 sð2Þ1 d ð2Þ 2 s ð3Þ 3 1500 5 6 sð2Þ1 d ð2Þ 2 s ð3Þ 4 1500 5 6 sð2Þ1 d ð2Þ 3 s ð3Þ 5 2000 6 4 sð2Þ1 d ð2Þ 3 s ð3Þ 7 1000 4 8 sð2Þ2 d ð2Þ 4 s ð3Þ 3 0 3 6 sð2Þ3 d ð2Þ 5 s ð3Þ 4 0 3 6 sð2Þ3 d ð2Þ 6 s ð3Þ 6 1000 4 8 sð2Þ3 d ð2Þ 6 s ð3Þ 7 1000 4 8 sð2Þ4 d ð2Þ 7 s ð3Þ 3 1500 5 6 sð2Þ4 d ð2Þ 7 s ð3Þ 6 1000 4 8 sð2Þ4 d ð2Þ 8 s ð3Þ 5 0 3 4 sð2Þ5 d ð2Þ 9 s ð3Þ 7 0 3 8 sð3Þ1 d ð3Þ 1 s ð4Þ 1 0 4 6 sð3Þ1 d ð3Þ 2 s ð4Þ 3 1500 7 10 sð3Þ1 d ð3Þ 2 s ð4Þ 7 1500 7 10 sð3Þ1 d ð3Þ 2 s ð4Þ 8 1500 7 10 sð3Þ1 d ð3Þ 3 s ð4Þ 3 500 5 10 sð3Þ1 d ð3Þ 3 s ð4Þ 5 1000 6 8 sð3Þ2 d ð3Þ 4 s ð4Þ 2 0 4 10 sð3Þ3 d ð3Þ 5 s ð4Þ 2 500 5 10 sð3Þ3 d ð3Þ 5 s ð4Þ 3 500 5 10 sð3Þ3 d ð3Þ 6 s ð4Þ 4 0 4 8 sð3Þ4 d ð3Þ 7 s ð4Þ 5 0 4 8 sð3Þ4 d ð3Þ 8 s ð4Þ 7 500 5 10 sð3Þ4 d ð3Þ 8 s ð4Þ 8 500 5 10 sð3Þ5 d ð3Þ 9 s ð4Þ 4 1000 6 8 sð3Þ5 d ð3Þ 9 s ð4Þ 7 500 5 10 sð3Þ5 d ð3Þ 10 s ð4Þ 6 0 4 6 sð3Þ5 d ð3Þ 11 s ð4Þ 2 500 5 10 sð3Þ5 d ð3Þ 11 s ð4Þ 3 500 5 10 sð3Þ5 d ð3Þ 11 s ð4Þ 7 500 5 10 sð3Þ6 d ð3Þ 12 s ð4Þ 7 0 4 10 sð3Þ7 d ð3Þ 13 s ð4Þ 8 0 4 10 sð4Þ1 d ð4Þ 1 s ð5Þ 2 1000 8 12 sð4Þ1 d ð4Þ 1 s ð5Þ 3 1000 8 12 Table 2 (continued) sðnÞ xðnÞ sðnþ1Þ ICðsðnÞÞ PCðsðnÞÞ HCðsðnÞÞ sð4Þ1 d ð4Þ 1 s ð5Þ 4 1000 8 12 sð4Þ2 d ð4Þ 2 s ð5Þ 1 0 5 12 sð4Þ3 d ð4Þ 3 s ð5Þ 2 0 5 12 sð4Þ4 d ð4Þ 4 s ð5Þ 1 500 7 12 sð4Þ4 d ð4Þ 4 s ð5Þ 2 500 7 12 sð4Þ5 d ð4Þ 5 s ð5Þ 3 500 7 12 sð4Þ5 d ð4Þ 5 s ð5Þ 4 500 7 12 sð4Þ6 d ð4Þ 6 s ð5Þ 1 1000 8 12 sð4Þ6 d ð4Þ 6 s ð5Þ 2 1000 8 12 sð4Þ6 d ð4Þ 6 s ð5Þ 3 1000 8 12 sð4Þ7 d ð4Þ 7 s ð5Þ 3 0 5 12 sð4Þ8 d ð4Þ 8 s ð5Þ 4 0 5 12
1 2 3 4 1 2 3 4 2 3 4 1 2 3 4 1 1 2 3 2 3 4 1 2 3 4 4 1 1 2 3 4 2 1 2 3 2 3 4 1 2 3 4 4 1 2 3 Stage
2
3
4
) 1 ( 1 s ) 2 ( 5 s s4(2) ) 2 ( 1 s ) 2 ( 2 s ) 2 ( 3 s ) 3 ( 7 s (3) 6 s (3) 5 s (3) 4 s (3) 3 s s2(3) ) 3 ( 1 s ) 4 ( 1 s ) 4 ( 2 s ) 4 ( 3 s ) 4 ( 4 s ) 4 ( 5 s ) 4 ( 6 s ) 4 ( 7 s ) 4 ( 8 s ) 1 ( 3 d ) 1 ( 2 d ) 1 ( 1 d ) 2 ( 9 d ) 2 ( 8 d ) 2 ( 7 d (2) d5(2) 6 d ) 2 ( 4 d ) 2 ( 3 d ) 2 ( 2 d (2) 1 d ) 3 ( 4 d ) 3 ( 6 d ) 3 ( 5 d ) 3 ( 3 d ) 3 ( 2 d ) 3 ( 1 d ) 3 ( 8 d d7(3) ) 3 ( 11 d ) 3 ( 10 d ) 3 ( 9 d ) 3 ( 12 d ) 3 ( 13 d ) 4 ( 8 d (4) 7 d ) 4 ( 6 d (4) 5 d ) 4 ( 4 d ) 4 ( 3 d (4) 2 d ) 4 ( 1 d1
) 5 ( 3 s (5) 2 s (5) 1 s ) 5 ( 4 s5
4. Illustrative example
A manufacturing system involves five major
stages (N ¼ 5) through which each of five
end-products (J ¼ 4) must proceed. Redesigning the
products or processes for the postponement strategy perhaps requires extra investment to ar-range the common parts for use in some of these products. This increases capital introduction, but there is a great advantage to risk-pooling effects. At the initial stage of the process, the common pool set contains all components required for 4 product types. Hence, which kind of components should be differentiated from this set for the next stage must be decided by product designers.
The first step in designing differentiation pro-cesses is the establishment of the feasibility of the common parts for the specific product patterns at each stage. Within this step, the engineers and designers analyze and determine the proper struc-ture and functionality for the common parts. After prudent analysis and screening test by manage-ment and design teams, feasible design alternatives are therefore determined at each stage.
Assume that the service level required for each stockpoint is 98% and the lead-time for each stage takes 1 week. Demands for each product per week have an identical normal distribution with mean
lj¼ 10;000 and standard deviation rj¼ 1000
(j¼ 1; 2; 3; 4). Moreover, we assume that the
de-mands of the end-products represent negatively correlated to take advantage of the increase in the
inventory savings. Table 1 presents the relevant data of product demands for the dynamic pro-gramming analysis. Table 2 shows the required cost parameter values corresponding to each fea-sible state.
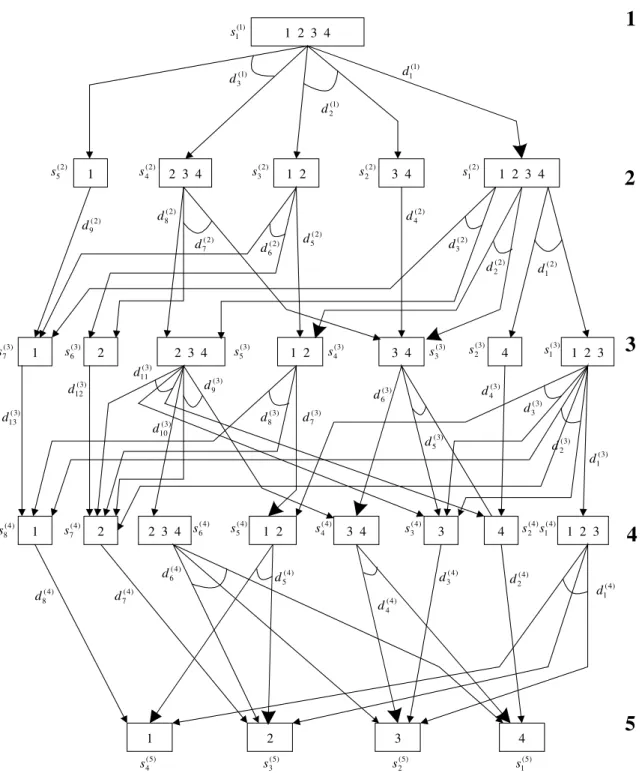
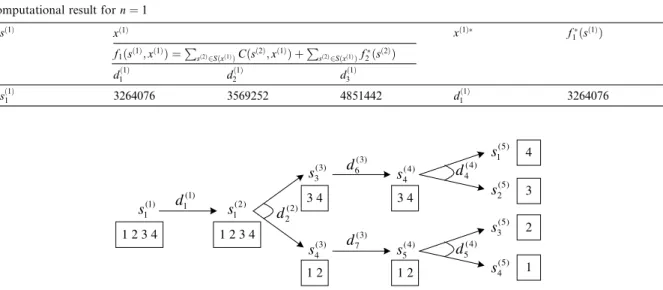
At each design stage, a decision should be made whether to continue with the common part as-semblies or to proceed with specific component differentiation. The recursive relationship keeps recurring as we start at the end stage and move backward stage by stage. That is, a backward search should be executed to determine the most meaningful differentiation plan. Fig. 3 depicts all feasible design alternatives at each design stage. The computational results at each stage are shown in Tables 3–6 . An optimal solution for the entire product differentiation problem can now be iden-tified from the four tables. These results also are summarized in Fig. 4. Following the arrows in Fig. 4 from stages 1 to 5 gives the prescriptive optimal solutions. Namely, the results show that all com-ponents required for different product patterns are differentiated at the final stage. It is to design a common part used for patterns 1 and 2, and an-other common part used for patterns 3 and 4 at stages 3 and 4, respectively. And so forth it is to design a common part used for all patterns in the initial two stages.
This example clarifies how the differentiation plan should be determined and executed. It shows the potency of the proposed PDDP approach and its application for solving a practical design
Table 3
Computational result for n¼ 4
sð4Þ xð4Þ xð4Þ f 4ðsð4ÞÞ f4ðsð4Þ; xð4ÞÞ ¼ P sð5Þ2Sðxð4ÞÞCðsð5Þ; xð4ÞÞ d1ð4Þ d ð4Þ 2 d ð4Þ 3 d ð4Þ 4 d ð4Þ 5 d ð4Þ 6 d ð4Þ 7 d ð4Þ 8 sð4Þ1 547164 d ð4Þ 1 547164 sð4Þ2 151388 d ð4Þ 2 151388 sð4Þ3 151388 d ð4Þ 3 151388 sð4Þ4 343776 d ð4Þ 4 343776 sð4Þ5 343776 d ð4Þ 5 343776 sð4Þ6 547164 d ð4Þ 6 547164 sð4Þ7 151388 d ð4Þ 7 151388 sð4Þ8 151388 d ð4Þ 8 151388
Computational result for n¼ 3 sð3Þ xð3Þ xð3Þ f 3ðsð3ÞÞ f3ðsð3Þ; xð3ÞÞ ¼Psð4Þ2Sðxð3ÞÞCðsð4Þ; xð3ÞÞ þPsð4Þ2Sðxð3ÞÞf4 ðsð4ÞÞ d1ð3Þ d ð3Þ 2 d ð3Þ 3 d ð3Þ 4 d ð3Þ 5 d ð3Þ 6 d ð3Þ 7 d ð3Þ 8 d ð3Þ 9 d ð3Þ 10 d ð3Þ 11 d ð3Þ 12 d ð3Þ 13 sð3Þ1 775662 922134 801394 d ð3Þ 1 775662 sð3Þ2 275878 d ð3Þ 4 275878 sð3Þ3 572756 540808 d ð3Þ 6 540808 sð3Þ4 534016 572756 d ð3Þ 7 534016 sð3Þ5 868186 783342 631134 d ð3Þ 11 631134 sð3Þ6 275878 d ð3Þ 12 275878 sð3Þ7 275878 d ð3Þ 13 275878 Table 5
Computational result for n¼ 2
sð2Þ xð2Þ xð2Þ f 2ðsð2ÞÞ f2ðsð2Þ; xð2ÞÞ ¼ P sð3Þ2Sðxð2ÞÞCðsð3Þ; xð2ÞÞ þ P sð3Þ2Sðxð2ÞÞf3 ðsð3ÞÞ d1ð2Þ d ð2Þ 2 d ð2Þ 3 d ð2Þ 4 d ð2Þ 5 d ð2Þ 6 d ð2Þ 7 d ð2Þ 8 d ð2Þ 9 sð2Þ1 3137992 2593790 10016584 d ð2Þ 2 2593790 sð2Þ2 1261338 d ð2Þ 4 1261338 sð2Þ3 1261338 768940 d ð2Þ 6 768940 sð2Þ4 1715712 2450114 d ð2Þ 7 1715712 sð2Þ5 373470 d ð2Þ 9 373470 H.-M. Hsu, W.-P. Wang / European Journal of Operation al Research 156 (2004) 183–193 191
problem of product differentiation deferment. Using the suggested dynamic approach, the dif-ferentiation problems can be solved in a systematic way, which provides satisfactory results. This ap-proach is the basis for a logical formulation, search and selection of the most meaningful dif-ferentiation process. It should be considered when dealing with the issue of determining the deferral points of product differentiation.
5. Conclusions
To respond to the challenge of product prolif-eration and demand uncertainty, deferring prod-uct differentiation in the prodprod-uct design process is imperative. We propose a dynamic programming approach following an AND/OR graph to con-cretely analyzing the decisive design problem for differentiation deferment. The impact of deferment on capital investment and inventory risk-pooling effects were quantified and incorporated in the model. The represented PDDP model is intended for tactical planning rather than strategic planning under considerations of the investment costs, the inventory holding costs and the processing costs. This tactic defines the meaningful product differ-entiation process for execution. The PDDP model
provides conditions to decide at every design stage and to designate which step must follow. In fact, the current study expects to play the pioneer role in solving the entire product/process redesign problem concerning the differentiation point de-ferment. Future research includes expanding the cost terms considered in the objective and devoting computational efforts in the solution procedure. In addition, the issues of the lead time and service levels integrated into the model are deserve for studying the quick response effectiveness in detail.
References
[1] J. Antonio, F. Chauvet, C. Chu, J.M. Proth, The cutting stock problem with mixed objectives: Two heuristics based on dynamic programming, European Journal of Opera-tional Research 114 (1999) 395–402.
[2] A. Clark, H. Scarf, Optimal policies for a multi-echelon inventory problem, Management Science 6 (1960) 474– 490.
[3] P. Child, R. Diederichs, F. Sanders, S. Wisniowski, The management of complexity, Sloan Management Review, Fall (1991) 73–80.
[4] M.A. Cohen, H.L. Lee, Strategic analysis of integrated production-distribution systems: Models and methods, Operations Research 36 (1988) 216–228.
[5] G.D. Eppen, L. Schrage, in: L.B. Schwarz (Ed.), Central-ized Ordering Policies in a Multi-Warehouse System with Lead Times and Random Demand in Multi Level Produc-Table 6
Computational result for n¼ 1
sð1Þ xð1Þ xð1Þ f 1ðsð1ÞÞ f1ðsð1Þ; xð1ÞÞ ¼ P sð2Þ2Sðxð1ÞÞCðsð2Þ; xð1ÞÞ þ P sð2Þ2Sðxð1ÞÞf2 ðsð2ÞÞ d1ð1Þ d ð1Þ 2 d ð1Þ 3 sð1Þ1 3264076 3569252 4851442 d ð1Þ 1 3264076 1 2 3 4 ) 1 ( 1 s s1(2) ) 3 ( 3 s ) 3 ( 4 s ) 4 ( 4 s ) 4 ( 5 s ) 5 ( 1 s ) 5 ( 2 s ) 5 ( 3 s ) 5 ( 4 s 1 2 3 4 3 4 1 2 3 4 1 2 4 3 2 1 ) 4 ( 4 d ) 4 ( 5 d ) 3 ( 7 d ) 3 ( 6 d ) 2 ( 2 d ) 1 ( 1 d
tion/Inventory Systems: Theory and Practice, North-Hol-land, Amsterdam, 1981.
[6] D.W. He, A. Kusiak, Design of assembly systems for modular products, IEEE Transactions on Robotics and Automation 13 (5) (1997) 646–655.
[7] D.W. He, A. Kusiak, T.L. Tseng, Delayed product differentiation: A design and manufacturing perspective, Computer-Aided Design 30 (2) (1998) 105–113.
[8] C.Y. Lee, Two-machine flowshop scheduling with avail-ability constraints, European Journal of Operational Re-search 114 (1999) 420–429.
[9] H.L. Lee, C. Billington, Designing Products and Processes for Postponement, Working Paper, 1994.
[10] H.L. Lee, Effective management of inventory and service through product and process redesign, Operations Re-search 44 (1996) 151–159.
[11] H.L. Lee, C.S. Tang, Modeling the costs and benefits of delayed product differentiation, Management Science 43 (1) (1997) 40–53.
[12] M.J. Maloni, W.C. Benton, Supply chain partnerships: Opportunities for operations research, European Journal of Operational Research 101 (1997) 419–429.
[13] K.D. Penev, A.J. Ron, Determination of a disassembly strategy, International Journal of Production Research 34 (2) (1996) 495–506.
[14] L.B. Schwarz, Models for assessing the value of warehouse risk-pooling: Risk-pooling over outside-supplier lead times, Management Science 35 (1989) 828–842.
[15] A.I. Sonmez, A. Baykasoglu, A new dynamic program-ming formulation of (n m) flowshop sequencing problems with due dates, International Journal of Production Research 36 (6) (1998) 2269–2283.