國
立
交
通
大
學
網路工程研究所
碩
士
論
文
Embedded TaintTracker: 一個輕型污染資料追縱系統
以對抗緩衝區溢位的惡意程式碼攻擊
Embedded TaintTracker : Run-time lightweight tracking of taint
data against arbitrary code execution in buffer overflow attacks
研 究 生:吳梵誠
指導教授:林盈達 教授
Embedded TaintTracker: 一個輕型污染資料追縱系統
以對抗緩衝區溢位的惡意程式碼攻擊
Embedded TaintTracker: Run-time lightweight tracking of taint
data against arbitrary code execution in buffer overflow attacks
研 究 生:吳梵誠 Student: Fan-Cheng Wu
指導教授:林盈達 Advisor: Dr. Ying-Dar Lin
國立交通大學
網路工程研究所
碩士論文
A Thesis
Submitted to Institutes of Network Engineering College of Computer Science
National Chiao Tung University in partial Fulfillment of the Requirements
for the Degree of Master
In
Computer Science and Engineering June 2008
HsinChu, Taiwan, Republic of China
Embedded TaintTracker: 一個輕型污染資料追縱系統
以對抗緩衝區溢位的惡意程式碼攻擊
學生: 吳梵誠
指導教授: 林盈達
國立交通大學網路工程研究所
摘要
緩衝區溢位是指在一已配置的記憶體中,寫入超過配置大小的資料,其目的 在於取得系統的控制權。在過去的數年裡,有將近 40%的程式弱點屬於緩衝區溢 位。先前的解決方案中,有人提出了基於污染追縱的方式來對抗緩衝區溢位攻 擊,他們藉由將欲保護的程式運行在模擬器上,得以追縱源自網路上的污染資料 並檢查是否有執行它們。然而,這類的實做方式卻造成了龐大的效能損失。我們 分析其來源,發現有近 60%的損失是來自模擬器、另外 40%的損失則是用來動態 欄 截 指 令 及 維 護 污 染 資 料 的 資 訊 。 在 本 論 文 中 , 我 們 提 出 了 Embedded TaintTracker,一個新的對抗緩衝區溢位的輕型污染資料追縱系統。這個系統藉 著將檢查機制壓縮至作業系統的核心中,以及將汙染資料的追縱程式在編譯時期 插入,得以消除來自模擬器及動態欄截指令的效能損失。在我們的實驗中,證實 了運作在 Embedded TaintTracker 的程式只會有 9.3%的效能損失,比起之前的 解決方案 TaintCheck 其效能至少增進了 8 倍。 關鍵字: 程式安全、緩衝區溢位、汙染追縱Embedded TaintTracker: Lightweight run-time tracking of taint
data against arbitrary code execution in buffer overflow attacks
Student:
Fan-Cheng
Wu Advisor:
Dr.
Ying-Dar
Lin
Department of Network Engineering
National Chiao Tung University
Abstract
A buffer overflow attack occurs when a program writes data outside the allocated memory and aims at invading a system. Around forty percent of all software vulnerabilities were attributed to buffer overflow over the past several years. The previous works based on taint tracking, a novel technique to prevent buffer overflow, ran a victim's program on an emulator to dynamically instrument the code for tracking the propagation of data originated from network in memory and checking whether malicious code is executed. However, the critical problem of these works is their heavy performance overhead. We analyzed the overhead and found that 60% of overhead is from the emulator and remaining 40% is from dynamic instrumentation and taint information maintenance. In this thesis, a new taint-style system, Embedded TaintTracker, is proposed to eliminate overhead in the emulator and dynamic instrumentation by compressing a checking mechanism into the kernel of operating system (OS) and moving instrumentation from runtime to compilation time. The evaluation demonstrated that our system imposes only 9.3% performance degradation, and thus it outperforms the previous work, TaintCheck, by at least 8 times.
Contents
CHAPTER 1 INTRODUCTION...1
CHAPTER 2 BACKGROUND ...5
2.1BUFFER OVERFLOW ATTACK...5
2.2SOLUTIONS FOR BUFFER OVERFLOW ATTACKS...6
2.2.1 Static detector ...7
2.2.2 Dynamic detector ...8
CHAPTER 3 DESIGN AND IMPLEMENTATION OF EMBEDDED TAINTTRACKER ...11
3.1SYSTEM OVERVIEW...11
3.2STATIC INSTRUMENTATION...13
3.3TAINT RECORDER...16
3.4EXPLOIT INSPECTOR...17
CHAPTER 4 EXPERIMENTAL EVALUATION ...20
4.1EFFECTIVENESS...20
4.2PERFORMANCE...21
CHAPTER 5 CONCLUSIONS AND FUTURE WORKS ...25
List of Figures
FIG.1.FREQUENCY OF BUFFER OVERFLOW VULNERABILITIES IN RECENT YEARS...1
FIG.2.STACK SMASHING ATTACK...2
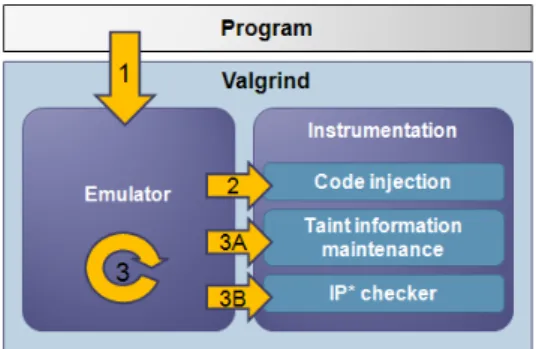
FIG.3.SYSTEM ARCHITECTURE OF TAINTCHECK...10
FIG.4.ARCHITECTURE OF EMBEDDED TAINTTRACKER AND THE INTERACTION WITH PROTECTED
PROGRAM...12
FIG.5.MAJOR COMPILATION PHASES OF GCC. ...13
FIG.6.OBTAIN AN TAINT STATUS VIA PAGE INFORMATION TABLE.. ...17
FIG.7.CONSTANT OFFSET FOR VARIABLE USER_EIP OF THREAD_INFO STRUCTURE AND REGISTER EIP. .19
FIG.8.STORE EIP OF USER SPACE INTO THREAD_INFO STRUCTURE. ...19
FIG.9.ADD A NEW VARIABLE USER_EIP IN THREAD_INFO STRUCTURE. ...19
FIG.10.THE LOG FROM EMBEDDED TAINTTRACKER AFTER DETECTING AN ATTACK. ...21
FIG.11.EXPERIMENTAL RESULT OF PERFORMANCE EVALUATION: A) LATENCY IN DIFFERENT PAGE SIZES
REQUESTED, AND Y-AXIS IS THE SLOWDOWN FACTOR WHICH IS LATENCY OF MECHANISM-ENABLED
DIVIDED BY NATIVE EXECUTION TIME; B) AND C) ARE DEGRADATION ON THROUGHPUT AND
REQUESTS PER SECOND FOR DIFFERENT NUMBERS OF CLIENTS.THE NATIVE RESULTS ARE LISTED
List of Tables
TABLE 1.TECHNIQUES FOR BUFFER OVERFLOW DETECTION... 7
TABLE 2.DYNAMIC BUFFER OVERFLOW DETECTOR. ... 8
TABLE 3.RHS VARIABLE FORMS AND THEIR CORRESPONDING PROCESSING OF TAINT PROPAGATION... 15
Chapter 1 Introduction
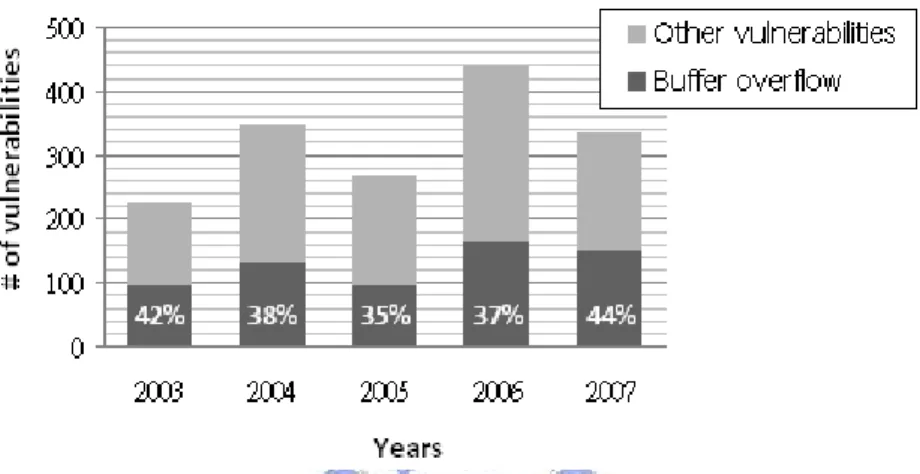
The first buffer overflow attack, Morris Worm [1], was exposed in 1988 and caused a disruption never seen before. Over the last two decades, buffer overflow has become one of the well-known software vulnerabilities, and is still a significant threat to the security of computer systems. As statistics from vulnerabilities notes of US-CERT, there were about 40% vulnerabilities belonging to buffer overflow [2] in recent years.
Fig. 1. Frequency of buffer overflow vulnerabilities in recent years.
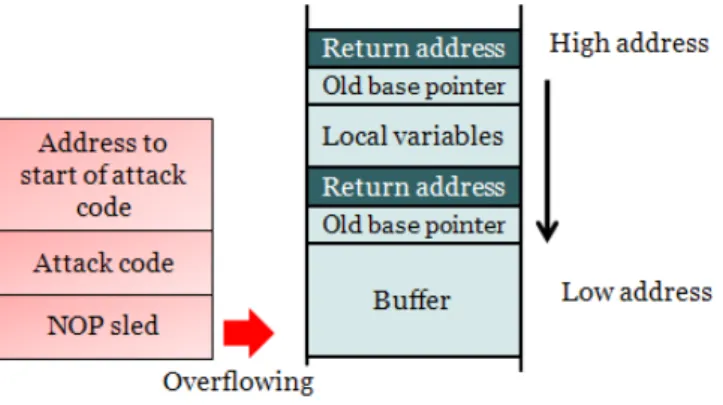
A buffer overflow attack occurs when a program writes data outside the allocated memory and aims at controlling a system. To launch a buffer overflow attack, an attacker must inject attack code to the address space of a victim program by any legitimate form of input, and then corrupts a code pointer in the address space by overflowing a buffer to make the code pointer points to the injected code. The most common and simplest type of attacks, “stack smashing”, hijacks a program by overflowing the buffer on the stack with the malicious code and the address to start of malicious code so that the return address is modified and the program will jump to the malicious code when it tries to return to its caller, as shown in Fig. 2. The more complex types of attacks [3,4] may not change the return address but attempt to
corrupt other code pointers, including function pointers, global offset table (GOT) entries, and longjmp buffers, to cause that a program executes malicious code.
Fig. 2. Stack smashing attack.
Many methods with either static approaches or dynamic approaches have been proposed to defend buffer overflow attacks. Static approaches, usually applied at development time, analyze potential buffer overflow vulnerabilities without executing programs, while dynamic approaches apply detection in run-time. However, current solutions have various drawbacks. For example, static approaches produce a lot of false alarms and miss certain vulnerabilities due to run-time information leakage, such as path reachability and variable aliases. Although dynamic approaches applied detection in run-time can achieve better accuracy than static ones, they either do not protect against all forms of buffer overflow attack or impose too high performance overhead to be adopted in real-time usage, which is important for detection of buffer overflow attack because the attack traffic is a specific pattern and difficult to produce in lab testing.
Many methods with either static or dynamic approaches have been proposed to defend against buffer overflow attacks. Static approaches analyze potential buffer overflow vulnerabilities without execution. Dynamic approaches usually inject the code at compilation time for code pointer protection or bounds checking and detect the attack at run-time. However, these approaches have various drawbacks. Static
approaches produce a lot of false alarms and miss certain vulnerabilities due to run-time information leakage, such as path reachability and variable aliases [5]. Dynamic approaches applied detection at run-time can achieve better accuracy than static ones, but these approaches suffer from a heavy performance overhead in order to protect against all forms of buffer overflow attacks. With the heavy performance overhead, they are only applied at testing time and impractical for detection of buffer overflow attacks, because the payload of such attacks is usually a particular and complicated pattern that is difficult to be generated in testing time.
In this thesis, a run-time lightweight system, Embedded TaintTracker, is proposed to defend against all forms of buffer overflow attacks. Embedded TaintTracker based on a well-known dynamic technique, taint tracking, which defends the attacks by prohibiting from the execution of attack code. Based on this technique, two representative methods, TaintCheck [6] and TaintTrace [7], run a victim’s program on an emulator to monitor all its operations, and track the propagation of taint data, which refer to data originated from untrusted sources, such as the Internet. When a program executes a piece of taint data as part of its code, these methods will immediately freeze the program and trigger an alarm to indicate a possible instance of malicious code execution before a suspect attack. At the same time, these methods are able to extract the signature of the attack for intrusion prevention system (IPS) and keep the complete program status for developers to fix the hole. However, these methods impose heavy performance overhead. Our proposed method, Embedded TaintTracker, implements taint tracking with a novel approach to keep the original advantage of a taint tracking system and boost the performance to be acceptable for practical use.
The rest of this thesis is organized as follows. Chapter 2 briefs the ways to generate a buffer overflow attack and reviews some solutions. We present the design
concept and implementation of Embedded TaintTracker in Chapter 3. In Chapter 4, we demonstrate the ability of Embedded TaintTracker to detect known buffer overflow attacks with excellent performance. Finally, Chapter 5 concludes this thesis with a discussion of some future directions.
Chapter 2 Background
Buffer overflow vulnerabilities and attacks come in a variety of forms, and many tools were proposed to defend against them. In this chapter, we introduce buffer overflow vulnerabilities, steps to launch an attack on such vulnerabilities, and some solutions to detect these attacks.
2.1 Buffer overflow attack
Buffer overflow takes place when a program does not check if the data exceeds its memory buffer size and copies the excess data into location adjacent to the buffer. It mainly occurs in string functions supported by standard C library, such as strcpy(), strcat(), sprintf(), gets() and so on. Programmer should avoid using these unsafe functions and replaces with the “safe” string functions like strn*(). However, there are still many pitfalls in the “safe” functions. For instance, strncpy() is inconsistent with strncat() at null terminator handling, leading to an off-by-one bug, a form of buffer overflow vulnerability. strncpy(dst, src, n), which copies a string of at most n bytes from buffer src to dst , may leave dst unterminated if there is no null character among the first n bytes of src. It is dissimilar with strncat(), which always appends a null terminator in the destination buffer. Additional pitfalls are discussed in [8].
A careless programmer may easily encounter these pitfalls and expose host his/her computer to denial of service attacks or even arbitrary code execution, which allows attackers to control the host. It is the major goal of buffer overflow attack.
address space of a victim program by any legitimate form of input, and then corrupts a code pointer in the address space by overflowing a buffer to make the code pointer points to the injected code. A common and simple way to corrupt a code pointer, as mentioned in Chapter 1, is the stack smashing attack that overflows the return address and jumps to attack code when the function returns. The other ways to change the control flow including corruption of a function pointer, longjmp buffer, and entries in global offset table (GOT). If the function pointer is redirected to the attack code by overflowing, the attack code will be executed when the function pointer is dereferenced. Another method is overflowing longjmp buffer. When setjmp() is executed, longjmp buffer will store current stack context such as a code pointer and local variables for rollback later. The attacker can overflow the code pointer in this buffer, and make the program jumps to attack code when longjmp() is called. Yet another venue is overflowing entries in GOT. The GOT stores absolute address of a function call symbol used in dynamically linked code. The attacker can replace the address in GOT with the address of attack code, so the program will jump to attack code when the function with the overwritten address is called.
2.2 Solutions for buffer overflow attacks
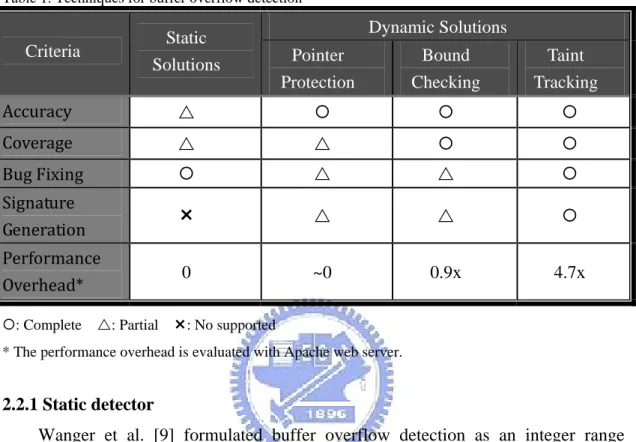
The tools for detecting buffer overflow operate either a static or dynamic manner. Static tools used in development time analyze potential buffer overflow vulnerabilities without executing programs. These tools do not incur run-time overhead, but have theoretical and practical limits on accuracy. For example, precise analysis of arbitrary C programs depends on several undecidable problems, including path reachability and variable aliases [5], and static tools all have to face a tradeoff between precision and scalability. Dynamic tools used in runtime do not have the limits, but performance
overhead is a critical problem. Table 1 summarized the comparisons of static solution and variety of dynamic solutions. In the following section, we will introduce some static and dynamic tools.
Table 1. Techniques for buffer overflow detection
Dynamic Solutions Criteria Static Solutions Pointer Protection Bound Checking Taint Tracking Accuracy U { { { Coverage U U { { Bug Fixing { U U { Signature Generation ² U U { Performance Overhead* 0 ~0 0.9x 4.7x
{: Complete U: Partial ²: No supported
* The performance overhead is evaluated with Apache web server.
2.2.1 Static detector
Wanger et al. [9] formulated buffer overflow detection as an integer range analysis problem. The approach models a C string as a pair of integer ranges of allocated size and length. Vulnerable functions in the C standard library are modeled as their operations on the integer ranges. This tool checks whether its inferred string length is less than allocated size in each string operations. However, the tool is impractical to use since a lot of false positives are produced along with some false negatives due to imprecision in the range analysis. Splint [10] is an annotation-based analysis tool extended from LCLint [11] by introducing new annotations which allows the declaration of a set of preconditions and postconditions in each function. The experiment result shows Splint still produce a number of false positives that is impossible to eliminate because of general undecidability of static analysis.
2.2.2 Dynamic detector
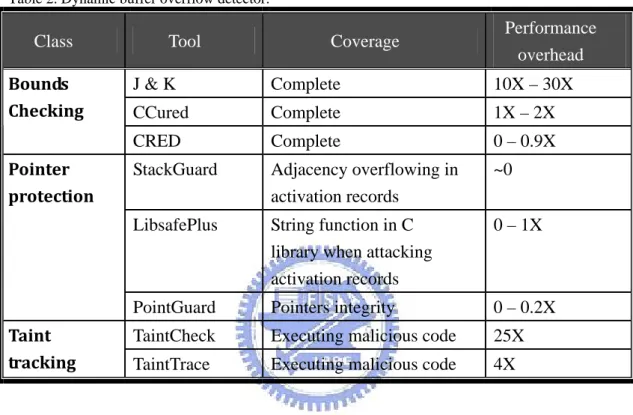
Dynamic approaches could be classified into bounds checking, pointer protection, and taint tracking, according to what technologies they use. A summary is shown in Table 1.
Table 2. Dynamic buffer overflow detector.
Class Tool Coverage Performance
overhead J & K Complete 10X – 30X CCured Complete 1X – 2X Bounds Checking CRED Complete 0 – 0.9X
StackGuard Adjacency overflowing in
activation records
~0
LibsafePlus String function in C library when attacking activation records
0 – 1X
Pointer protection
PointGuard Pointers integrity 0 – 0.2X
TaintCheck Executing malicious code 25X
Taint
tracking TaintTrace Executing malicious code 4X
Bound checking provides perfect protection against buffer overflows via complex analysis and patch on source codes, and thus the tools based on bounds checking incur a substantial cost in compatibility with existing codes and performance. The tool proposed by Jones and Kelly [17] is based on the principle that an address computed from an in-bounds pointer must have the same referent object as the original pointer. Thus this tool maintains a run-time object table which collects all the base addresses and size information of all static, heap and stack objects. Performance overhead of this tool is high, approximately ten to thirty times slowdown. CCured [12] is a hybrid language designed to be a safer version of the C programming language. It transforms unsafe types of a C program into safe types through static
analysis. Programs that cannot be represented to safe types are instrumented with run-time checks in order to monitor the safety of executions. Performance overhead is still high at approximately two to three times. CRED [13] replaces every out-of-bounds (OOB) pointer value with the address of a special OOB object created for that value. The OOB object will maintain the actual pointer value and information on the referent object. Any pointer derived from the address is bounds checked before it can be dereferenced. CRED has the best performance among all bounds checking tools, but the slowdown can still achieve up to 1.2 times in some cases.
Pointer protection aims to confine pointer manipulation to a limit of range or modify the behavior of reference and dereference from a pointer. These tools have excellent performance that can be used in products, but they do not leave any useful clues for developer to patch the holes. The developer must spend much time on finding the bug to fix, and the victim program will remain vulnerable to the attack during this period, leading to denial of service. StackGuard [14] is perhaps the most well-referenced tools. The tool prevents stack smashing attack by placing a canary word prior to the return address, and verifying whether the canary word is changed before the subroutine returns to the original instruction location. PointGuard [16] provides integrity for pointers by encrypting pointers when stored in memory, and decrypting them only when loaded into CPU. When an address is overwritten to a malicious address, it decrypts the address to a random value that reasonably crashes the program. LibsafePlus [17] uses a dynamic library which provides wrapper functions for unsafe C library functions. A wrapper function determines the source and the target buffer sizes, provided by GCC debugging option -g, and makes sure that invocation of the wrapper functions would not result in an overflow.
Taint tracking is the third dynamic technique against buffer overflow. This technique keeps track of the propagation of untrusted (taint) data during program
execution. Taint data represent any data from an untrusted source such as network or some specific devices. When a program executes a piece of code derived from an untrusted source, a tool based on this technique will produce an alarm to indicate a possible instance of malicious code execution. TaintCheck performs taint tracking for a program by running the program in an emulator Valgrind [18], which allows TaintCheck to monitor and control the program’s execution. Fig. 3 illustrated how TaintCheck keeps track of taint data and examines an attack code is executed. When the program was loaded into the emulator of Valgrind, the instrumentation will determine the kind of the instruction, and insert codes for taint information maintenance and instruction pointer examination if needed. However, this way to implement taint tracking imposes heavy overhead up to thirty times, which is possibly due to instrumentation at runtime, high frequency of checking malicious execution, and the emulator itself. Thus another solution, TaintTrace, is designed to decrease the overhead which leveraging DynamoRIO [19] which is a dynamic code modification system including a number of optimization techniques to keep low overhead, but the experiment shows it still brings over five times slowdown.
Chapter 3 Design and Implementation of Embedded
TaintTracker
Taint tracking tracks taint data propagation and examines if a program is executing a piece of taint data. The previous works, including TaintCheck and TaintTrace, achieve these goals through executing the program on an emulator to monitor each instruction at runtime, but this causes a heavy overhead from the emulator, instrumentation at runtime and frequent malicious execution examinations. Our proposed architecture of Embedded TaintTracker avoids such overhead by interacting with the protected program differently through its three components, Static
Instrumentation, Taint Recorder and Exploit Inspector, as shown in Fig. 4. Static
Instrumentation and Taint Recorder are used to track taint propagation and maintain taint information table respectively. Exploit Inspector produces an alarm if arbitrary code is executed. In the following section, we will first give a system overview and then elaborate these components in detail.
3.1 System overview
As shown in Fig. 4, Static Instrumentation inserts taint-tracking codes into the original program at compilation time. Taint Recorder maintains the taint information table and provides a set of functions for the inserted codes to track taint propagation through the taint information table. Exploit Inspector is a kernel module that provides a checking subroutine to examine whether the program is executing code from a piece of tracked taint data. The first two components move injection of taint-tracking code from execution time to compilation time. The last component reduces the frequency of checking malicious execution from each jump-instruction to each switch between
user mode and kernel mode. Note that we assume that a piece of malicious code will invoke a system call when invading a system. For example, when an attacker would like to add a new user, he must invoke open, write and close system calls. When the attacker wants to execute an external program, fork, vfork, or clone system call will be invoked. Exploit Inspector Kernel Space User Space Taint Recorder LibTaint Program
System call routines
Update (/proc/taint)
copy_from_user(…)
Memory Copy Operations Socket Read Operations
Syscall Operations Other Operations 0x00000000 0x00000000 Page Directory 0x08123456
System call entry point
Checking subroutine
Page Directories 0x08123456
Static Instrumentation
Program Source Codes Compilation
Time
Runtime
Pages
0 1 0
Fig. 4. Architecture of Embedded TaintTracker and the interaction with protected program.
To enable detection mechanism of our system on a program, at compilation time the source code of a program must be injected with a sequence of function calls near the memory copy operations for maintaining taint information, so that taint information can be dynamically updated in runtime. These functions are provided by the library of Taint Recorder which should be linked to the instrumented program. When the program is executing and invoking a system call, Exploit Inspector will be triggered to examine the instruction pointer. If the pointer points to taint data, then an arbitrary code execution is implicated. Exploit Inspector will terminate the victim’s process, provide an alarm of the attack to the administrator and dumps some useful information for further analysis.
3.2 Static Instrumentation
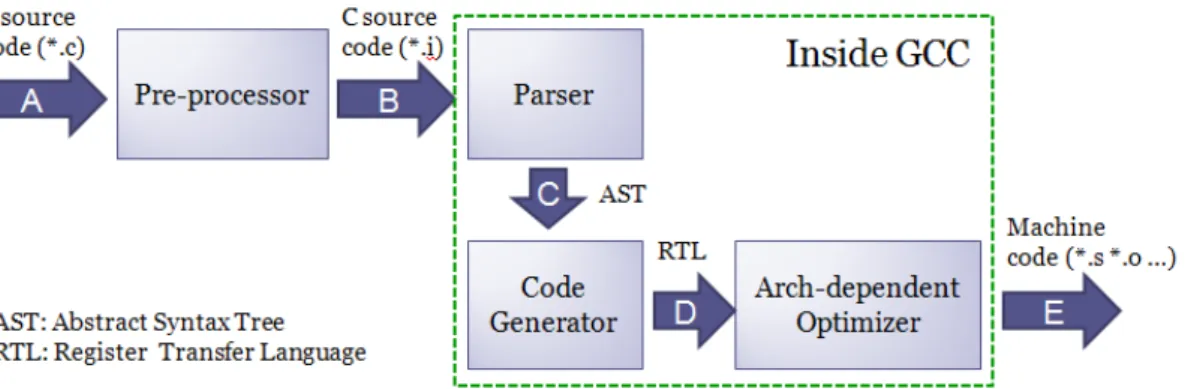
Static Instrumentation discovers copy operations and injects taint propagation tracking codes near these copy operations at compilation time. There are several stages of source code transformation during compilation to offer an opportunity for discovering copy operations. Fig. 5 shows four major compilation phases, pre-processor, parser, code generator, and architecture-dependent optimizer, in GCC [20]. Since we did not want to modify the compiler, discovery at stages C and D inside the compiler was not considered. The preprocessed stage B immediately after the preprocessor phase was finally chosen because source code at this stage has been processed by the preprocessor to yield cleaner source than that at the previous stage, as macros and comments have already been expanded and deleted, respectively. Moreover, at the preprocessed stage, context important for optimization is still present. For example, any variable used in a loop as the increment counter is always untainted so it is not necessary to set taint status repeatedly in each loop body. It is easier to discover such variables in the preprocessed stage than in the machine code stage.
Fig. 5. Major compilation phases of GCC.
Taint data propagation at the preprocessed stage is operated in two ways: undefined function invocations and assignment operations. A function in a program is
either a defined function which is defined within the project and the source code is available or an undefined function which is defined in another library and the source code is unavailable. A defined function can be inserted with taint propagation tracking code, while an undefined function can not be inserted with additional code. Thus we alternatively associate a pre-defined taint propagation behavior to each undefined function. For example, memcpy(void *dest, const void *src, size_t n) is an undefined function that would propagate n byte data from src to dest and no return value. Therefore, we define this propagation behavior by a pseudo code where the three parameters of memcpy are named $1, $2 and $3:
memcpy($1,$2,$3): taint_copy($1,$3,$2)
The subroutine taint_copy provided by Taint Recorder will copy taint status from address $2 to address $1 for length $3. This pre-defined behavior will be concatenated to memcpy. $1, $2 and $3 will be mapped to actual parameters passed to memcpy upon injection.
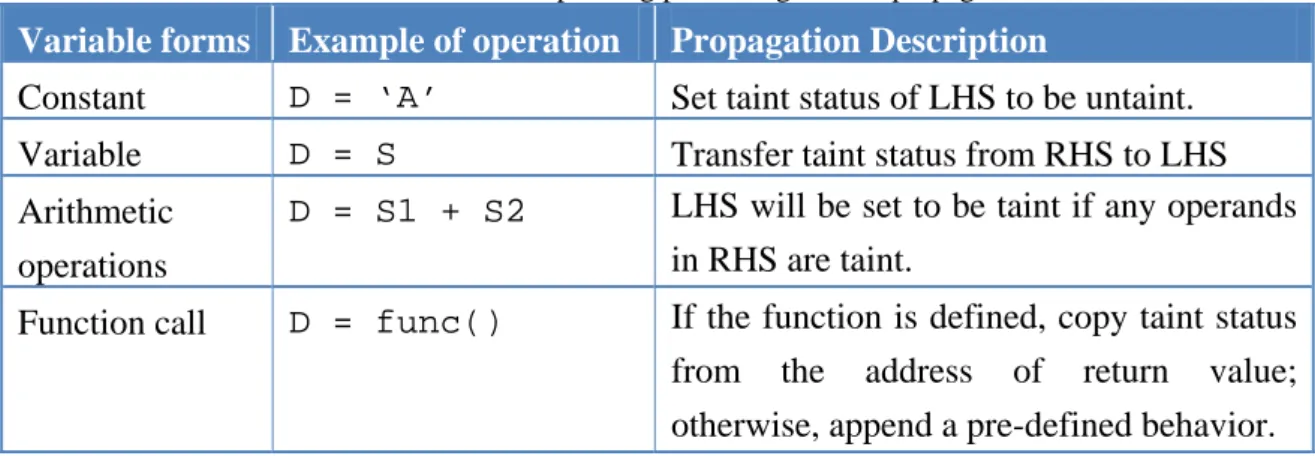
Assignment operations appear with a special identifier '=', and the taint data will propagate from the address of the RHS (right-hand side) operand to the address of the LHS (left-hand side) operand. The address of the LHS operand is retrieved simply with address-of operator '&', but determining the taint status of the RHS operand is complicated because the RHS operand has many forms. Table 3 summarizes common forms of the RHS operand and their corresponding processing of taint propagation. The taint propagation of the first form where the RHS is a constant value sets the taint status of the LHS variable address to false. The second form where the RHS operand is a variable corresponds to copying taint status of the address of the RHS variable to that of the LHS variable. With the third form, the RHS operand is a series of arithmetic operations, and the taint status of the LHS address is set true if any
constituent operand of the RHS operations is taint. The last form features a function call on the RHS. This form of propagation has different processes depending on function type. In case the function is a defined function, the taint status of the LHS variable would be transferred from a global variable that stores the address for return variable in each function; otherwise, a pre-defined behavior for an undefined function would decide the taint status of the LHS variable.
The above covers most processes of taint propagation through assignments. However, an exception transpires when data are propagated via deliberate control transfer. For example, code like if ( x==1 ) y=1; else if ( x== 2) y=2; … uses tainted data x to influence the value of y. This problem is also faced by similar approaches proposed by earlier works. In this case, our system requires users to modify related code manually.
Besides, in order to fix bugs easily, we define a global variable for preserving the instruction pointer and inject code for updating that value before each function invoked. The value can be translated to implicate the function in which the attack had taken place by addr2line, a tool of GNU toolchain that can convert an address into file name and line number in source code.
Table 3. RHS variable forms and their corresponding processing of taint propagation.
Variable forms Example of operation Propagation Description
Constant D = ‘A’ Set taint status of LHS to be untaint.
Variable D = S Transfer taint status from RHS to LHS
Arithmetic operations
D = S1 + S2 LHS will be set to be taint if any operands
in RHS are taint.
Function call D = func() If the function is defined, copy taint status
from the address of return value; otherwise, append a pre-defined behavior.
3.3 Taint Recorder
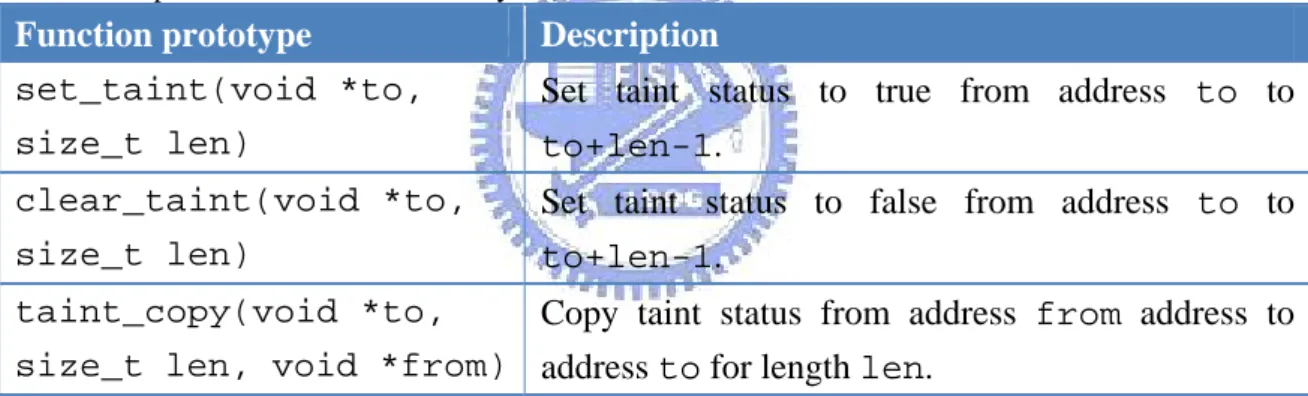
Taint Recorder provides a set of functions and a taint information table for the victim program to record taint memory in its address space. The library exports three basic functions for operating taint information table, summarized in Table 4. set_taint(void *to, size_t len) sets taint status to be true from address to to to+len-1, which is used when reading data from socket, and clear_taint(…) is the opposite function that set taint status of a range of memory to be false. taint_copy(void *to, size_t len, void *from) copies length of len bytes taint status from address from to address to in case copy operations are found in source code.
Table 4. Exported functions in the library of Taint Recorder.
Function prototype Description
set_taint(void *to, size_t len)
Set taint status to true from address to to to+len-1.
clear_taint(void *to, size_t len)
Set taint status to false from address to to to+len-1.
taint_copy(void *to, size_t len, void *from)
Copy taint status from address from address to address to for length len.
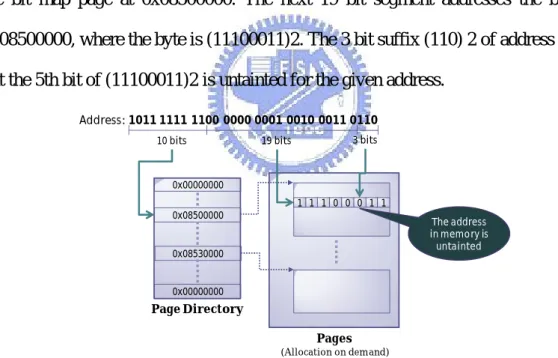
Another component of Taint Recorder, taint information table, records taint status for each memory block. It could be implemented with bitmap data structure mapping each byte of memory to one bit in taint information table. However, bitmap data structure would require an enormous amount of memory; for example, the table requires 4 GB/8=512 MB runtime memory in a 32-bit architecture. Since a program usually only uses a small portion of the entire 4 GB memory space when it is executed, we adopt a page-table-like structure that dynamically allocates a new page when taint propagation happens. Fig. 6 illustrates the page-table-like structure and how to
acquire taint status from an address. The data structure which we call taint information table consists of a page directory and a number of bit map pages. The page directory keeps 1024 32-bit page addresses, so the size required is the same as the default page size 4 KB used in Linux memory management, and the size of a bit map page is 219 Bytes = 512 KB. When we acquire the taint status from an address, the address is split into three parts. The first part includes a 10 bit prefix of the address which is used to look up the corresponding bit map page location in the page directory. The next 19 bit segment addresses the byte in the referred page, and the 3 bit suffix is the bit offset within the referred byte. The example in Fig. 6 shows the procedures of deriving the taint status from an address. The 10 bit prefix of the address is indexed to the bit map page at 0x08500000. The next 19 bit segment addresses the byte in 0x08500000, where the byte is (11100011)2. The 3 bit suffix (110) 2 of address points out the 5th bit of (11100011)2 is untainted for the given address.
Address: 1011 1111 1100 0000 0001 0010 0011 0110 0x00000000 0x08500000 10 bits 19 bits Page Directory 0x08530000 0x00000000 Pages (Allocation on demand) 1 1 1 0 0 0 1 1 3 bits The address in memory is untainted
Fig. 6. Obtain an taint status via page information table..
3.4 Exploit Inspector
Exploit Inspector is a kernel component used to examine whether a program is executing code from a piece of tracked taint data. It consists of a checking subroutine and a cache of page directories for different processes to decrease the frequency of communication between user space and kernel space. The checking subroutine would
be triggered to examine whether the instruction pointer (IP) of user space points to taint data, after a system call is invoked and the system control flow gets into the system call entry point for reserving user-space execution environment and parameter verification. The checking subroutine acquires the taint status of IP in user-space, as described in Fig. 6. To decrease the communication overhead between user space and kernel space, the page directories accessed by IP are cached in the kernel for consequent use. If the checking subroutine determines the pointed address is innocent, the system call will be ordinarily invoked; otherwise, the subroutine will terminate the process and dump process status for analysis and defense as the memory near the value of IP may be populated by the execution code of the exploit. If the execution code can be isolated, it can be used in IPS as signature of the attack.
The implementation of Exploit Inspector requires a communication channel between user and kernel spaces and an instruction pointer retrieval mechanism which greatly depends on machine architecture and operation system. We implemented this system on IA-32 architecture with Linux kernel 2.6.22-9. The communication channel between user and kernel spaces adopts pseudo-filesystem /proc [21] and kernel API copy_from_user(…) [22]. Retrieving instruction pointer is complicated and needs a series of modifications on kernel. When Linux switched from user mode to kernel mode, extended instruction pointer (EIP) register and other registers which relate execution status would be pushed automatically to stack. In order to access these registers correctly, kernel defines a constant offset for each register; for example, it defines PT_EIP for register EIP at line 78 in arch/i386/kernel/asm-offset.c, as shown in Fig. 7. The entry point of a system call on Linux is located at line 376 in arch/i386/kernel/entry.S. We added two lines following syscall_call label that copy user-space EIP into thread structure thread_info, and we can access user-space EIP at our checking
subroutine. The codes we added in kernel are summarized in Fig. 7, Fig. 8 and Fig. 9.
File: arch/i386/kernel/asm-offsets.c
[ADD] 59 OFFSET(TI_user_eip, thread_info, user_eip); …………
78 OFFSET(PT_EIP, pt_regs, eip); …………
Fig. 7. Constant offset for variable user_eip of thread_info structure and register EIP.
File: arch/i386/kernel/entry.S
376 syscall_call:
[ADD] 377 movl PT_EIP(%esp), %ecx [ADD] 378 movl %ecx,TI_user_eip(%ebp) Fig. 8. Store EIP of user space into thread_info structure.
File: include/asm-i386/thread_info.h
27 struct thread_info { ………
[ADD] 47 unsigned long user_eip; Fig. 9. Add a new variable user_eip in thread_info structure.
Chapter 4 Experimental Evaluation
Embedded TaintTracker is evaluated on effectiveness and performance. In effectiveness evaluation, we reproduced a return address smashing attack against a vulnerable echo server. For the performance evaluation, we took the most widely used web server, Apache, as the testing target and evaluated the impact on latency, throughput and the sustainable number of requests per second.
4.1 Effectiveness
A buffer overflow attack has to first inject malicious code into victim’s memory space and then corrupt code pointers of different types including return address, function pointer, longjmp buffer and GOT. Many solutions for buffer overflow defense were proposed to prohibit code pointer corruption, so their effectiveness should be evaluated for the enumerated code pointer types. However, our system, based on taint tracking technique, does not prevent code pointer corruption but avoid malicious code execution since any type of corrupt code pointers is finally targeted to execute malicious code. Thus we only need to verify whether it blocks malicious code execution to demonstrate that it is able to defend against buffer overflow attacks.
Our test program was an echo server [23] with a synthetic vulnerability that copies the string received from the client into local buffer without bound checking, and sends it back to client. The vulnerability is exploited when the copied string exceeds the size of the local buffer to inject malicious code and overflow return address, where the malicious code adds a new account for the attacker. Fig. 10 shows the system log after the attack was lunched. As shown in the figure, Embedded TaintTracker successfully identified the attack and logged what and where the system
call was invoked. Besides, the log also recorded the value of instruction pointer to the last function invoked for bug fixing and dumped the memory near the address of system call invocation for signature generation.
Attack Identification
Bug Fixing Signature Generation
Fig. 10. The log from Embedded TaintTracker after detecting an attack.
4.2 Performance
We measured the performance degradation of Embedded TaintTracker on an Apache web server [24] which is the most widely used server on the Web [25]. There are three key criteria for performance evaluation including latency, throughput and sustainable number of requests per second. Our evaluation was performed on a system with an Intel Core 2 Duo T5600 (1.86 GHz) CPU and 2 GB of RAM, running Ubuntu 7.10 on Linux kernel 2.6.22.
In order to compare with previous work, TaintCheck, and profile the source of overhead, we additionally measured the performance of Apache with the kernel component of Embedded TaintTracker, Valgrind Nullgrind [26] and MemCheck [27], denoted as Embedded TaintTracker - Kernel, Nullgrind, and Memcheck, respectively, in Fig. 11. The kernel component of Embedded TaintTracker is used to measure the performance overhead when the mechanism that examination of execution on taint data is alone enabled. Nullgrind and Memcheck, like TaintCheck, are extensions of
the emulator Valgrind. These extensions have diverse degrees of instrumentation that can represent two primary sources of overhead from TaintCheck. Nullgrind does not instrument any additional instructions, implying that the extra execution time is caused by the emulator Valgrind itself. MemCheck is a substitute for TaintCheck since the source code of TaintCheck is unavailable. MemCheck looks for memory leak and illegal memory access by means of the same data structure as TaintCheck to trace the status of memory and instrumentation on all memory operations. Its performance is better than TaintCheck because TaintCheck requires extra interception of each jump-instruction, and the author of TaintCheck also had demonstrated that the performance of TaintCheck is worse than that of MemCheck [6].
In the evaluation of latency, we requested different size of web pages from 1 KB to 10 MB, and timed how long it took to connect, send the request, receive the response, and disconnect to server. In order to prevent resource contention in the test bed, the server was connected to another machine running the testing program. The testing program was executed five rounds, and for each round, we requested the same page 60 times. The result is the average median in each testing round.
0.5 1.0 1.5 2.0 2.5 3.0 3.5 4.0 4.5 5.0 1KB (1.32 ms) 10KB (2.20 ms) 100KB (10.12 ms) 1MB (88.18 ms) 10MB (882.25 ms) La te n cy (Slow d o w n fa ct o r) Web page size (Native latency) (a) Embedded TaintTracker ‐ Kernel Embedded TaintTracker Nullgrind Memcheck 0 20 40 60 80 100 120 20 (112.08) 40 (125.98) 60 (138.94) 80 (133.70) De gr ad at io n on Re q /S e c #Clients (Native req/sec) (c) 0 100 200 300 400 500 600 700 20 (685.74) 40 (755.75) 60 (828.64) 80 (828.54) D e gr ad at io n on T hr o ug h put (KB /S e c) #Clients (Native throughput) (b)
Fig. 11. Experimental result of performance evaluation: a) latency in different page sizes requested, and Y-axis is the slowdown factor which is latency of mechanism-enabled divided by native execution time; b) and c) are degradation on throughput and requests per second for different numbers of clients. The native results are listed below X-axis with parentheses.
Fig. 11 (a) shows the result of latency with a slowdown factor which is execution time of measured target divided by execution time of Apache. The slowdown factor decreases as the size of the request grows because the server becomes less CPU-bound and more I/O bound. Embedded TaintTracker generates a 1.37 slowdown in case that 1 KB page is requested and almost no overhead when the size of the accessed page exceeds 100 KB. The performance of MemCheck is much worse than our system especially when the page size is less than 100 KB.
The throughput and sustainable number of requests per second for different numbers of clients were evaluated with WebBench, as shown in Fig. 11 (b) and (c). On average, our system imposes only 9.3% (73.48 KB/sec) performance degradation which outperforms, by eight folds, the 75.2% (592.08 KB/sec) performance degradation caused by MemCheck. Running Apache under Valgrind
already brings a great overhead of 60% (358.78 KB/sec) in the degradation of MemCheck. Dynamic instrumentation of all memory access operations and memory information maintenance contributes the remaining 40% (233.3 KB/sec) overhead, which would increase in proportion to the number of instrumented operations and result in the overhead of TaintCheck to be more acute. For example, when there are twenty clients, memory access and jump represent 31% and 8% of operations respectively. TaintCheck would impose extra overhead from instrumentation of the additional 8% jump operations for checking malicious execution.
Fig. 11 also shows that the kernel component of Embedded TaintTracker influences slightly performance, meaning that the major overhead of our system is not from the examination of execution on taint data but from maintenance of taint information. Thus we further profiled time consumed in subroutines for maintaining taint information table. When 1 KB pages are requested 1000 times, 61% of the extra time is spent on the bit-copy subroutine which is used to copy taint status from one bit to another, and another 36% is spent on address translation for page tables. The overheads from these subroutines may be reduced as we designed them to reduce performance overhead rather than memory usage. For example, the time for address translation can be diminished by changing the structure of taint information table to bitmap.
Chapter 5 Conclusions and Future Works
In this article, we proposed Embedded TaintTracker, a lightweight taint-style system to defend against buffer overflow attacks. It is able to protect against various forms of buffer overflow attacks and achieves acceptable performance. We analyzed performance overhead of previous method and found that there are 60% of overhead from emulator and 40% from dynamic instrumentation and taint information maintenance. Our system successfully diminished these two main sources of performance overhead by compressing the emulator mechanism into kernel and moving instrumentation from runtime to compilation time. The evaluation demonstrated that our system only imposed 9.3% performance degradation, which outperforms TaintCheck by at least 8 times.
Embedded TaintTracker is able to dump system and program status to provide logs for helping developers in analyzing the attack and generating attack signature. We currently dumped a section of memory as a possible piece of attack code. However, if the section of memory is used as the signature of an attack for an IPS, we should analyze which part of the memory represents the attack and refine it. A future extension of this work is to automate and integrate it with an IPS, so that the attack may be temporarily filtered out until the vulnerability is patched.
References
[1] H. Orman, “The Morris worm: A fifteen-year perspective,” IEEE Security Privacy, vol. 1, pp. 35-43, Sept. Oct. 2003.
[2] US-CERT vulnerability notes databases, http://www.kb.cert.org/vuls/. [3] Crispin Cowan, Perry Wagle, Calton Pu, Steve Beattie and Jonathan
Walpole, "Buffer Overflows: Attacks and Defenses for the Vulnerability of the Decade," DARPA Information Survivability Conference and Exposition. Hilton Head Island, SC, 2000.
[4] How to hijack the Global Offset Table with pointers for root shells,
http://www.infosecwriters.com/text_resources/pdf/GOT_Hijack.pdf
[5] G. Ramalingam, “The Undecidability of Aliasing,” ACM Trans. Programming Languages and Systems, vol.16, no. 5, pages 1467–1471, 1994
[6] J. Newsome and D. Song, “Dynamic taint analysis for automatic detection, analysis, and signature generation of exploits on commodity software,” 12th Network and Distributed System Security Symposium, 2005.
[7] W. Cheng, Q. Zhao, B. Yu and S. Hiroshige, “TaintTrace: Efficient Flow Tracing with Dynamic Binary Rewriting,” 11th IEEE Symposium on Computers and Communications (ISCC'06), pages 749-754, June 2006. [8] B. Chess and J. West, "Secure Programming with Static Analysis,"
Addison Wesley, 2007.
[9] D. Wagner, J. S. Foster, E. A. Brewer, and A. Aiken, “A First Step towards Automated Detection of Buffer overrun Vulnerabilities,” The Network and Distributed System Security Symposium, San Diego, CA, Feb. 2000, pp. 3–17.
[10] D. Evans and D. Larochelle, “Improving security using extensible lightweight static analysis,” IEEE Software, 19(1): 42-51, Jan 2002.
[11] D. Evans, J. Guttag, J. Horning, and Y. M. Tan, “LCLint: A tool for using specifications to check code,” 2nd ACM SIGSOFT Symposium on the Foundations of Software Engineering (FSE), pages 87–96, Dec 1994. [12] G. C. Necula, S. McPeak, and W. Weimer, “CCured: Typesafe retrofitting
of legacy code,” 29th ACM SIGPLAN-SIGACT Symposium on Principles of Programming Languages (POPL), pages 128–139, Jan 2002. [13] O. Ruwase and M. S. Lam, “A practical dynamic buffer overflow detector,” 11th Annual Network and Distributed System Security Symposium (NDSS), pages 159–169, Feb 2004.
[14] C. Cowan, C. Pu, D. Maier, J. Walpole, P. Bakke, S. Beattie, A. Grier, P. Wagle, Q. Zhang, and H. Hinton, “Stack-Guard: Automatic adaptive detection and prevention of buffer-overflow attacks,” 7th USENIX Security Symposium, pages 63–78, Jan 1998.
[15] K. Avijit, P. Gupta, and D. Gupta. Tied, “LibsafePlus: Tools for runtime buffer overflow protection,” USENIX Security Symposium, August 2004. [16] C. Cowan, S. Beattie, J. Johansen, and P.Wagle, “PointGuard: Protecting
pointers from buffer overflow vulnerabilities,” 12th USENIX Security Symposium, pages 91–104, Aug 2003.
[17] R. W. M. Jones and P. H. J. Kelly, “Backwards compatible bounds checking for arrays and pointers in C programs,” International Workshop on Automated and Algorithmic Debugging, pages 13–26, 1997.
[18] Valgrind, http://valgrind.org/
[19] DynamoRIO, http://www.cag.lcs.mit.edu/dynamorio/
[20] GNU C Compiler Internals/GCC 4.1,
http://en.wikibooks.org/wiki/GNU_C_Compiler_Internals/GCC_4.1 [21] proc(5) - Linux man page, http://linux.die.net/man/5/proc
[22] The Linux Kernel API,
http://www.gnugeneration.com/books/linux/2.6.20/kernel-api/
[23] Simple TCP/IP echo server,
http://www.paulgriffiths.net/program/c/echoserv.php
[24] Apache, http://httpd.apache.org/
[25] Web Server Survey,
http://news.netcraft.com/archives/2008/04/14/april_2008_web_server_sur vey.html
[26] Nulgrind User Manual, http://valgrind.org/docs/manual/nl-manual.html
[27] Memcheck User Manual,