行政院國家科學委員會專題研究計畫 成果報告
震動夯實造成之土壤應力及密度變化(III)
研究成果報告(精簡版)
計 畫 類 別 : 個別型 計 畫 編 號 : NSC 99-2221-E-009-105- 執 行 期 間 : 99 年 08 月 01 日至 100 年 07 月 31 日 執 行 單 位 : 國立交通大學土木工程學系(所) 計 畫 主 持 人 : 方永壽 計畫參與人員: 碩士級-專任助理人員:黃亭淵 碩士班研究生-兼任助理人員:陳冠宇 碩士班研究生-兼任助理人員:黃閔邑 報 告 附 件 : 出席國際會議研究心得報告及發表論文 處 理 方 式 : 本計畫可公開查詢中 華 民 國 100 年 10 月 26 日
行政院國家科學委員會
補助專題研究計畫
成果報告
震動夯實造成之土壤應力及密度變化 (III)
計畫類別:■ 個別型計畫 □ 整合型計畫
計畫編號:NSC 99-2221-E-009-105-
執行期間:99 年 08 月 01 日至 100 年 07 月 31 日
計畫主持人:
方永壽 教授
計畫參與人員: 陳冠宇 黃閔邑 黃亭淵 碩士班研究生
成果報告類型(依經費核定清單規定繳交):□精簡報告 ■完整報告
本成果報告包括以下應繳交之附件:
□赴國外出差或研習心得報告一份
□赴大陸地區出差或研習心得報告一份
■出席國際學術會議心得報告及發表之論文各一份
□國際合作研究計畫國外研究報告書一份
處理方式:除產學合作研究計畫、提升產業技術及人才培育研究計
畫、列管計畫及下列情形者外,得立即公開查詢
□涉及專利或其他智慧財產權,□一年□二年後可公開查詢
執行單位: 國立交通大學土木工程學系
中 華 民 國 100 年 8 月 1 日
震動夯實造成之土壤應力及密度變化 (III)
摘要
本報告以實驗方法探討振動夯實造成之土壓力及其應力路徑的變化。本研究以氣 乾之渥太華砂為回填土,分五層填土並且分層夯實。夯實土層為每層0.3 m,總 高度為1.5 m。回填土初始相對密度為 34.2 %,夯實後的相對密度為 73.8 %。為 了在實驗室模擬雙向平面應變的情況,本研究採用塑膠膜潤滑層來降低砂土和填 砂槽側牆間的摩擦力。本研究進行一系列實驗,探討振動夯實對砂土所產生的影 響。這些影響包括夯實過程造成之土壤應力變化及其動態應力路徑。根據實驗結 果,本研究獲得以下幾項結論: 1. 於疏鬆砂土,土體內的垂直土壓力和水平土壓力可分別以v 和 Jaky 公z 式來進行合理的估算。 2. 隨著夯實機逐漸接近土壓力計,測得之應力變化愈加明顯;在靠近擋土牆處 夯實時,牆面土壓力計測得的應力變化最大。 隨著覆土深度逐漸升高,深層 土壓力計測得夯實造成之應力變化較不顯著。 3. 比較各土層測得之應力路徑發現,夯實造成應力路徑的大小相似,應力路徑 軌跡如同彗星狀。動態應力路徑都介於Ko線及Kp線之間。 4. 相較於 Broms 在 1971 提出之加載-解載應力路徑,本實驗量測出的應力路徑 軌跡與Broms 的應力路徑軌跡有很大的差異。Broms 所提出的應力路徑是在 土體上方加載一個靜態且不會振動的壓路機,而本實驗是施加一個重量較輕 且具三方向振動力的夯實機。造成差異之原因,可能是因為夯實機不只有垂 直方向的施力,且造成平行牆面的水平力、及與牆表面垂直的水平力,這三 個方向的動態作用力造成彗星形狀的應力軌跡。 關鍵字: 砂土、模型試驗、夯實、應力路徑、土壓力CHANGE OF SOIL STRESS AND DENSITY DUE TO
VIBRATORY COMPACTION (III)
Abstract
This report presents experimental data on the variation of earth pressure and dynamic stress path against a non-yielding retaining wall due to vibratory compaction. The instrumented non-yielding wall facility at National Chiao Tung University was used to investigate the effects of vibratory compaction on the change of dynamic stress in the soil mass. Air-dry Ottawa sand was plated in five lifts and the height of backfill was 1.5 m. The initial relative density of the backfill was 34.2 %, and the compacted relative density of the backfill was 73.8 %. To simulate a plane strain condition in the laboratory, the friction between the soil and sidewalls of the soil bin was reduced with a lubrication layer. The variation of dynamic stresses was measured during compaction with a vibratory compactor. Based on the test results, the following conclusions were drawn.
1. For a loose backfill, the horizontal earth pressure in the soil mass was in good agreement with Jaky’s solutions. The vertical earth pressure in soil was near to the equationv . z
2. As the compactor approached the soil pressure transducer in x-direction (perpendicular to the wall face), the dynamic stress became more obvious when the compactor moved to the lane near the wall. For a transducer at a lower elevation, when the area of compaction rose with the elevation of the lift surface, the compaction-induced stress path became less significant.
3. The dynamic stress path of a soil element under vibratory compaction had the shape of a comet. The shape and size of the dynamic stress paths obtained at five different lifts was quite similar. The stress paths were bounded by the at-rest K0-line and passive Kp-line.
4. The measured dynamic stress path was quite different from the stress path proposed by Broms in 1971. The stress path reported by Broms was induced by a static heavy compactor. The vibratory compactor used in this study vibrated and generated cyclic forces in three direction. This was probably the main reason why the dynamic stress path due to vibratory compaction was different from Broms’ finding.
TABLE OF CONTENTS
摘要... 2 ABSTRACT... 3 TABLE OF CONTENTS... 4 1. INTRODUCTION... 5 2. LITERATURE REVIEW... 6 3. EXPERIMENTAL APPARATUS ... 113.1 Model Retaining wall... 11
3.2 Soil bin... 11
3.3 Data Acquisition System... 12
3.4 Vibratory Compactor ... 12
4. BACKFILL AND INTERFACE CHARACTERISTICS ... 16
4.1 Backfill Properties ... 16
4.2 Reduction of Wall Friction... 16
5. TEST RESULTS ... 22
5.1 Stress in Loose Sand ... 22
5.2 Vertical and Horizontal Stresses in Sand during Compaction ... 22
5.3 Stress Paths for Filling and Compaction of Backfill ... 23
5.4 Dynamic Stress Paths during Compaction... 23
5.4.1 Compaction Approaching SPT in x-direction... 24
5.4.2 Compaction Passing SPT in y-direction ... 24
5.4.3 Compaction Rising in z-direction ... 24
5.5 Compaction among Lifts and Tests... 24
5.6 Comparison of Theoretical and Experimental Stress Paths ... 24
6. CONCLUSIONS ... 39
7. REFERENCES... 40
1. INTRODUCTION
In the construction of highway embankments, earth dams, and many other engineering structures, engineers will compact loose soils to improve its engineering properties, such as increasing the fill bearing capacity and reducing settlement. In various compaction methods, vibratory compactions are used mostly for the densification of granular soils. Figure 1 illustrates the vibratory compactor used for this study. Chen and Fang (2008) reported that the increase of horizontal pressure was more significant than the increase of vertical pressure due to compaction. In this study, the dynamic stress path was measured and compared to the theoretical stress path. To analyze the residual lateral earth pressure induced by soil compaction, several methods of analysis have been proposed by Broms (1971), Duncan and Seed (1986), Peck and Mesri (1987) and other researchers. However, little information regarding the dynamic stress variation during compaction in the fill was reported. To gain a better understanding of the topic mentioned above, experiments were conducted with the National Chiao Tung University (NCTU) model wall facility. This paper presents experimental data associated with the horizontal and vertical stresses action on the non-yielding wall during soil compaction.
2. LITERATURE REVIEW
Mesri and Hayat (1993) reported that Jaky (1944) established a relationship between Ko and maximum effective angle of internal friction ' by analyzing a talus of granular
soil freestanding at the angle of repose. Jaky (1944) supposed that the angle of repose is analogous to the angle of internal friction . This is reasonable for a sedimentary, normally consolidated material. Jaky (1944) reasoned that the sand cone OAD in Fig. 2a is in a state of equilibrium and its surface and inner points are motionless. The horizontal pressure acting on the vertical plane OC is the earth pressure at-rest. Slide planes exist in the inclined sand mass. However, as OC is a line of symmetry, shear stresses can not develop on it. Hence OC is a principal stress trajectory. Based on the equations of equilibrium, Jaky expressed the coefficient of earth pressure at-rest Ko
with the angle of internal friction,
sin 1 sin 3 2 1 ) sin 1 ( o K (1)
In 1948, Jaky presented a modified simple expression given by Eq. (2):
Ko 1sin (2)
Duncan and Seed (1986) presented an analytical procedure for evaluation of peak and residual compaction-induced stresses either in the free field or adjacent to vertical, non-deflecting soil-structure interfaces. This procedure employs a hysteretic Ko
-loading model shown in Fig. 2b.The model is adapted to incremental analytical method for the evaluation of peak and residual earth pressures resulting from the placement and compaction of soil. When the surcharge is applied on the soil surface, it will increase the vertical stress and the horizontal stress. In Fig. 2b, as the virgin loading is applied on the soil, both v and h increase along the Ko -line (Ko =
1-sin). Nevertheless, when the surcharge is removed, v and h would decrease
along the virgin unloading path. As virgin reloading was applied again, the increment of earth pressure is less than that induced by the first virgin loading.
The hysteretic model may be applied to the analysis of compaction as represented by a transient, moving surface load of finite lateral extent by directly modeling
loading due to increased overburden as an increase in vertical effective stress (’v). To
model compaction loading in terms of the peak virgin, compaction-induced horizontal stress increase (’h,vc,p) is defined as the horizontal effective stress which would be
induced by the most critical positioning of the compactor. The ’h,vc,p could be
evaluated by the simple elastic analysis if the soil had been previous uncompacted (if the soil had no “lock-in” residual stresses due to previous compaction). While the hysteretic model is applied to the analysis of compaction loading cycle, the ’h,vc,p
should be transformed to an equivalent peak vertical load increment (’v,e,p)
calculated as o p vc h p e v K ' , , ' , , (3) It is important to note the peak compaction loading must be based on directly calculated lateral stress increase rather than directly calculated peak vertical stress increase multiplied by Ko, Ka or some other coefficient. Seed and Duncan (1983)
concluded that either in the free field, or at or near vertical, non-deflecting
soil/structure interfaces, ’h,vc,p resulting from surface compaction loading can be
calculated directly by simple elastic analysis. The parameter of Poisson’s ratio, for surface compaction loading may be chosen according to the empirically derived relationship (0.5 ) 2 1 o o (4) where o o o K K 1 Ko = 1-sin
Chen and Fang (2008) reported some experiments in non-yielding retaining wall at National Chiao Tung University to investigate influence of earth pressure due to vibratory compaction. Air-dry Ottawa sand was used as backfill material. Vertical and horizontal stresses in the soil mass were measured in loose sand and compacted sand. Based on his test results, Chen and Fang (2008) proposed the following conclusions: (1) after compaction, the lateral stress measured near the top of backfill is almost
identical to the passive earth pressure estimated with Rankine theory. The compaction-influenced zone rises with rising compaction surface. Below the compaction-influenced zone, the horizontal stresses converge to the earth pressure at-rest, as indicated in Fig. 3 and Fig. 4;
(2) when total (static + dynamic) loading due to the vibratory compacting equipment exceeds the bearing capacity of foundation soils, the mechanism of vibratory
foundation soils;
(3) the vibratory compaction on top of the backfill transmits elastic waves through soil elements continuously. For soils below the compaction-influenced zone, soil particles are vibrated. The passive state of stress among particles is disturbed. The horizontal stresses among soil particles readjust under the application of a uniform overburden pressure and constrained lateral deformation, and eventually converge to the at-rest state of stress.
Fig. 2a. Jaky’s formulation of the relationship between Ko on OC and mobilized in
OAB (after Mesri and Hayat, 1993)
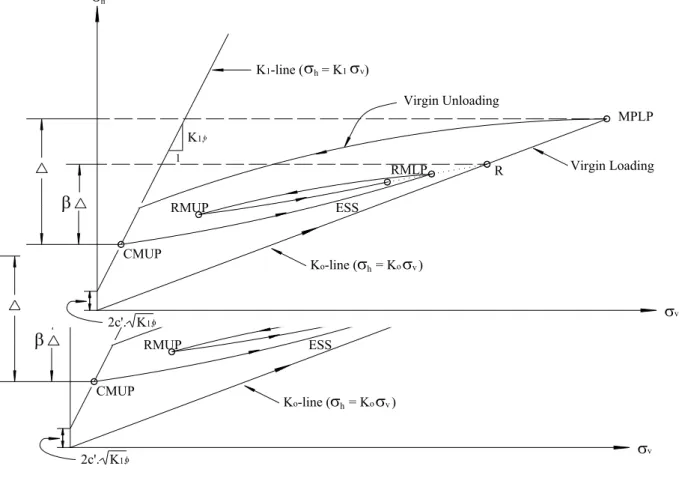
Fig. 2b. Basic components of hysteretic Ko-loading/unloading model (after Duncan
Principal Stress Trajectories
90-45+ 2 A B C D O z z r r z Parabolic Interpolation of between OB and OC O O MPLP R RMUP RMLP ESS CMUP 1 Virgin Unloading Virgin Loading h 2c'. K1, v Ko-line (h = Ko v ) K1-line ( h = K1 v) K1, MPLP R RMUP RMLP ESS CMUP 1 Virgin Unloading Virgin Loading h 2c'. K1, v Ko-line (h = Ko v ) K1-line ( h = K1 v) K1,
Horizontal Earth Pressure, h (kN/m2)
Fig. 3. Distribution of horizontal earth pressure after compaction (after Chen and Fang, 2008)
Fig. 4. Stress path of a soil element under compaction (after Chen and Fang, 2008)
0 5 10 15 0 0.3 0.6 0.9 1.2 1.5 E levat io n ( m ) Rankine (Passive) Jaky Compacted Sand Test C0903 Test C1141 0 5 10 15
Rankine (Passive)
Jaky Test C0903 Test C1141 0 5 10 15 Rankine (Passive) Ja ky Test C0903 Test C1141 0 5 10 15 Rankine (Passive) Ja ky Compaction-Influenced Zone Test C0903 Test C1141 h,ci 0 5 10 15
Rankine (Passive)
Ja ky
Test C0903 Test C1141
0 5 10 15 20 25 30
Vertical Earth Pressure, v (kN/m2)
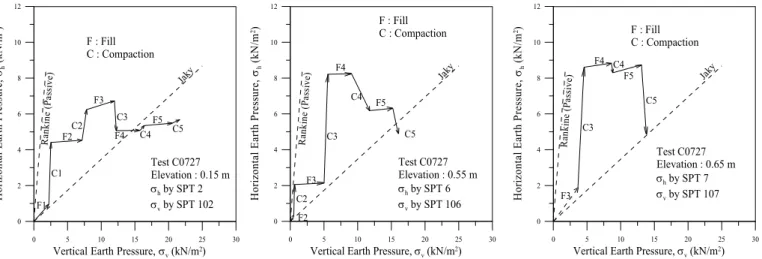
0 2 4 6 8 10 12 H ori zont al E ar th Pr es sur e, h (k N /m 2) F : Fill C : Compaction Test C0727 Elevation : 0.15 m h by SPT 2 v by SPT 102 Jaky R anki ne ( Pass iv e) C1 F1 C2 F2 C3 F3 C4 F4 C5 F5 0 5 10 15 20 25 30
Vertical Earth Pressure, v (kN/m2)
0 2 4 6 8 10 12 H oriz on ta l E arth P re ssu re , h (k N /m 2) F : FillC : Compaction Jaky R anki ne ( Pass iv e) C2 C3 F3 C4 F4 C5 F5 Test C0727 Elevation : 0.55 m h by SPT 6 v by SPT 106 F2 0 5 10 15 20 25 30
Vertical Earth Pressure, v (kN/m2)
0 2 4 6 8 10 12 H oriz on ta l E arth P re ssu re , h (k N /m 2) F : Fill C : Compaction Jaky R anki ne (Pa ss ive) C3 C4 F4 C5 F5 Test C0727 Elevation : 0.65 m h by SPT 7 v by SPT 107 F3
3. EXPERIMENTAL APPARATUS
To investigate the effects of vibratory compaction on the vertical stress σv and
horizontal stress σh in a cohesionless soil mass, the instrumented non-yielding model
retaining wall facility at National Chiao Tung University (NCTU) was used. This section introduced the NCTU non-yielding retaining wall facility and the vibratory compactor. Chen and Fang (2008) described the facility consist of three components: (1) model retaining wall; (2) soil bin; and (3) data acquisition system. The details of the foregoing apparatuses are described in the following sections.
3.1 Model Retaining Wall
The model wall shown in Fig. 5 is 1,500 mm-wide, 1,600 mm-high, and 45 mm-thick. To achieve an at-rest condition, the wall material should be nearly rigid. It is hoped that the deformation of the model wall could be neglected with the application of earth pressure. As indicated in Fig. 5, twenty-four 20 mm-thick steel columns were welded to the four sidewalls to reduce any lateral deformation during loading. In addition, twelve C-shaped steel beams were also welded horizontally around the box to further increase the stiffness of the box.
3.2 Soil Bin
To simulate a plane strain condition for model test, the soil bin is designed to minimize the lateral deflection of sidewalls. In Fig. 5, the soil bin was fabricated of steel plates with inside dimensions of 1,500 mm ×1,500 mm ×1,600 mm.
Assuming a 1,500 mm-thick cohesionless backfill with a unit weight 17.1 kN/m3, and an internal friction angle 41o
was pluviated into the soil bin. A 45 mm-thick solid steel plate with a Young’s modulus of 210 GPa was chosen as the wall material. The
estimated deflection of the model wall would be only 1.22 × 10⁻³ mm. Therefore, it can be concluded that the lateral movement of the model wall is negligible and an at-rest condition can be achieved.
The end-wall and sidewalls of the soil bin were made of 35 mm-thick steel plates. Outside the steel walls, vertical steel columns and horizontal steel beams were welded to increase the stiffness of the end-wall and sidewalls. If the soil bin was filled with dense sand, the estimated maximum deflection of the sidewall would be 1.86 × 10⁻³ mm. From a practical point of view, the deflection of the four walls around the soil bin can be neglected.
soil pressure transducers (Kyowa BE-2KCM17, capacity = 98.1 kN/m2) were arranged behind the model wall. The transducers were used to measure the variation of vertical earth pressure σv during the filling and compaction process. The soil
pressure transducer buried in the backfill is shown in Fig. 6. The diameter of the SPT sensing area is 22 mm.
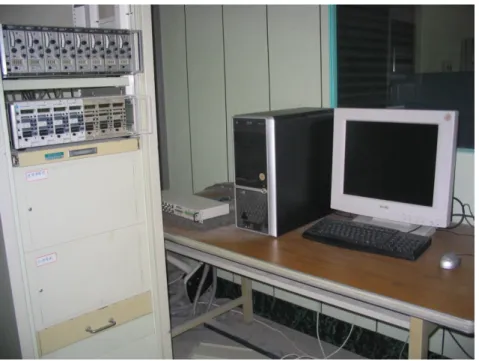
3.3. Data Acquisition System
A data acquisition system was used to collect and store the considerable amount of data generated during the tests. In the Fig. 7, the data acquisition system is composed of the following four parts: (1) dynamic strain amplifiers (Kyowa: DPM601A and DPM711B); (2) AD/DA card (NI BNC-2090); and (3) Personal Computer. The analog signals from the sensors were filtered and amplified by the dynamic strain amplifiers. Then, the analog experimental data were digitized by an A/D-D/A card. The digital signals were then transmitted to the personal computer for storage and analysis.
3.4. Vibratory Compactor
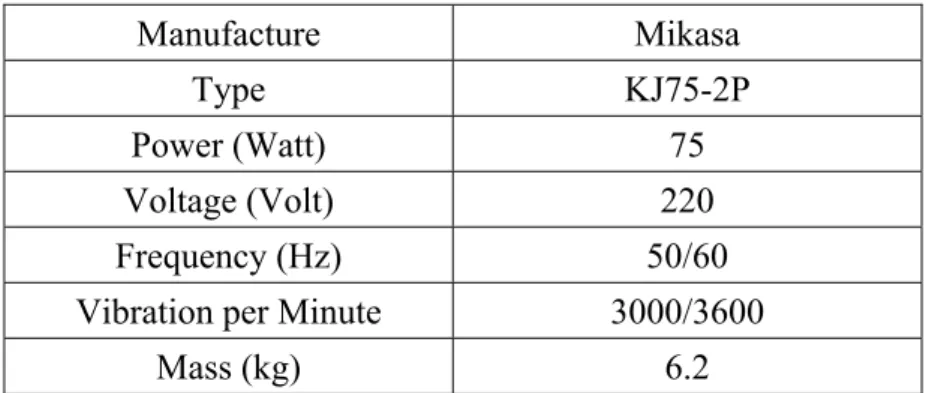
To simulate compaction of backfill in the field, the vibratory compactor shown in Fig. 8 and Fig. 9 was made by attaching an eccentric motor (Mikasa Sangyo, KJ75-2P) to a 225 mm ×225 mm steel plate. The mass of the vibratory compactor is 12.1 kg. The eccentric force can be controlled by adjusting the number of eccentric steel plates attached to the rotating shaft of motor. For this study, a total of sixteen eccentric plates (8+8) were used. The technical information regarding the eccentric motor is listed in
Table 1. It should be mentioned that the distribution of contact pressure between the foundation and soil varies with the stiffness of the footing. If the footing is perfectly rigid, the static contact pressure on the footing increases from zero at the edge to a maximum at the center.
Fig.5. NCTU non-yielding retaining-wall facility (after Chen and Fang, 2008) 16 00
Unit : mm
1500 1500 End 45 20 SidewallSteel Base Plate Steel Column Wall
Footboard
Model Wall
SPT
Fig. 7. Data acquisition system
Fig. 8. Side-view of vibratory soil compactor (after Chen, 2002)
Handle Switch Extension Cord 15 48 225 48 360 40 10 27 20 1000 (5 m-Long) Unit : mm Eccentric Motor
Fig. 9. Vibratory soil compactor (after Chen, 2002)
Table 1. Technical information of the eccentric motor
Manufacture Mikasa Type KJ75-2P Power (Watt) 75
Voltage (Volt) 220 Frequency (Hz) 50/60 Vibration per Minute 3000/3600
4. BACKFILL AND INTERFACE CHARACTERISTICS
4.1. Backfill Properties
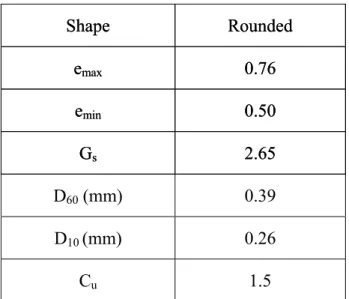
Air-dry Ottawa silica sand (ASTM C-778) was used as the backfill material in all experiments. Physical properties of the soil were summarized in Table 2. Grain-size distribution of the backfill is shown in Fig. 10.
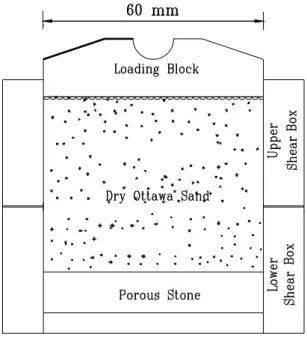
To establish the relationship between unit weight of backfill and its internal friction angle , direct shear tests have been conducted. The shear box used has a square (60 mm × 60 mm) cross-section, and its testing arrangement is shown in Fig. 11. Before shearing, Ottawa sand was pluviated into the shear box and then
compacted to the desired density.
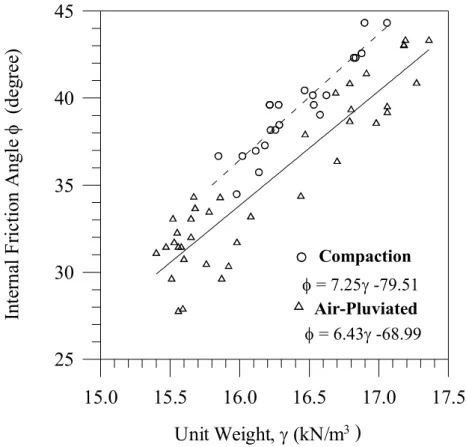
Chang (2000) established the relationship between the internal friction angle and unit weight of Ottawa sand as shown in Fig. 12. It is obvious in the figure that soil strength increases with increasing soil density. For the air-pluviated backfill, the empirical relationship between soil unit weight and angle can be formulated as follows:
= 6.43γ - 68.99 (5) where
= angle of internal friction of soil (degree)
= unit weight of soil (kN/m3)
Eq. (5) is applicable for γ= 15.45 ~ 17.4 kN/m3 only.
4.2. Reduction of Wall Friction
To constitute a plane strain condition for model wall tests, the shear stress between the backfill and the side walls should be minimized to nearly frictionless. To reduce the friction between side wall and backfill, a lubrication layer fabricated with plastic sheets was furnished for all experiments. Two types of plastic sheeting, one thick and two thin plastic sheets, were adopted to reduce the interface friction. All plastic sheets were hung vertically on the side walls before the backfill was deposited as shown in
Fig. 13.
As the inclination of the plate is increased, based on the equilibrium of forces, the sliding resistance T also increases until the driving force overcomes the resistance and the soil box starts to move. At this moment, the inclination angle of the plate to the horizontal is the interface friction angle δ that represents the characteristics of the
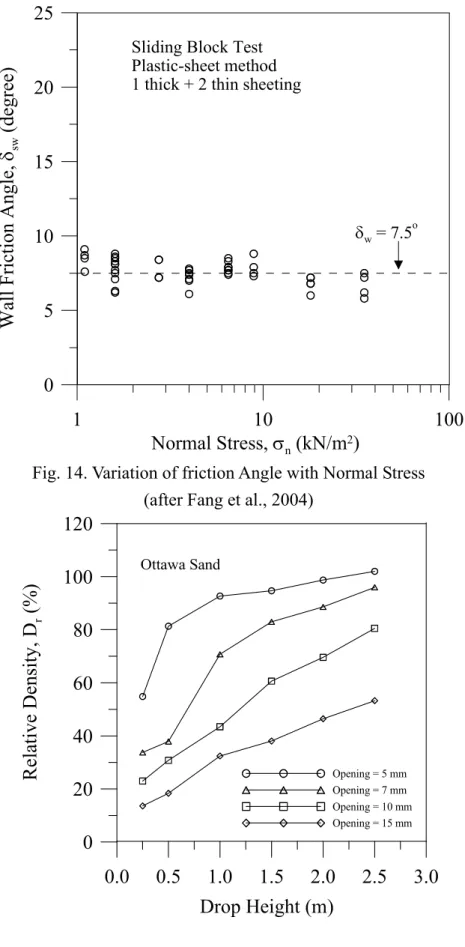
lubrication layers. Fig. 14 shows the variation of side-wall friction angle sw as a
function of the normal stress n for the plastic sheet method (1 thick + 2 thin sheeting)
used in this study. The measured side-wall friction angle with this method is about 7.5°. It is clear in Fig. 15. that the wall friction angle sw is nearly independent of the
applied normal stress n. This constancy is an important advantage in establishing the
input soil properties for analytical models that might be used to analyze the experimental results. For all experiments in this paper, the lubrication layers were wall applied on two side walls as indicated in Fig. 13. The plastic sheets not only can help to reduce the friction force between the side walls and the backfill, but also can help to reduce the reflection of elastic waves transmitted to the soil-wall boundaries during compaction.
10 1 0.1 0.01 Particle Diameter (mm) 0 20 40 60 80 100 Pe rce nt F ine r b y We ig ht ( % )
Ottawa Silica Sand (ASTM C-778)
Fig. 10. Grain size distribution of Ottawa sand (after Chen, 2003)
= 6.43 -68.99 Air-Pluviated Compaction = 7.25 -79.51 15.0 15.5 16.0 16.5 17.0 17.5 Unit Weight, (kN/m3 ) 25 30 35 40 45 Int ern al F ric tion Angl e (d eg re e)
Fig. 12. Relationship between unit weight and internal friction angle (after Chang, 2000)
Fig. 13. Lubrication layer on the side wall
Sidewall
Lubrication Layer
(Plastic Sheets)
1 10 100 Normal Stress, n (kN/m2) 0 5 10 15 20 25
Wall Friction Angle,
sw
(degree)
Sliding Block Test Plastic-sheet method 1 thick + 2 thin sheeting
w = 7.5o
Fig. 14. Variation of friction Angle with Normal Stress (after Fang et al., 2004)
Ottawa Sand 0.0 0.5 1.0 1.5 2.0 2.5 3.0 Drop Height (m) 0 20 40 60 80 100 120 R elative Density, D r (% ) Opening = 5 mm Opening = 7 mm Opening = 10 mm Opening = 15 mm
Fig. 15 Relationship among slot opening, drop height, and relative density (after Ho, 1999)
Table 2. Properties of Ottawa sand (after Chen, 2003) Shape Rounded emax 0.76 emin 0.50 Gs 2.65 D60 (mm) 0.39 D10 (mm) 0.26 Cu 1.5 Shape Rounded emax 0.76 emin 0.50 Gs 2.65
5. TEST RESULTS 5.1. Stresses in loose sand
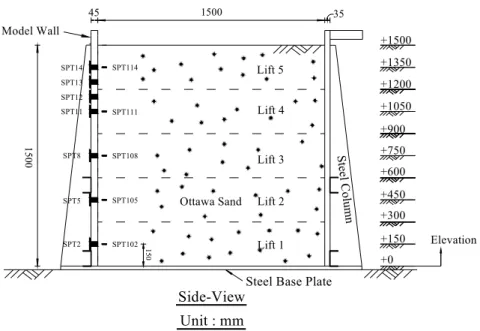
The method of air-pluviation was adopted to prepare the backfill and the relative density Dr achieved for the loose sand was 34.2 %. Fig. 16 illustrated stress v
showed the location of soil pressure transducers to measure the distribution of vertical and horizontal earth pressure h with depth. SPT102, SPT105, SPT108, SPT111, and
SPT114 were buried in the soil mass to measure v. The vertical earth pressure v
measured in the soil mass was illustrated in Fig. 17. In this figure, the vertical pressure v increased linearly with increasing depth z and the test data were in fairly
good agreement with the traditional equation v = z. In this study, unit weight
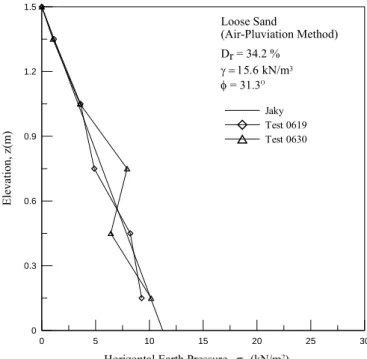
was 15.6 kN/m3 for the loose sand. The distribution of horizontal earth pressure
h
with depth was illustrated in Fig. 18. In the figure, the earth pressure profile induced by the 1.5 m-thick loose backfill was approximately linear and was in good agreement with the Jaky’s equation.
5.2. Vertical and Horizontal Stresses in Sand during Compaction
Fig. 19 showed the vertical pressure v profile after the vibratory compaction. In the
figure, the measured vertical stresses increased with increasing depth. It is clear in the figure that the vertical overburden pressure v can be properly estimated with the
equation v = z.
The distributions of horizontal earth pressure against the non-yielding wall after the compaction of soil from lift 1 to lift 5 were shown in Fig. 20 (a) to (e). The test results reported by Chen and Fang (2008) were also plotted in the figure. Each compacted lift is 0.3 m-thick after compaction. The variation of lateral earth pressure was monitored by the soil pressure transducer mounted on the wall. Before compaction, the earth pressure at-rest can be properly estimated with Jaky’s equation. However, after vibratory compaction, it is clear in Fig. 20 (d) that an extra horizontal stress h,ci was
induced by compaction. The compaction-influenced zone indicated in Fig. 20 (d)
extended from the compacted surface to the depth of approximately 0.7 m. In Fig. 20 (c) to (e), the compaction-influenced zone rose with rising compaction surface. It was interesting to note in Fig. 20 (e) that, below the compaction-influenced zone the horizontal stresses converged to the earth pressure at-rest based on Jaky’s equation. The lateral stress measured near the top of backfill was almost identical to the passive earth pressure estimated with Rankine theory. It should be emphasized that the
was quite significant.
5.3. Stress Paths for Filling and Compaction of Backfill
The stress path (v versus h) for a soil element under the filling and compaction of
the backfill for Test 0812 was shown in Fig. 21. Chen and Fang (2008) reported that the compaction process would not result in residual stress in the vertical direction. On the other hand, horizontal earth pressure near the top of the wall increased
significantly due to compaction. The test data shown in Fig. 21 (a) to (e) were measured by SPT2, SPT5, SPT8, SPT11, and SPT14 respectively. In Fig. 21, the stress path F represented the stress variation due to the filling of the 0.3 m-thick Ottawa sand. Stress path C represents the stress variation due to the vibratory
compaction on the surface of the lift. From these figures, it was clear in Fig. 21(a) that at SPT2, compaction of lift1 caused theσh to increase as shown in stress path C1. The
compaction of lift 3 to lift 5 gradually brought the h back to an at-rest stress
condition indicated by the K0-line. The Rankine passive pressure (Kp-line) was
apparently the upper bound of the induced lateral earth pressure. The path C2 in Fig. 21(b), path C3 in Fig.21(c), path C4 in Fig. 21(d), and path C5 in Fig. 21(e) indicated that the variation of lateral stress was mainly caused by the compaction of backfill near the pressure-transducer, not soil filling. Similar stress variation of stress path could be shown in Fig. 22.
5.4. Dynamic Stress Paths during Compaction
In Fig. 21(a) the stress path F1 represented the stress path due to the Filling of Lift 1. The F1 stress path basically followed the Ko-line as expected. The stress path C1
represented the Compacting of Lift 1. It should be mentioned that the loose backfill was placed and compacted in five Lifts, from Lift 1 to Lift 5 as shown in Fig. 23(d). Each compacted lift had a thickness of 0.3 m.
In Fig. 23(a) showed the soil surface of each lift was divided into six lanes parallel to the face of the model wall. Lane f compacted first and Lane a was compacted last. Each lane was densified with a pass having duration of 70 seconds.
In Fig. 21(a), the stress path C1 was approximated with a straight lone. However the dynamic stress path from point A to point B was much more complicated than a straight line. As illustrated in Fig. 23, the dynamic stress paths in the sandy backfills were discussed in three conditions: (1) compaction approaching SPT in x-direction; (2) compaction passing SPT in y-direction; and (3) compaction rising in z-direction.
5.4.1. Compaction Approaching SPT in x-direction
The dynamic stress path due to the compaction on Lift 2, 3, 4, and 5 were illustrated in Fig. 24, 25, 26 and 27, respectively. In three figures, with the approaching of compaction toward the earth pressure transducers, the stress paths became more significant. No stress beyond the kp-line had been observed in the experiments.
5.4.2. Compaction Passing SPT in y-direction
The dynamic stress path due to the passing of compactor on Lane a of Lift 2, 3, 4 and 5 were indicated in Fig. 28, 29, 30 and 31, respectively. In three figures, as the compactor moved toward the SPT in y-direction, the stress paths became more apparent. No stress below the Ko-line had been observed.
5.4.3. Compaction Rising in z-direction
The stress paths due to compaction measured with SPT5 and SPT105, SPT8 and SPT108, SPT11 and SPT111, and SPT14 and SPT114 were shown in Fig.32, 33, 34 and 35, respectively.
5.5. Comparison among Lifts and Tests
Fig. 36 (a) to (e) showed the stress paths due to the 1-second compaction at the center of Lane a for Lift 1 to Lift 5. It was observed in these figures that the shape and the size of the dynamic stress paths obtained at five different lifts were quite similar. The dynamic stress path had the shape of a comet. The comet moved between the Ko-line
and Kf-line. Fig. 37 showed similar experimental results was obtained from Test 0805.
5.6. Comparison of Theoretical and Experimental Stress Paths
Fig. 38 showed the theoretical stress path of hysteretic model proposed by Broms (1971). For a soil element existed at some depth of backfill, the initial vertical stress due to the overburden soil was vi. The initial horizontal stress was σhi = Kovi, which
was represented by the point A in Fig. 38. When a heavy compactor was positioned immediately above the soil element, following the Ko-line, an increase of the vertical
stress resulted in an horizontal stress increase based on the assumption of no lateral yield. The stress state can be expressed as hm = K0 vm (point B). As the heavy
h decrease until a limitation (Kr-line) was reached (point C). The assumption was
made that the maximum horizontal stress induced by compaction hm sustained until
the vertical stress is reduced below a critical value at point c. After that, further v
unloading resulted in a decrease in h following the Kr-line as hf = Kr vi (point D)
until the original vertical stress vi was reached. Broms (1971) assumed that Kr =
1/Ko.
The experiment stress paths due to the filling of backfill of Lift 2 (F2) and the compaction of Lift 2 (C2) were shown in Fig. 38. It is interesting to note that the starting point A and ending point D lased on Brown’s theory, was similar to the starting point A and ending point E of the stress path C2. It was indicated that compaction would result in an increase of stress only in the horizontal direction, but not in the vertical direction.
The dynamic stress path due to on-cycle of compaction at the center part of Lane A was also illustrated in Fig. 38. It was obvious that the comet-shaped dynamic stress path was quite different from the stress path proposed by Broms. It should be
mentioned that the stress path AB in Fig. 38 indicated the heavy compactor generally 5~15 ton applied a large static vertical pressure v on the surface of fill. However,
stress path BC represented the removal of the heavy compactor. The mass of hand-operated square-plate compactor used in this study was only 12.1 kg (W= 119 N). The peak dynamic force applied on the surface of fill was Fx = 280 N, Fy =
1320 N , and FZ = 1690 N. The vibratory compaction was 3-dimentional and was
controlled by the cyclic loading instead of the dead-load of the compactor. This was probably the main reason why the dynamic stress path due to vibratory compaction was so different from Broms’ finding.
Unit : mm 1500 35 45 150 0 SPT14 SPT13 SPT12 SPT11 SPT8 SPT5 SPT2 Elevation
Steel Base Plate SPT114 SPT111 SPT108 SPT105 SPT102 Ottawa Sand S te el C olu m n Side-View +1500 +1200 +900 +600 +300 +0 150 +1350 +1050 +750 +450 +150 Model Wall Lift 5 Lift 4 Lift 3 Lift 2 Lift 1
Fig. 16. Locations of SPT to measure distribution of earth pressure
0 5 10 15 20 25 30
Vertical Earth Pressure, v (kN/m2)
0 0.3 0.6 0.9 1.2 1.5 E lev atio n, z(m) Jaky Test 0619 Test 0630 Loose Sand (Air-Pluviation Method) Dr = 34.2 % kN/m3 = 31.3O v = z
0 5 10 15 20 25 30
Horizontal Earth Pressure, h (kN/m2)
0 0.3 0.6 0.9 1.2 1.5 Ele va tio n, z (m ) Jaky Test 0619 Test 0630 Loose Sand (Air-Pluviation Method) Dr = 34.2 % kN/m3 = 31.3O
Fig. 18. Distribution of horizontal earth pressure
0 5 10 15 20 25 30
Vertical Earth Pressure, v (kN/m2)
0 0.3 0.6 0.9 1.2 1.5 E levation , z (m) Test 0804 Test 0805 Test 0806 Test 0810 Test 0812 Test 0630 Test 0619 v = z (6.6 kN/m3) Compacted Sand Dr = 73.8 % = 16.6 kN/m3 = 40.8o v = z (5.6 kN/m3) Loose Sand Dr = 34.2 % = 15.6 kN/m3 = 31.3o
Fig. 20. Distribution of horizontal earth pressure in compacted sand 0 5 10 15 20 25 Test 0806 K0 Ka Kp Test 0806 Elevation : 1.35 m h by SPT 14 v by SPT 114 F5 C5 0 5 10 15 20 25 0 5 10 15 Test 0806 K0 Ka Kp Test 0806 Elevation : 1.05 m h by SPT 11 v by SPT 111 F4 F5 C4 C5 0 5 10 15 20 25 Test 0806 K0 Ka Kp Test 0806 Elevation : 0.75 m h by SPT 8 v by SPT 108 F3 F4 F5 C3 C4 C5 0 5 10 15 20 25 Test 0806 K0 Ka Kp Test 0806 Elevation : 0.45 m h by SPT 5 v by SPT 105 F2 F3 F4 F5 C2 C3 C4 C5 0 5 10 15 20 25 0 5 10 15 Test 0806 K0 Ka Kp F1 C1 Test 0806 Elevation : 0.15 m h by SPT 2 v by SPT 102 F2 F3 F4 F5 C2 C3 C4 C5
Vertical Earth Pressure, v(kN/m2)
H ori zo nt al E art h P res su re, h (kN /m 2) (a) (b) (c) (e) (d) F : Fill C : Compaction F : Fill
C : Compaction F : FillC : Compaction
F : Fill
C : Compaction F : FillC : Compaction
Fig. 21. Static stress paths for soil element under filling and compaction of backfill (Test 0812)
0 5 10 15
Chen and Fang (2008) Test 0804 Test 0805 Test 0806 Test 0810 Test 0812 Rankine (Passive) Ja ky (c) 0 5 10 15
Chen and Fang (2008) Test 0804 Test 0805 Test 0806 Test 0810 Test 0812
Rankine (Passive)
Ja ky
(b)
0 5 10 15
Chen and Fang (2008) Test 0804 Test 0805 Test 0806 Test 0810 Test 0812
Rankine (Passive)
Ja ky (e) 0 5 10 15 0 0.3 0.6 0.9 1.2 1.5 E lev at ion , z ( m )
Chen and Fang(2008) Test 0804 Test 0805 Test 0806 Test 0810 Test 0812 Rankine (Passive) Ja ky Compacted Sand (a)
Horizontal Earth Pressure,
h0 5 10 15 Test 0804 Test 0805 Test 0806 Test 0810 Test 0812 Chen and Fang (2008)
Rankine (Passive) Ja ky (d) h,ci Compaction-Influenced Zone
0 5 10 15 20 25 30 0 5 10 15 20 Test 0812 Test 0810 Test 0806 Test 0805 Test 0804 Ko Ka Kp Elevation : 0.15 m h by SPT 2 v by SPT 102
Vertical Earth Pressure, v(kN/m2)
H oriz ont al E arth P ress ure , h (kN/m 2) 0 5 10 15 20 25 30 Test 0812 Test 0810 Test 0806 Test 0805 Test 0804 Ko Ka Kp Elevation : 0.45 m h by SPT 5 v by SPT 105 0 5 10 15 20 25 30 Test 0812 Test 0810 Test 0806 Test 0805 Test 0804 Ko Ka Kp Elevation : 0.75 m h by SPT 8 v by SPT 108 0 5 10 15 20 25 30 Test 0812 Test 0810 Test 0806 Test 0805 Test 0804 Ko Ka Kp Elevation : 1.05 m h by SPT 11 v by SPT 111 0 5 10 15 20 25 30 Test 0812 Test 0810 Test 0806 Test 0805 Test 0804 Ko Ka Kp Elevation : 1.35 m h by SPT 14 v by SPT 114
Fig. 22. Comparison of stress paths for soil element under filling and compaction of backfill
0 300 mm
Scale
Lane f
Footboard
Model Wall Soil Pressure
Transducer Steel Column Backfill Top-View Lane e Lane d Lane c Lane b Lane a x y
0 300 mm
Scale
Lane a
Footboard
Model Wall Soil Pressure
Transducer Steel Column Backfill Top-View Lane b Lane c Lane d Lane e Lane f Left wall Right wall Center R750 Center R375 Center Center-L375 Center L750 y x
(b) Compaction passing SPT in y-direction
16
00
Unit : mm
1500
End
Steel Base Plate
Wall 45
1500
Model Wall
Sidewall Footboard soil pressure transducer Lane f Lift 5 Lane e Lane d Lane c Lane b Lane a Lift 4 Lift 3 Lift 2 Lift 1 x y z
(c) Compaction rising in z-direction
0 5 10 15 20 25 Test 0806 C2-a-Center K0 Ka Kp Test 0806 Elevation : 0.45 m h by SPT 5 v by SPT 105 F2 F3 F4 F5 C2 C3 C4 C5 0 5 10 15 20 25 Test 0806 C2-b-Center K0 Ka Kp Test 0806 Elevation : 0.45 m h by SPT 5 v by SPT 105 F2 F3 F4 F5 C2 C3 C4 C5 0 5 10 15 20 25 0 5 10 15 Test 0806 C2-c-Center K0 Ka Kp Test 0806 Elevation : 0.45 m h by SPT 5 v by SPT 105 F2 F3 F4 F5 C2 C3 C4 C5 0 5 10 15 20 25 Test 0806 C2-d-Center K0 Ka Kp Test 0806 Elevation : 0.45 m h by SPT 5 v by SPT 105 F2 F3 F4 F5 C2 C3 C4 C5 0 5 10 15 20 25 Test 0812 C2-e-Center K0 Ka Kp Test 0806 Elevation : 0.45 m h by SPT 5 v by SPT 105 F2 F3 F4 F5 C2 C3 C4 C5 0 5 10 15 20 25 0 5 10 15 Test 0806 C2-f-Center K0 Ka Kp Test 0806 Elevation : 0.45 m h by SPT 5 v by SPT 105 F2 F3 F4 F5 C2 C3 C4 C5
Vertical Earth Pressure, v(kN/m2)
H
or
izontal Earth Pressure,
h (k N/ m 2) (a) (b) (c) (f) (e) (d) F : Fill C : Compaction F : Fill C : Compaction F : Fill C : Compaction F : Fill C : Compaction F : Fill
C : Compaction F : FillC : Compaction
Fig. 24. Stress paths measured at center part of the model wall by SPT5 and SPT105 due to compaction on lift 2 from Lane f to Lane a
0 5 10 15 20 25 Test 0806 C3-a-Center K0 Ka Kp Test 0806 Elevation : 0.75 m h by SPT 8 v by SPT 108 F3 F4 F5 C3 C4 C5 0 5 10 15 20 25 Test 0806 C3-b-Center K0 Ka Kp Test 0806 Elevation : 0.75 m h by SPT 8 v by SPT 108 F3 F4 F5 C3 C4 C5 0 5 10 15 20 25 0 5 10 15 Test 0806 C3-c-Center K0 Ka Kp Test 0806 Elevation : 0.75 m h by SPT 8 v by SPT 108 F3 F4 F5 C3 C4 C5 0 5 10 15 20 25 Test 0806 C3-d-Center K0 Ka Kp Test 0806 Elevation : 0.75 m h by SPT 8 v by SPT 108 F3 F4 F5 C3 C4 C5 0 5 10 15 20 25 Test 0806 C3-e-Center K0 Ka Kp Test 0806 Elevation : 0.75 m h by SPT 8 v by SPT 108 F3 F4 F5 C3 C4 C5 0 5 10 15 20 25 0 5 10 15 Test 0806 C3-f-Center K0 Ka Kp Test 0806 Elevation : 0.75 m h by SPT 8 v by SPT 108 F3 F4 F5 C3 C4 C5
Vertical Earth Pressure, v(kN/m2)
H or izo ntal Ea rth Pr essur e, h (k N/m 2) (a) (b) (c) (f) (e) (d) F : Fill C : Compaction F : Fill C : Compaction F : Fill C : Compaction F : Fill C : Compaction F : Fill
C : Compaction F : FillC : Compaction
Fig. 25. Stress paths measured at center part of the model by SPT8 and SPT108wall due to compaction on lift 3 from Lane f to Lane a
0 5 10 15 20 25 Test 0806 C4-a-Center K0 Ka Kp Test 0806 Elevation : 1.05 m h by SPT 11 v by SPT 111 F4 F5 C4 C5 0 5 10 15 20 25 Test 0806 C4-b-Center K0 Ka Kp Test 0806 Elevation : 1.05 m h by SPT 11 v by SPT 111 F4 F5 C4 C5 0 5 10 15 20 25 0 5 10 15 Test 0806 C4-c-Center K0 Ka Kp Test 0806 Elevation : 1.05 m h by SPT 11 v by SPT 111 F4 F5 C4 C5 0 5 10 15 20 25 Test 0806 C4-d-Center K0 Ka Kp Test 0806 Elevation : 1.05 m h by SPT 11 v by SPT 111 F4 F5 C4 C5 0 5 10 15 20 25 Test 0806 C4-e-Center K0 Ka Kp Test 0806 Elevation : 1.05 m h by SPT 11 v by SPT 111 F4 F5 C4 C5 0 5 10 15 20 25 0 5 10 15 Test 0806 C4-f-Center K0 Ka Kp Test 0806 Elevation : 1.05 m h by SPT 11 v by SPT 111 F4 F5 C4 C5
Vertical Earth Pressure, v(kN/m2)
Horizontal Ear th Pr essur e, h (k N /m 2) (a) (b) (c) (f) (e) (d) F : Fill C : Compaction F : Fill C : Compaction F : Fill C : Compaction F : Fill C : Compaction F : Fill
C : Compaction F : FillC : Compaction
Fig. 26. Stress paths measured at center part of the model wall by SPT11 and SPT111 due to compaction on lift 4 from Lane f to Lane a
0 5 10 15 20 25 Test 0806 C5-a-Center K0 Ka Kp Test 0806 Elevation : 1.35 m h by SPT 14 v by SPT 114 F5 C5 0 5 10 15 20 25 Test 0806 C5-b-Center K0 Ka Kp Test 0806 Elevation : 1.35 m h by SPT 14 v by SPT 114 F5 C5 0 5 10 15 20 25 0 5 10 15 Test 0806 C5-c-Center K0 Ka Kp Test 0806 Elevation : 1.35 m h by SPT 14 v by SPT 114 F5 C5 0 5 10 15 20 25 Test 0806 C5-d-Center K0 Ka Kp Test 0806 Elevation : 1.35 m h by SPT 14 v by SPT 114 F5 C5 0 5 10 15 20 25 Test 0806 C5-e-Center K0 Ka Kp Test 0806 Elevation : 1.35 m h by SPT 14 v by SPT 114 F5 C5 0 5 10 15 20 25 0 5 10 15 Test 0806 C5-f-Center K0 Ka Kp Test 0806 Elevation : 1.35 m h by SPT 14 v by SPT 114 F5 C5
Vertical Earth Pressure, v(kN/m2)
Horizon tal Earth P re ssure, h (k N /m 2) (a) (b) (c) (f) (e) (d) F : Fill C : Compaction F : Fill C : Compaction F : Fill C : Compaction F : Fill C : Compaction F : Fill
C : Compaction F : FillC : Compaction
Fig. 27. Stress paths measured at center part of the model wall by SPT14 and SPT114 due to compaction on lift 5 from Lane f to Lane a
0 5 10 15 20 25 Test 0806 C2-a-center-L750 K0 Ka Kp Test 0806 Elevation : 0.45 m h by SPT 5 v by SPT 105 F2 F3 F4 F5 C2 C3 C4 C5 0 5 10 15 20 25 0 5 10 15 Test 0806 C2-a-center-L375 K0 Ka Kp Test 0806 Elevation : 0.45 m h by SPT 5 v by SPT 105 F2 F3 F4 F5 C2 C3 C4 C5 0 5 10 15 20 25 Test 0806 C2-a-center K0 Ka Kp Test 0806 Elevation : 0.45 m h by SPT 5 v by SPT 105 F2 F3 F4 F5 C2 C3 C4 C5 0 5 10 15 20 25 Test 0806 C2-a-center-R375 K0 Ka Kp Test 0806 Elevation : 0.45 m h by SPT 5 v by SPT 105 F2 F3 F4 F5 C2 C3 C4 C5 0 5 10 15 20 25 0 5 10 15 Test 0806 C2-a-center-R750 K0 Ka Kp Test 0806 Elevation : 0.45 m h by SPT 5 v by SPT 105 F2 F3 F4 F5 C2 C3 C4 C5
Vertical Earth Pressure, v(kN/m2)
H orizon tal E arth Pre ssu re , h (kN /m 2) (a) (b) (c) (e) (d) F : Fill
C : Compaction F : FillC : Compaction F : FillC : Compaction
F : Fill
C : Compaction F : FillC : Compaction
Fig. 28. Stress paths measure at SPT5 and SPT105 due to compaction on Lane (near the wall) of Lift 2 from R750 to L750
0 5 10 15 20 25 Test 0806 C3-a-center-L750 K0 Ka Kp Test 0806 Elevation : 0.75 m h by SPT 8 v by SPT 108 F3 F4 F5 C3 C4 C5 0 5 10 15 20 25 0 5 10 15 Test 0806 C3-a-center-L375 K0 Ka Kp Test 0806 Elevation : 0.75 m h by SPT 8 v by SPT 108 F3 F4 F5 C3 C4 C5 0 5 10 15 20 25 Test 0806 C3-a-center K0 Ka Kp Test 0806 Elevation : 0.75 m h by SPT 8 v by SPT 108 F3 F4 F5 C3 C4 C5 0 5 10 15 20 25 Test 0806 C3-a-center-R375 K0 Ka Kp Test 0806 Elevation : 0.75 m h by SPT 8 v by SPT 108 F3 F4 F5 C3 C4 C5 0 5 10 15 20 25 0 5 10 15 Test 0806 C3-a-center-R750 K0 Ka Kp Test 0806 Elevation : 0.75 m h by SPT 8 v by SPT 108 F3 F4 F5 C3 C4 C5
Vertical Earth Pressure, v(kN/m2)
Horizon
tal Earth Pre
ssu re, h (kN/ m 2) (a) (b) (c) (e) (d) F : Fill
C : Compaction F : FillC : Compaction F : FillC : Compaction
F : Fill
C : Compaction F : FillC : Compaction
Fig. 29. Stress paths measure at SPT8 and SPT108 due to compaction on Lane (near the wall) of Lift 3 from R750 to L750
0 5 10 15 20 25 Test 0806 C4-a-center-L750 K0 Ka Kp Test 0806 Elevation : 1.05 m h by SPT 11 v by SPT 111 F4 F5 C4 C5 0 5 10 15 20 25 0 5 10 15 Test 0806 C4-a-center-L375 K0 Ka Kp Test 0806 Elevation : 1.05 m h by SPT 11 v by SPT 111 F4 F5 C4 C5 0 5 10 15 20 25 Test 0806 C4-a-center K0 Ka Kp Test 0806 Elevation : 1.05 m h by SPT 11 v by SPT 111 F4 F5 C4 C5 0 5 10 15 20 25 Test 0806 C4-a-center-R375 K0 Ka Kp Test 0806 Elevation : 1.05 m h by SPT 11 v by SPT 111 F4 F5 C4 C5 0 5 10 15 20 25 0 5 10 15 Test 0806 C4-a-center-R750 K0 Ka Kp Test 0806 Elevation : 1.05 m h by SPT 11 v by SPT 111 F4 F5 C4 C5
Vertical Earth Pressure, v(kN/m2)
Hori zontal Earth Pres su re , h (k N /m 2) (a) (b) (c) (e) (d) F : Fill
C : Compaction F : FillC : Compaction F : FillC : Compaction
F : Fill
C : Compaction F : FillC : Compaction
Fig. 30. Stress paths measure at SPT11 and SPT111 due to compaction on Lane (near the wall) of Lift 4 from R750 to L750
0 5 10 15 20 25 Test 0806 C5-a-center-L750 K0 Ka Kp Test 0806 Elevation : 1.35 m h by SPT 14 v by SPT 114 F5 C5 0 5 10 15 20 25 0 5 10 15 Test 0806 C5-a-center-L375 K0 Ka Kp Test 0806 Elevation : 1.35 m h by SPT 14 v by SPT 114 F5 C5 0 5 10 15 20 25 Test 0806 C5-a-center K0 Ka Kp Test 0806 Elevation : 1.35 m h by SPT 14 v by SPT 114 F5 C5 0 5 10 15 20 25 Test 0806 C5-a-center-R375 K0 Ka Kp Test 0806 Elevation : 1.35 m h by SPT 14 v by SPT 114 F5 C5 0 5 10 15 20 25 0 5 10 15 Test 0806 C5-a-center-R750 K0 Ka Kp Test 0806 Elevation : 1.35 m h by SPT 14 v by SPT 114 F5 C5
Vertical Earth Pressure, v(kN/m2)
H ori zo nt al E art h Pre ssu re, h (k N /m 2) (a) (b) (c) (e) (d) F : Fill C : Compaction F : Fill C : Compaction F : Fill C : Compaction F : Fill
C : Compaction F : FillC : Compaction
Fig. 31. Stress paths measure at SPT14 and SPT114 due to compaction on Lane (near the wall) of Lift 5 from R750 to L750
0 5 10 15 20 25 Test 0806 C5-a-Center K0 Ka Kp Test 0806 Elevation : 0.45 m h by SPT 5 v by SPT 105 F2 F3 F4 F5 C2 C3 C4 C5 0 5 10 15 20 25 0 5 10 15 Test 0806 C4-a-Center K0 Ka Kp Test 0806 Elevation : 0.45 m h by SPT 5 v by SPT 105 F2 F3 F4 F5 C2 C3 C4 C5 0 5 10 15 20 25 Test 0806 C3-a-Center K0 Ka Kp Test 0806 Elevation : 0.45 m h by SPT 5 v by SPT 105 F2 F3 F4 F5 C2 C3 C4 C5 0 5 10 15 20 25 0 5 10 15 Test 0806 C2-a-Center K 0 Ka Kp Test 0806 Elevation : 0.45 m h by SPT 5 v by SPT 105 F2 F3 F4 F5 C2 C3 C4 C5
Vertical Earth Pressure, v(kN/m2)
Horizonta l E art h Pressur e, h (kN/m 2) (a) (b) (d) (c) F : Fill
C : Compaction F : FillC : Compaction F : Fill
C : Compaction F : FillC : Compaction
Fig. 32. Stress paths measure at SPT5 and SPT105 due to compaction on center part of Lane a (near the wall) of Lift 2 to Lift 5
0 5 10 15 20 25 Test 0806 C5-a-Center K0 Ka Kp Test 0806 Elevation : 0.75 m h by SPT 8 v by SPT 108 F3 F4 F5 C3 C4 C5 0 5 10 15 20 25 0 5 10 15 Test 0806 C4-a-Center K0 Ka Kp Test 0806 Elevation : 0.75 m h by SPT 8 v by SPT 108 F3 F4 F5 C3 C4 C5 0 5 10 15 20 25 0 5 10 15 Test 0806 C3-a-Center K0 Ka Kp Test 0806 Elevation : 0.75 m h by SPT 8 v by SPT 108 F3 F4 F5 C3 C4 C5
Vertical Earth Pressure, v(kN/m2)
H orizo ntal E ar th P ressure , h (kN /m 2) (a) (c) (b) F : Fill
C : Compaction F : FillC : Compaction F : Fill
C : Compaction
0 5 10 15 20 25 0 5 10 15 Test 0806 C5-a-Center K0 Ka Kp Test 0806 Elevation : 1.05 m h by SPT 11 v by SPT 111 F4 F5 C4 C5 0 5 10 15 20 25 0 5 10 15 Test 0806 C4-a-Center K0 Ka Kp Test 0806 Elevation : 1.05 m h by SPT 11 v by SPT 111 F4 F5 C4 C5
Vertical Earth Pressure, v(kN/m2)
Hor iz ontal Ear th Pr essure, h (kN/m 2) (b) (a) F : Fill C : Compaction F : Fill C : Compaction
Fig. 34. Stress paths measure at SPT11 and SPT111 due to compaction on center part of Lane a (near the wall) of Lift 4 to Lift 5
0 5 10 15 20 25 0 5 10 15 Test 0806 C5-a-Center K0 Ka Kp Test 0806 Elevation : 1.35 m h by SPT 14 v by SPT 114 F5 C5
Vertical Earth Pressure, v(kN/m2)
Horizontal Earth P ressu re, h (k N/m 2) F : Fill C : Compaction
Fig. 35. Stress paths measure at SPT14 and SPT114 due to compaction on center part of Lane a (near the wall) of Lift 5
0 5 10 15 20 25 Test 0806 C5-a-Center K 0 Ka Kp Test 0806 Elevation : 1.35 m h by SPT 14 v by SPT 114 F5 C5 0 5 10 15 20 25 0 5 10 15 Test 0806 C4-a-Center K0 Ka Kp Test 0806 Elevation : 1.05 m h by SPT 11 v by SPT 111 F4 F5 C4 C5 0 5 10 15 20 25 Test 0806 C3-a-Center K0 Ka Kp Test 0806 Elevation : 0.75 m h by SPT 8 v by SPT 108 F3 F4 F5 C3 C4 C5 0 5 10 15 20 25 Test 0806 C2-a-Center K0 Ka Kp Test 0806 Elevation : 0.45 m h by SPT 5 v by SPT 105 F2 F3 F4 F5 C2 C3 C4 C5 0 5 10 15 20 25 0 5 10 15 Test 0806 C1-a-Center K0 Ka Kp F1 C1 Test 0806 Elevation : 0.15 m h by SPT 2 v by SPT 102 F2 F3 F4 F5 C2 C3 C4 C5
Vertical Earth Pressure, v(kN/m2)
Horizont al Earth Pr ess ure, h (k N/m 2) (a) (b) (c) (e) (d)
Fig. 36. Stress paths due to compaction at center of Lane a (near the wall) for Lift 1 to Lift 5 (Test 0806) 0 5 10 15 20 25 Test 0804 C5-a-center K0 Ka Kp Test 0805 Elevation : 1.35 m h by SPT 14 v by SPT 114 F5 C5 0 5 10 15 20 25 0 5 10 15 Test 0805 C4-a-center K0 Ka Kp Test 0805 Elevation : 1.05 m h by SPT 11 v by SPT 111 F4 F5 C4 C5 0 5 10 15 20 25 Test 0805 C3-a-center K0 Ka Kp Test 0805 Elevation : 0.75 m h by SPT 8 v by SPT 108 F3 F4 F5 C3 C4 C5 0 5 10 15 20 25 Test 0805 C2-a-center K0 Ka Kp Test 0805 Elevation : 0.45 m h by SPT 5 v by SPT 105 F2 F3 F4 F5 C2 C3 C4 C5 0 5 10 15 20 25 0 5 10 15 Test 0805 C1-a-center K0 Ka Kp F1 C1 Test 0805 Elevation : 0.15 m h by SPT 2 v by SPT 102 F2 F3 F4 F5 C2 C3 C4 C5
Vertical Earth Pressure, v(kN/m2)
Hor iz ontal Eart h Pr es su re, h (kN/m 2) (a) (b) (c) (e) (d)
Fig. 37. Stress paths due to compaction at center of Lane a (near the wall) for Lift 1 to Lift 5 (Test 0805)
0 5 10 15 20 25 Vertical Earth Pressure, v (kN/m2)
0 5 10 15 20 Ho ri za ntol Ea rt h Pre ssu re, h (k N /m 2 ) Test 0806 Broms (1971) Ko-Jak y
K
aK
pTest 0806
Elevation : 0.45 m
hby SPT 5
vby SPT 105
F2 C2K
r A B C D E vm hm hf hi vi6. CONCLUSIONS
This research studied variation of earth pressure and dynamic stress path in compacted sand. Based on the experiment results, the following conclusions were drawn.
1. For a loose backfill, the horizontal earth pressure in the soil mass was in good agreement with Jaky’s solutions. The vertical earth pressure in soil was near to the equation v =z.
2. After compaction, the lateral stress measured near the top was almost identical to the passive earth pressure estimated with Rankine theory. The effect of vibratory compaction on the vertical pressure was insignificant.
3. After compaction, the thickness of the compaction-influenced zone rose with the elevation of the compaction surface. Below the compaction-influenced zone, the horizontal stresses converged to the earth pressure at-rest based on Jaky’s equation. 4. As the area of the compaction approached the soil pressure transducer (SPT) in
x-direction (perpendicular to the wall face), the dynamic stress path became more obvious when the compactor moved to the lane near the wall.
5. As the area of compaction passed the SPT in y-direction (parallel to the wall surface), the maximum dynamic stress path was obvious when the compactor was right in front of the SPT.
6. For a SPT at a lower elevation, when the area of compaction rose with the elevation of the lift surface, the compaction-induced stress path became less significant. 7. The dynamic stress path of a soil element under vibratory compaction had the shape of a comet. The shape size of the dynamic stress paths obtained at five different lifts was quite similar. The stress paths were bounded by the at-rest Ko-line and passive Kp-line.
8. The measured dynamic stress path was quite different from the stress path proposed by Broms (1971). The stress path reported by Broms was induced by a static heavy compactor. The vibratory compactor used in this study vibrated and generated cycle force in three direction: Fx, Fy, and Fz. This was probably the main reason why the
dynamic stress path due to vibratory compaction was so different from Broms’ finding.
7. RERERENCES
1. Borowicka, H., Influence of Rigidity of a Circular Foundation Slab on the Distribution of Pressures over the Contact Surface, Proc. 1st
Int. Conf. Soil Mech. Found. Eng., vol. 2, pp. 144-149, 1936.
2. Borowicka, H., The Distribution of Pressure under a Uniformly Loaded Elastic Strip Resting on Elastic-Isotropic Ground, 2d Cong. Int. Assoc. Bridge Struct. Eng., Berlin, Final report, vol. 8, no. 3, 1938.
3. Broms, B. (1971). “Lateral earth pressures due to compaction of cohesionless soils.” Proc., 4th Int. Conf. Soil Mech., Budapest, 373-384.
4. Burgess, G. P. (1999). “Performance of Two Full-scale Model Geosynthetic Reinforced Segmental Retaining Walls,” MS thesis, Royal Military College of Canada, Kingston, Ontario, 207.
5. Chang, S. Y. (2000). “Effects of Backfill Density on Active Earth Pressure.” MS thesis, Dept. of Civil Engineering, National Chiao Tung University, Hsinchu, Taiwan.
6. Chen, T. J., and Fang, Y. S, (2002). “A New Facility for Measurement of Earth Pressure At-Rest,” Geotechnical Engineering Journal, SEAGS, 3(12), 153-159. 7. Chen, T. J., (2003). “Earth Pressure Due to Vibratory Compaction”, Doctor of
Philosophy Dissertation, National Chiao Tung University, Hsinchu, Taiwan.
8. Chen, T. J., and Fang, Y. S, (2008). “Earth Pressure Due to Vibratory Compaction”, Journal of Geotechnical and Geoenvironmental Engineering, ASCE, 134(4), 1-8. 9. D’Appolonia, D. J., Whitman, R. V., and D’Appolonia, E. (1969). “Sand
Compaction with Vibratory Rollers.” Journal of the Soil Mechanics and Foundations Division, ASCE, 95(SM1), 263-284.
10. Das, B. M., (1994), “Principal of Geotechnical Engineering.” 3rd Edition, PWS Publishing Company, Boston.
11. Donath, A. D. (1891). “Untersuchungen veber den erddruck auf stuetzwaende.” Zeitschrift fuer Bauwesen, Berlin.
12. Duncan, J. M., and Seed, R. B. (1986). “Compaction-induced Earth Pressures under K -conditions.” Journal of Geotechnical Engineering, ASCE, 112(1), 1-22. o 13. Duncan, J. M., Williams, G. W., Sehn, A. L., and Seed, R. B. (1991). “Estimation
earth pressures due to compaction.” Journal of Geotechnical Engineering, ASCE, 117(12), 1833-1847.
14. Fang, Y. S. (1983). “Dynamic earth pressures against rotating walls.” Ph.D. dissertation, Department of Civil Engineering, University of Washington, Seattle, Washington.
Boundary Friction in Model Tests”, Geotechnical Testing Journal, ASTM, 27(1), 1-10.
16. Filz, G. M., and Duncan J. M. “Earth Pressures due to Compaction: Comparison of Theory with Laboratory and Field Behavior.” Transportation research record, 1526, 28-37.
17. Ho, Y. C., (1999). “Effects of Backfill Compaction on Passive Earth Pressure.” MS thesis, Dept. of Civil Engineering, National Chiao Tung University, Hsinchu, Taiwan.
18. Ingold, T. S. (1979). “Retaining wall performance during backfilling.” Journal of the Geotechnical Engineering Division, ASCE, 105(GT5), 613-626.
19. Ingold, T. S. (1979). “The effects of compaction on retaining walls.” Geotechnique, 29(3), 265-283.
20. Jaky, J. (1944). “The Coefficient of Earth Pressure at rest.” Journal for Society of Hungarian Architects and Engineers, Budapest, Hungary, Oct., 355-358.
21. Jaky, J., (1948), “Pressure in Soils,” Proceedings, 2nd
International Conference on Soil Mechanics and Foundation Engineering, 1, 103-107.
22. Johnson, A. W., and Sallberg, J. R. (1960). “Factors That Influence Field Compaction of Soil.” Highway Research Board, Bulletin No. 272.
23. Lo Presti, D. C. F., Pedroni, S., and Crippa, V. (1992). “Maximum Dry Density of Cohesionless Soils by Pluviation and by ASTM D 4253-83: A comparative study.” Geotechnical Testing Journal, ASTM, 15(2), 180-189.
24. Mayne, P. W., and Kulhawy, F. H. (1982). “K -OCR Relationships in Soil.” o
Journal of Geotechnical Engineering Division, ASCE, 108(GT6), 851-872.
25. McElroy, J. A. (1997). “Seismic Stability of Geosynthetic Reinforced Slopes: A shaking table study.” MS thesis, University of Washington, Seattle, 286.
26. Mesri, G., and Hayat, T. M. (1993). “The Coefficient of Earth Pressure at rest.” Canadian Geotechnical Journal, 30(4), 647-666.
27. Peck, R. B., and Mesri, G. (1987). Discussion of “Compacted-induced earth pressures under Ko-conditions.” Journal of Geotechnical Engineering, ASCE,
113(11), 1406-1408.
28. Rad, N. S., and Tumay, M. T. (1987). “Factors affecting sand specimen preparation by raining.“ ASTM Geotechnical Testing Journal, 10(1), 31-37.
29. Seed, R. B., and Duncan, J. M. (1983). “Soil-Structure Interaction Effects of Compaction-induced Stresses and Deflections.” Geotechnical Engineering Research Report No. UcB/GT/83-06, Univ. of California Berkeley, CA.
30. Sowers, G. F., Robb, A. D., Mullis, C. H., and Glenn, A. J. (1957). “The Residual Lateral Pressures Produced by Compacting Soils.” Proceedings, 4th
31. Terzaghi, K. (1934). “Large retaining-wall tests (I): Pressure of dry sand.” Engineering News-Record, 112, 136-140.
32. Terzaghi, K. (1941). “General wedge theory of earth pressure.” ASCE Transactions, 106, 68-80.
33. Terzaghi, K. (1943). Theoretical Soil Mechanics, Wiley, New York.
34. Tzeng, S. K., (2002). “Horizontal Pressure on an Unyielding Wall due to Strip Loading on Backfill with Different Densities.” MS thesis, Dept. of Civil Engineering, National Chiao Tung University, Hsinchu, Taiwan.
35. US NAVY. (1982). “Foundations and Earth Structures.” NAVFAC Design Manual DM-7.2. Naval Facilities Engineering Command, U.S. Government Printing Office, Washington, D. C., 60.
36. Vesic, A. S. (1973). “Analysis of Ultimate Loads of Shallow Foundations.” Journal of the Soil Mechanics and Foundations Division, 99(SM1), 45-73.
37. Vesic, A. S., Banks, D. C., and Woodard, J. M. (1965). “An Experimental Study of Dynamic Bearing Capacity of Footings on Sand.” Proceedings, Sixth International Conference on Soil Mechanics and Foundation Engineering, Montreal, Canada, II, 209-213.
38. Wang, F. J., (2005). “Effects of Adjacent Rock Face Inclination on Earth Pressure at-rest.” MS thesis, Dept. of Civil Engineering, National Chiao Tung University, Hsinchu, Taiwan.
可供推廣之研發成果資料表
□ 可申請專利 □ 可技術移轉
日期:100 年 8 月 1 日國科會補助計畫
計畫名稱:震動夯實造成之土壤應力及密度變化(III) 計畫主持人:方永壽 教授 計畫編號:NSC 99-2221-E-009-105- 學門領域:土木水利工程技術/創作名稱
震動夯實造成之土壤應力及密度變化發明人/創作人
方永壽 教授技術說明
中文: 本報告以實驗方法探討振動夯實造成之土壓力及其應力路徑 的變化。本研究以氣乾之渥太華砂為回填土,分五層填土並且分層 夯實。夯實土層為每層0.3 m,總高度為 1.5 m。回填土初始相對密 度為34.2 %,夯實後的相對密度為 73.8 %。為了在實驗室模擬雙向 平面應變的情況,本研究採用塑膠膜潤滑層來降低砂土和填砂槽側 牆間的摩擦力。本研究進行一系列實驗,探討振動夯實對砂土所產 生的影響。這些影響包括夯實過程造成之土壤應力變化及其動態應 力路徑。根據實驗結果,本研究獲得以下幾項結論。(1) 於疏鬆砂土, 土體內的垂直土壓力和水平土壓力可分別以v 和 Jaky 公式來z 進行合理的估算。(2) 隨著夯實機逐漸接近土壓力計,測得之應力變 化越來越明顯;在靠近擋土牆處夯實時,牆面土壓力計的應力變化 是最大的。 隨著覆土深度逐漸升高,深層土壓力計測得夯實造成之 應力變化相當不顯著。 (3) 比較各組之應力路徑發現,夯實造成應 力路徑的大小相似,應力路徑軌跡如同彗星狀。動態應力路徑都介 於K0線及Kp線之間。(4) 相較於 Broms 在 1971 提出之加載-解載應 力路徑,本實驗量測出的應力路徑軌跡與 Broms 的應力路徑軌跡有 很大的差異。Broms 所提出的應力路徑是在土體上方加載一個靜態 且不會振動的壓路機,而本實驗是放置一個重量較輕且具振動力的 夯實機。造成差異之原因,可能是因為夯實機不只有垂直方向的施 力,且造成平行牆面的水平力、及與牆表面垂直的水平力,這三個 方向的動態作用力造成彗星形狀的應力軌跡。英文:This report presents experimental data on the variation of earth pressure and dynamic stress path against a non-yielding retaining wall due to vibratory compaction. The instrumented non-yielding wall facility at National Chiao Tung University was used to investigate the effects of vibratory compaction on the change of dynamic stress in the soil mass. Air-dry Ottawa sand was plated in five lifts and the height of backfill was 1.5 m. The initial relative density of the backfill was 34.2 %, and the compacted relative density of the backfill was 73.8 %. To simulate a plane strain condition in the laboratory, the friction between the soil and sidewalls of the soil bin was reduced with a lubrication layer. The variation of dynamic stresses was measured during compaction with a vibratory compactor. Based on the test results, the following conclusions were drawn. (1) For a loose backfill, the horizontal earth pressure in the soil mass was in good agreement with Jaky’s solutions. The vertical earth pressure in soil was near to the equationv z. (2) As the compactor approached the soil pressure transducer in x-direction (perpendicular to the wall face), the dynamic stress became more obvious when the compactor moved to the lane near the wall. For a transducer at a lower elevation, when the area of compaction rose with the elevation of the lift surface, the compaction-induced stress path became less significant. (3) The dynamic stress path of a soil element under vibratory compaction had the shape of a comet. The shape and size of the dynamic stress paths obtained at five different lifts was quite similar. The stress paths were bounded by the at-rest K0-line and passive
Kp-line. (4) The measured dynamic stress path was quite different from
the stress path proposed by Broms in 1971. The stress path reported by Broms was induced by a static heavy compactor. The vibratory compactor used in this study vibrated and generated cyclic forces in three directions. This was probably the main reason why the dynamic stress path due to vibratory compaction was different from Broms’ finding.
推廣及運用的價值
本研究屬於基礎學術性研究,一年計劃完成,所獲研究成果將有助 於國內外基礎工程設計規劃之參考。 ※ 1.每項研發成果請填寫一式二份,一份隨成果報告送繳本會,一份送 貴單位研發成果推廣單位(如技術移轉中心)。 ※ 2.本項研發成果若尚未申請專利,請勿揭露可申請專利之主要內容。 ※ 3.本表若不敷使用,請自行影印使用。行政院國家科學委員會補助參與國際學術會議報告
專題研究計畫補助編號:NSC 99-2221-E-009-105- 報告人: 方永壽教授 服務機構: 國立交通大學土木工程系所 職稱: 教授 會議名稱: 2011 海峽兩岸岩土工程/地工技術交流研討會 舉辦地點: 廣州、中國、廣州東方賓館 舉辦時間: 2011 年 5 月 12 日~ 14 日 主辦單位:中國建築業協會深基礎施工分會(大陸) 財團法人地工技術研究發展基金會(台灣) 承辦單位: 廣州市地下鐵道總公司 協辦單位: 廣州地鐵設計研究院有限公司 廣東省基礎工程有限公司 廣東省水電集團有限公司 廣州市盾建地下工程有限公司 廣東省土木建築學會地下工程/地基基礎專業委員會 國科會專題研究計畫補助編號:NSC 99-2221-E-009-105- 攜回資料: 研討會論文集 2 冊、「地鐵盾構施工風險源及典型事故之研究」 1 冊、及「富水砂卵石地層盾構施工技術」1 冊一、參加會議經過 近30年來,隨著經濟的持續發展,海峽兩岸的城市與鐵路建設突飛猛 進,成就可喜。尤其是北京、上海、廣州及台北等大城市的城市軌道交通 線,及海峽兩岸的高鐵建設,使的眾多的大型鐵路、公路隧道與橋樑、包 括大面積地下空間的大型綜合樞紐等相繼竣工並投入營運,在地下工程領 域取得了十分豐富的經驗與成就。於此同時,伴隨著地下工程大型化的趨 勢,地質災害的防治與控制成為業界關注的焦點。 1.1 研討會緣起 海峽兩岸岩土工程/地工技術交流研討會始自 1992 年北京,已歷台北 (1993)、西安(1994)、上海(2002)、台北(2004)、天津(2007)及台中(2009) 七次。交流成果豐碩,深獲各界一致好評。 為增進海峽兩岸地下工程學術界與工程界的交流,中國建築業協會深 基礎施工分會(大陸)及財團法人地工技術研究發展基金會(臺灣)共同 主辦,廣州市地下鐵道總公司承辦,地點在廣州,總主題為 「地下工程 災害事故的防控與處理」。邀請海峽兩岸同行、專家學者共聚ㄧ堂,交流 研討,促進海峽兩岸地工技術/岩土工程的發展。 1.2 研討會主題 本次研討會總主題為 「地下工程災害事故的防控與處理」。研討共分 為下列 6 個討論議題,發表經審查、具重要性的論文,以促進海峽兩岸地 工技術/岩土工程學術界與工業界的跨領域交流,6 個討論議題分述如下: ◆ 地震、冰凍、颱風、洪水對基礎工程的破壞及應對 ◆ 開挖、隧道坍塌事故的防控與處理 ◆ 地下工程風險管理與災害防控基礎理論 ◆ 河海隧道(含沉埋管)與深開挖建造技術 ◆ 特殊地層、岩溶地層潛盾設計施工技術 ◆ 區域岩土工程案例分析
1.3 與會者及議程: 此次海峽兩岸研討會共有 48 位台灣代表及 113 位大陸代表參加,台 灣卷論文集收集論文 36 篇,其中 4 篇為主題論文。雙方與會代表姓名及 研討會議程,詳見本報告之附件。下圖為謝旭昇博士及馮愛軍女士主持研 討會開幕典禮的盛況。 1.4 知名學者專題報告 主辦單位邀請海峽兩岸 10 位知名的大地工程學者發表專題演講, 2011 年 5 月 12 日(星期四)的大會主題報告如下: 10:00-12:05 『大會主題報告』(每位25分鐘)主持人:王新杰、林宏達 報告一:【張在明院士紀念講座】 ~北京市勘察設計研究院有限公司沈小克 報告二:【陳斗生博士纪念講座】 ~台灣大地重要斷裂带的演化與災難性岩土災害 ~台灣大學土木系洪如江 報告三:從實務的角度談城市軌道交通工程建設安全風險管理 ~北京城建設計研究總院有限責任公司楊秀仁 報告四:地下工程與風險管理 ~亞新工程顧問公司黄南輝 報告五:沉管隧道的發展和關鍵技術综述