國 立 交 通 大 學
顯示科技研究所
碩 士 論 文
色彩偏移最小化膽固醇液晶顯示器之製作
Fabrication of Color Shift-Minimized Cholesteric
Liquid Crystal Display
研 究 生 : 鄭丞富
指 導 教 授 : 陳皇銘
色彩偏移最小化膽固醇液晶顯示器之製作
Fabrication of Color Shift-Minimized Cholesteric Liquid Crystal
Display
研 究 生 : 鄭 丞 富
Student : Cheng-Fu Cheng
指 導 教 授 : 陳 皇 銘
Advisor : Huang-Ming Philip Chen
國 立 交 通 大 學
電 機 學 院
顯 示 科 技 研 究 所
碩 士 論 文
A Thesis
Submitted to Display Institute
College of Electrical Engineering
National Chiao Tung University
in Partial Fulfillment of the Requirements
for the Degree of
Master
In
Display Institute
January 2010
Hsinchu, Taiwan, Republic of China.
色彩偏移最小化膽固醇液晶顯示器之製作
研究生: 鄭丞富 指導教授: 陳皇銘 博士
國立交通大學顯示科技研究所
摘要
近年來,液晶顯示器因為其輕薄便利之優勢,已逐漸取代傳統映像管顯示器。膽固 醇液晶由於省電不需背光模組、偏正片、彩色濾光片及反射式特性,只需依賴環境光即 可使人眼觀察到色彩並閱讀。非常適合於發展可撓式面板的產業應用,像電子報紙、室 外看板、標籤等。對於膽固醇液晶,當外加電場時,可改變膽固醇液晶的反射強度,但 也跟著出現色彩偏移(blue shift)現象,這現象嚴重的妨礙顯示器的應用。在本篇論文 中,我們使用色差(E*ab)對色彩偏移進行分析和討論,這是因為E*ab能比一般傳統的 反射頻譜得到更精確的數值來描述色彩偏移。為了解決色彩偏移的問題,我們藉著參雜 負型液晶來改變膽固醇液晶的介電參數(ε)和折射參數(n)。藉由上述方法,ε=7.8 的材料,當提供電場範圍(V)為 7.3V 時,E*ab增加量(blue shift)為 14,而當材料 之ε 降至 1.3 時,所需外加電場範圍變為 25V,才能使E*ab增加量相同。此實驗證實 縮小膽固醇液晶混合物的ε 能有效地壓制色彩偏移現象,並同時保有灰階的效果。另 外,縮小膽固醇液晶混合物的n 亦可成功地降低最大色差。Fabrication of Color Shift-Minimized Cholesteric Liquid Crystal
Display
Student: Cheng-Fu Cheng Advisor: Dr. Huang-Ming Philip Chen
Display Institute
National Chiao Tung University
Abstract
Liquid crystal displays (LCDs) have played an important role in flat panel display (FPD) industry and have already achieved a significant market impact, in recent years. Cholesteric Liquid Crystals (CLCs) have great advantages for reflective mode displays due to their lower power consumption, backlight-free, polarizer-free, color filter-free structure and good readability. This let they are suitable for the flexible display applications such as electronic paper, signboard, bill-board, label, etc. The reflectance of CLC can be changed by applying voltage. The blue shift, however, accompany the process. This phenomenon is a hindrance to display applications. In this thesis, the blue shift were analyzed by color difference (E*ab),
because the E*ab could get an exact value for color change than the reflection spectrum. To
solve the blue shift phenomenon, the various host dielectric anisotropic (ε) and birefringence (n) were prepared by mixing negative and positive nematic LCs. The experiment results showed the values of E*ab was increased to 14 for the ε of LCs was 7.8, while the applying
incremental voltage (V) was 7.3V. The same E*ab=14 was obtained when the applied
voltage increased to 25V in the ε=1.3 material. The result indicated the low ε CLC mixtures could effectively suppress blue shift phenomenon and produce smooth gray scale. In
誌謝
在顯示所這兩年的求學生涯中,受到了許多人給予我的恩惠與照顧,其中最要 感謝的人就是我的指導教授陳皇銘老師,不論在生活上、課業上,都給予了很大的幫助, 使我受益良多。其次還要謝謝在工研院的葆如學姐,每到關鍵的步驟都能得到學姊的幫 助,使我的實驗能繼續下去。 . 另外我要感謝耿睿、昆展學長,在我剛進來實驗室時,能在他們畢業前的最後一 刻 帶我實驗,而不致於使我自己不知所措。再來要感謝實驗室的學長姊們,蓮馨、淇文、 祥志、謹瑋、怡帆、宜揚的教導,使我知道如何使用儀器和讓我可以更快的熟悉整個實 驗室。當然最重要的是跟我同屆的致弋、毓筠、宣穎,這兩年來一起同甘共苦,非常謝 謝各位夥伴。也感謝實驗室的其他學弟妹們,總是為實驗室帶來很多歡樂,感謝佩宜和 永星,實驗室及無塵室鄭是因為有了你們的照顧,才讓我們沒有後顧之憂,當然也要感 謝學弟小佑陪我到最後一刻。 最後,感謝我的家人,總是給予我最大的支持,讓我能順利的完成學業。Table of contents
Chinese Abstract ……….………..………... i
English Abstract ……….……….……….... ii
Acknowledgement……… iv
Table of contents……….. v
List of Figures………... vii
List of Tables……… x
Chapter 1 Introduction 1.1 Introduction of Liquid Crystals…..……….. 1
1.2 Liquid Crystal Phases………. 1
1.3 Reflective LC Displays………... 6
1.4 Motivation……….. 9
1.5 Organization of This Thesis……… 9
Chapter 2 Overview of Cholesteric Liquid Crystals 2.1 Introduction ………... 10
2.2 Effect of Chiral Material………. 10
2.3 Optical Properties of Cholesteric Liquid Crystals……….. 12
2.4 Reflective Color for CLCs……….. 23
2.5 Proposed Method to Resolve Blueshift………... 24
2.6 Summary………. 28
Chapter 3 Measurement Systems 3.1 Introduction….………..………. 30
3.2 Spectrometer……… 30
4.2 Display Cell Preparation………...……….. 39
4.3 Materials and CLCs Mixtures………... 42
4.4 Properties of the Cholesteric Liquid Crystal Hosts………. 43
4.5 Measurement form Spectrometer……… 44
4.6 Color Characterization……… 46 4.7 Summary………. 48 Chapter 5 Conclusions 5.1 Summary………... 49 5.2 Future Works………... 49 References ………. 50
List of Figures
Fig.1.1. Nematic liquid crystal molecule structure ………..……….... 2
Fig.1.2. Cholesteric liquid crystal molecule structure. ………..3
Fig.1.3. Sematic phase molecule structure ………4
Fig.1.4. Chiral Sematic liquid crystal structure……….….5
Fig.1.5. A reflective LCD using ambient light for displaying images. ……….6
Fig.1.6. Basic operating mode for the normally white PDLC ……….………..7
Fig.1.7. The operating mode for the no polarizer guest-host display ……….………….……..8
Fig.2.1. Helical structures formed in chiral liquid crystal. (a) N* is the cholesteric phase, (b) BP is the blue phase, (c) SmC* is the chiral smectic-C, and (d) TGBA is the twist grain boundary phase. ………..…….12
Fig.2.2. Schematic of the textures in CLCs: (a) planar, (b) focal conic, (c) fingerprint, and(d) isotropic or homeotropic cholesteric texture ……….……13
Fig.2.5.Reflection spectrum is in the planar texture for stacking CLCs ………….…………16
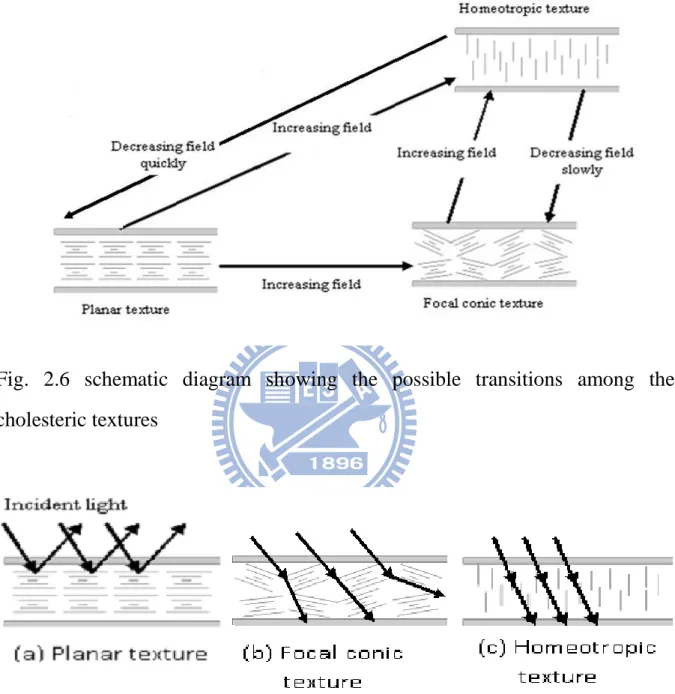
Fig.2.6.Schematic diagram showing the possible transitions among the cholesteric textures 17 Fig.2.7. Schematic diagram of the states of the CLCs which dielectric anisotropy is positive. (a) Planar texture (b) Focal conic texture (c) Homeotropic texture. ………..…..…17
Fig.2.8. Microphotograph of the planar texture is transferred to the focal conic texture when applied electric field. ……….20
Fig.2.9. Schematic diagram showing the structure of Helfrich deformation in a plane perpendicular to the cell surface………..……….….20
Fig.2.10.Schematic diagram of the states of the CLCs which the dielectric anisotropy is negative (a) Initial texture in the planar state (b) Initial texture in the focal conic state (c) Planar texture (d) Homeotropic texture……….……..21
Fig.2.11. The diagram of the gray scale states of the CLCs display………....22
Fig.2.12.The diagram of electric susceptibility for LC molecular………28
Fig.3.1. The photograph of the spectrometer. ………..31
Fig.3.2. Two reflecting surfaces separated by a layer causing light interference. The dotted line indicates the first internal reflection .………..32
Fig.3.3. Example of a measurement ……….…..………….34
Fig.3.4. Three-dimensional representation of the CIELAB L*, a*, and b* coordinates……..35
Fig. 3.5. The photograph of the Liquid Crystal Analysis System……….…36
Fig.4.1. CLCs cell processes for our experiments .………...………...40
Fig.4.2. Chemical structure of chiral dopants ………..42
Fig. 4.3. Reflective spectra for 1153 mixtures for 555nm green. ………...……….44
Fig. 4.4. Reflective spectra for 1744 mixtures for 555nm green. ………...……….45
Fig.4.5. Blue shift measured in CIELAB color difference Eab for CLC mixtures under different driving voltage……….………...47
List of Tables
Table.4.1. parameters for spin-coating of alignment material .………...41
Table.4.2. Rubbing condition for PI alignment layer ………...41
Table.4.3. Properties of the synthesized cholesteric liquid crystals ……….……...43
Chapter 1
Introduction
1.1 Introduction of Liquid Crystals
For liquid crystals, they were observed that the optical properties of these materials changed discontinuously with increasing temperatures. In 1888, Friedrich Reinitzer [1] looked at the melting behavior of an organic substance related to cholesterol. Discussion with Lehmann [2] and others led to the identification of a new phase of matter called the liquid crystal phase. Today, liquid crystal displays (LCDs) have played an important role in flat panel display (FPD). The products of LCD cover all sizes of the display devices and are seen everywhere. Small applications include portable devices, such as mobile phones, digital cameras, handheld games, PDAs and GPS. For large applications, LCD technology aggressively fits into all branches, such as laptop screens, monitors, TV and high-definition TV (HDTV), etc. With the developments of various applications, liquid crystal display (LCD) technology has become the most important industry in Taiwan.
1.2 Liquid Crystal Phases
Liquid crystal phase is a state of matter that is intermediate between the crystalline solid and the amorphous liquid. It may also be viewed as a liquid in which an ordered arrangement of molecules exists. Liquid crystal arises under certain conditions in organic substance having sharply anisotropic molecules, that is, highly elongated (rod-like) molecules or flat (disc-like) molecules. Thus, a direct consequence resulted from the ordering of
Liquid crystal phases are formed by many different types of molecules which differ widely in their structure. Even through the types of molecules are complicated, they are often referred to as rod-like. Other shapes (discotic-like or sanidic-like) are not our major research in the thesis.
I
Nematic
The nematic liquid crystals have no positional order but the molecules tend to point toward a common axis (toward a same direction n). Nematic liquid crystals have the property of fluidity that is similar to isotropic, but they can be easily aligned by the external field such as electric or magnetic. In nematic phase only the long axis of molecule is more or less oriented, therefore it is optically uniaxial. The measurement of the degree of order in nematic phase is given by the so-called order parameter:
2
1
3 cos 1
2
S (1.1)
where θ is the angle between molecule’s long axis and direction n. When molecules aligned perfectly parallel, θ =0, and S will be equal to 1. When molecules aligned randomly, θ =random, S will be 0. The liquid crystal is usually between from 0.5 to 0.7.
II Chiral Nematic
The chiral nematic liquid crystal (N*) is also called cholesteric liquid crystal (CLC). Different with the traditional nematic material, CLC contains a chiral center in the nematic mesogenic molecules. If the twisting power is strong enough for chirality, CLC material is completed when the nematic and chiral dopant are mixed. The chirality produces an intermolecular force that leads to a twist between each layer.
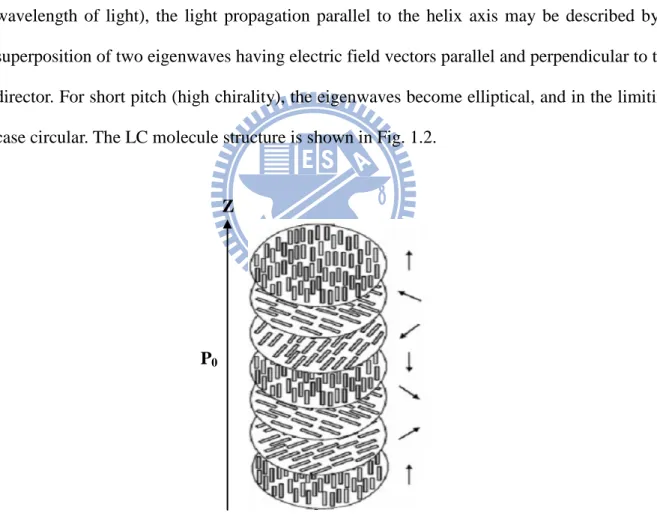
In various cholesteric systems, the period of the supermolecular structure (helical pitch) varies by a wide range. For the long pitch (low chirality) P >> λ (where λ is the wavelength of light), the light propagation parallel to the helix axis may be described by a superposition of two eigenwaves having electric field vectors parallel and perpendicular to the director. For short pitch (high chirality), the eigenwaves become elliptical, and in the limiting case circular. The LC molecule structure is shown in Fig. 1.2.
Fig. 1.2. Cholesteric liquid crystal molecule structure
P0
III Smectic
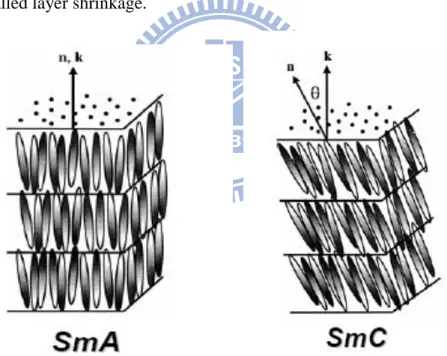
Material in the smectic phase shows an additional degree of positional order not present in nematic phase, which means molecules are ordered in layers (smectic layers). Motion of molecules is restricted to within these layers, and adjacent layers are observed to flow past each other. In smectic A phase, the layer spacing approximately equals to the length of molecule. In smectic C phase, molecules are arranged in layers as in smectic A phase, but the directors are tilted in a preferred angle respect to the layer normal. This indicates that the molecule is confined to a conical surface of which layer normal is the axis, and the cone is the so-called smectic cone. Because the molecules tilt when material entering SmC phase from SmA phase, the layer spacing in SmC phase would be smaller than that in SmA phase. This situation is called layer shrinkage.
IV Chiral Smectic C
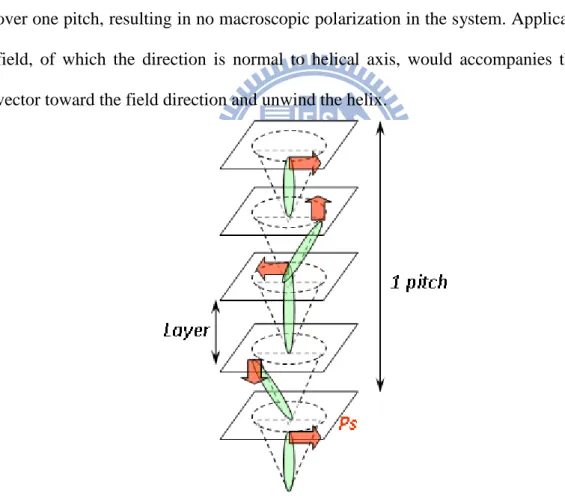
When chiral dopants are mixed with achiral molecules in smectic C phase, the Ferroelectric chiral smectic C phase (SmC*) is formed. When the molecules of mixture become chiral, successive smectic C layer shows a gradual change in the direction of tilt, so that the director processes about the z-axis from layer to layer.
In addition to bring about the helical structure, chirality would also induce a spontaneous polarization (Ps). This polarization vector is perpendicular to the director and lying on the plane of layer. In bulk SmC* material, freely developing helical structure, ferroelectricity does not show up since the polarization of all directions will average to zero over one pitch, resulting in no macroscopic polarization in the system. Application of electric field, of which the direction is normal to helical axis, would accompanies the polarization vector toward the field direction and unwind the helix.
1.3 Reflective LC Displays
I. Introduction Reflective LC Displays
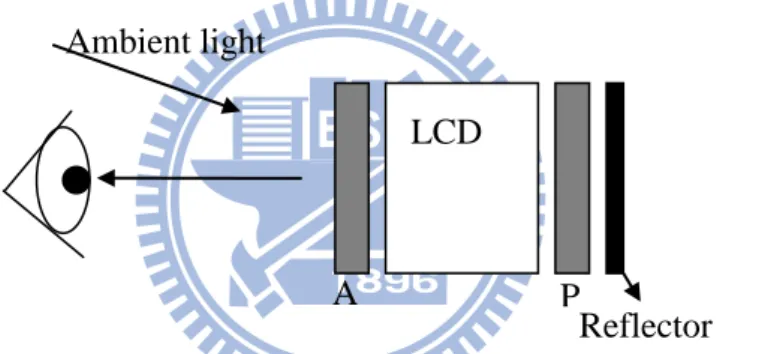
Reflective display is anon-emissive device from which the readout light is reflected. The reflective displays have several advantages, such as lower power consumption and sunlight readability. First, reflective panels do not require the backlight so that the power consumption and the weight are both reduced. Second, the reflective displays are shown in Fig. 1.5 can utilize the ambient light as the reading source. A reflector is preferably embedded in the inner side of the liquid crystal substrate. Since it is a reflective device, a brighter ambient light would lead to more vivid images. The basic operating principles of some reflective displays will present in the following sections [3].
Fig. 1.5. A reflective LCD using ambient light for displaying images
II. No Polarizer Reflective LC Displays
There are some LC displays do not require a polariser have been developed. They are polymer-dispersed LC display (PDLC), cholesteric LC display (Ch-LCD) and the guest-host (GH) display. The Ch-LCD would be discussed in the next chapter more detail.
LCD
A P Ambient light
PDLC
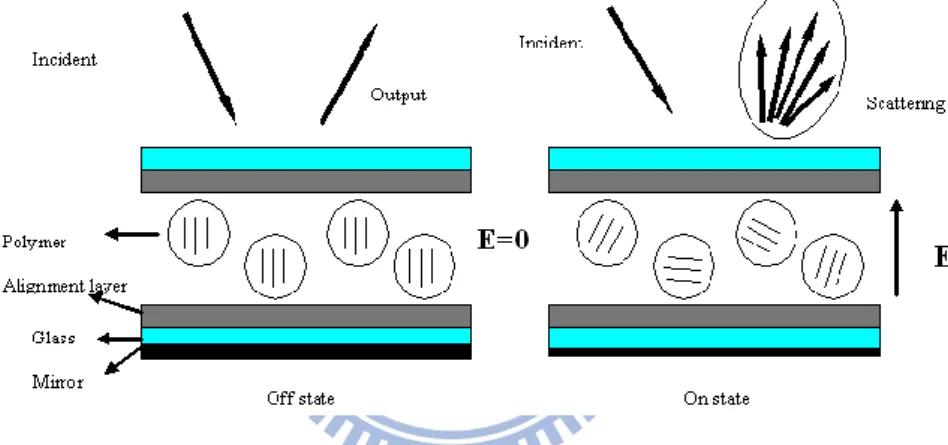
PDLC is based on light scattering induced by the refractive index doesn’t match. It is consist of liquid crystal droplets and the surrounding polymer matrices. Both normally black and normally white modes are demonstrated. In the normally black mode, the scatter light at zero electric field is due to the refractive index mismatch and the light is transmitted when the voltage is greater than the threshold voltage (Vth). On the other hand, the normally white
mode transmits light at zero electric field and the scatter light when the voltage is greater than the threshold voltage. The homeotropic alignment layer is used in the normally white mode for PDLC. The basic operating mode of normally white mode of PDLC is shown in Fig. 1.6.
Fig. 1.6. Basic operating mode for the normally white PDLC
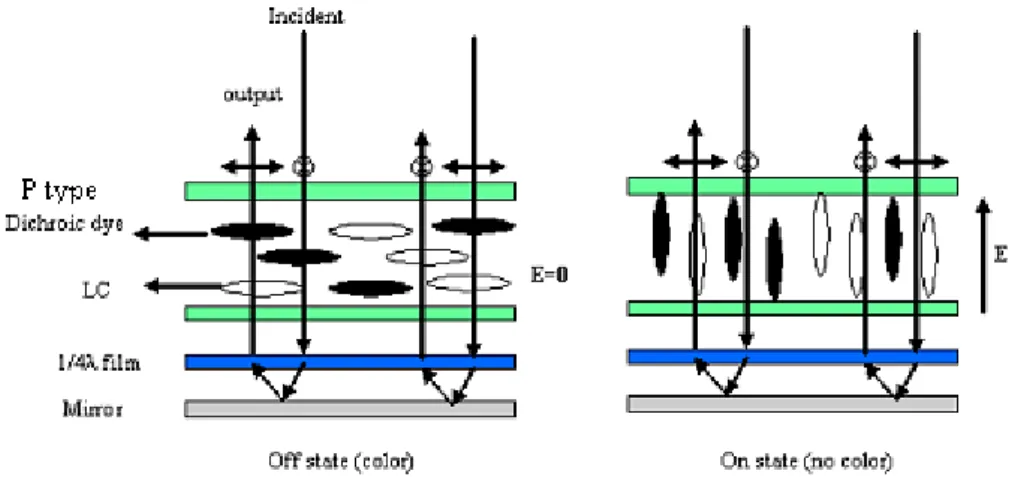
Guest-host display
The operating principle of the guest-host display is to utilize the absorption anisotropy of dichroic dye molecules doped in an aligned LC host. The host LC is highly transparent in the visible spectral region and the guest dyes strongly absorb one polarization of the incoming light and transmit the other. Now some special device configurations have been developed to avoid using any polarizer in a guest-host display. The operating mode of the no polarizer guest-host display is shown in Fig. 1.7.
Fig. 1.7. The operating mode for the no polarizer guest-host display
III. Single Polarizer Reflective LC Displays
A linear polarizer transmits about 45% of unpolarised light. For a reflective LCD, the light traverses the polarizer twice so that the maximum light throughput is limited to 38%. However, the single polarizer LCD has the advantages: the reflector eliminates parallax and enhances the reflectivity. On the other hand, the single polarizer LCD has a better contrast ratio than the non-polarizer LCD. In a reflective display, it is not easy to obtain a contrast ratio higher under ambient light conditions. The single-polarizer LCD offers a compromise between display brightness and contrast ratio, and has gradually become the mainstream approach.
IV. Two Polarizer Reflective LC Displays
This kind of operating mode is widely used when the LC displays are developed at first time. The common example of such this display is a wristwatch. A LC 90o twisted nematic (TN) cell is sandwiched between two crossed linear polarizing plates. The 90o TN cell has been widely used for transmission displays due to its high efficiency and weak color dispersion, high contrast ratio, and low operating voltage. However, when 90o TN cell is used for s reflective display sitting between the back substrate and the reflector not only reduces
brightness by around 28% but also causes parallax (double image) which limits the device resolution.
1.4 Motivation
When the CLCs cells are wanted to control the intensity of reflective light, it must be applied the field across the cells. It causes to the pitch contraction and the perturbations in the helix if the field parallel to the helical axis. Thus, the color of the reflective light would be changed and shifted to the shorter wavelengths. In order to solve this phenomenon, a study of molecular behaviors of CLCs is important for us to discover more information.
For the reason, the main objective of this thesis is to understand how the external field affects the helical axis, and propose a method based on these effects to enhance the stability of the helical axis. We infer the host dielectric anisotropic (ε) and birefringence (n) to influence the CLC’s behavior. Besides, a discussion of the results will be given in this thesis.
1.5 Organization of Thesis
In this thesis, the contents would be presented as following. Chapter 2 introduces the basic optical properties and the theories of field-induced wavelength shift for CLCs display. Chapter 3 describes the measurement instruments which are used in experiments. The experiment processes, results, characteristics measurements and performance evaluation including color shift, dielectric anisotropic, birefringence and spectrums that measured by spectrometer are in Chapter 4. Conclusions are finally drawn in Chapter 5 along with future research directions pointed out.
Chapter 2
Overview of Cholesteric Liquid Crystals
2.1 Introduction
The cholesteric (Ch) phase is a liquid crystal phase exhibited by doping chiral molecules. The cholesteric liquid crystals (CLCs) have a helical structure. In a plane perpendicular to the helical axis, the liquid crystal director axes n on the two neighboring plane are twisted slightly with respect to one another. The distance along the helical axis for the director to rotate 2π is called the pitch P0 as shown in Fig. 1.2. The unique optical
properties of the cholesteric phase are recognized by both Reinitzer and Lehmann at the time of their early investigations which culminated in the discovery of the liquid crystalline state. CLCs have a supermolecular periodic helical structure. The helical pitch of cholesteric can be the same order of magnitude as the wavelength of visible light, thus the Bragg reflection occurs. In this chapter, we consider the general optical properties of CLCs, such as the influences of chiral material, Bragg diffraction due to the periodical helical structure, and induced circular dichroism. The influences of external field are also discussed briefly in order to understand the phenomenon of color change effect.
2.2 Effect of Chiral Material
Chirality may cause an intrinsic helical structure of the director field as shown in Fig. 2.1. Instead of the uniform alignment of the director field occurring in the nematic phase, the respective chiral nematic phase exhibits a helical structure such like CLCs. For practical application, CLCs are usually formed by adding some chiral dopants into a nematic host. In the preparation of a CLCs mixture, the helical pitch is controlled by the concentration of the chiral material and the helical twisting power (HTP) of the chiral dopant. The HTP is defined
as: c HTP P 1 . (2.1)
Where c is the concentration of the chiral dopant in [weight %], and P is the helical pitch of the CLCs mixture in [μm]. Both the magnitude and sign of HTP are meaningful. It is customary to assign a positive HTP and a negative HTP to materials that exhibit the right-handed helix, and the left-handed helix, respectively. In practice, more than one chiral dopants are often added in a mixture to obtain desired properties. The pitch of the mixture with multiple dopants can be conveniently approximated by:
1 1 2 2 1 ... n n P c HTP c HTP c HTP . (2.2)
Where ci and HTPi are the concentration and helical twisting power of the ith chiral
dopant, respectively. For most cholesteric materials P is decreased with temperature:
dP 0
Fig. 2.1 Helical structures formed in chiral liquid crystal. (a) N* is the cholesteric phase, (b) BP is the blue phase, (c) SmC* is the chiral smectic-C, and (d) TGBA is the twist grain
boundary phase [4].
2.3 Optical Properties of Cholesteric Liquid Crystals
I. Textures in Cholesteric Liquid Crystals
For CLCs, several types of electro-optic effects have been observed which depending on the surface treatment (boundary conditions), the helical pitch P, the thickness to pitch ratio d/P, the dielectric anisotropy , the external field, and the frequency of the applied field. The CLCs textures influence the electro-optical behaviors when the textures are changed. The typical cholesteric textures for the orientation of the liquid crystal are shown in Fig. 2.2.
The CLCs with a given pitch, its texture is characterised by the direction of the helical axis. When the helical axis is perpendicular to the cell surface, the texture is called planar texture, as shown in Fig. 2.2(a). When, on the other hand, the helical axis is more or less parallel to the cell surface, the texture is called focal conic texture, as shown in Fig. 2.2(b). However, when the pitch of the CLCs are long and the helical axis is parallel to the cell surface, the texture is called fingerprint texture, as shown in Fig. 2.2(c).
texture and focal conic texture can be stable at zero field. For the CLCs with appositive dielectric anisotropy, the pitch can be elongated by applying an external field. When the applied field is larger than a critical field
2 1/ 2 22 0 0 Ec ( K ) P
, the helical structure is
unwound. If the field is parallel to the helical axis, the field-induced homeotropic texture is obtained, as shown in Fig. 2.2(d). In the CLCs, a transient planar texture forms during relaxation form the field- induced homeotropic texture. When the applied field is removed, the relaxation occurs that results in the formation of the transient planar texture.
(a) (b)
(c) (d)
Fig. 2.2 Schematic of the textures in CLCs: (a) planar, (b) focal conic, (c) fingerprint, and (d) isotropic or homeotropic cholesteric texture [4]
In order to study the electro-optic effects, the CLCs are usually sandwiched between two parallel plates with transparent ITO electrodes. Many optical properties of CLCs are
Bragg Reflection
When the CLCs are in the planar texture, the circularly polarized light is reflected by Bragg theory because of their chiral and periodic structure. Selective reflection occurs when the white light is incident on a cholesteric cell. In various cholesteric systems, the period of the helical pitch varies by a wide range (about 0.1μm to several hundred μm). For the long pitch (low concentration chirality) P >>λ (where λ is the wavelength of light), the light propagation parallel to the helical axis may be described by a superposition of two eigenwaves having electric field vectors parallel and perpendicular to the director. The long pitch case was studied for the first time by C. Mauguin [5] [6].
For the short pitch (high concentration chirality), when λ and P are comparable, the eigenwaves become elliptical and circular in the limiting case. It is well known that the selection reflection occurs in the limiting case due to the Bragg diffraction at a wavelength λ :
2( / 2) cosP
m
/navemn Pave cos. (2.3)Where m is the diffraction order, α is the angle of light incidence and reflection, and nave is the average refractive index of the CLC medium. There are some characteristics and
restrictions for the light propagating along the helical axis as following:
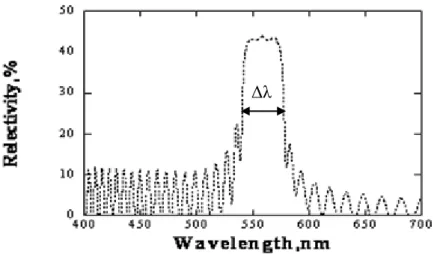
Only the first order Bragg reflection is possible in this case. This is confirmed by experimental results and theoretical considerations [7]. According to Eq. (2.3), the maximum selective reflection occurs at the wavelength
n Pave when the angle of incident light is zero, as shown in Fig. 2.3. The reflection peak is broad and has a bandwidth given byn P
, the refractive index oscillates between the ordinary refractive index no and the
extraordinary refractive index ne, where nneno is the birefringence of the nematic
reflection spectrum for CLCs. The reflected and transmitted light is circularly polarized. The circularly polarised light with the same handedness as the helical structure is reflected strongly because of the constructive interference of the light reflected from different positions, while circularly polarised light with the opposite handedness to the helical structure is not reflected because of the destructive interference of the light reflected from different positions. If the (normally) incident light is unpolarised, then the maximum reflection from the CLCs are 50%. 100% reflection can be achieved by stacking a left-handed cholesteric liquid crystal and a right-handed cholesteric liquid crystal, as shown in Fig. 2.5.
Fig. 2.4 Reflection spectrum is in the planar texture for CLCs
Fig.2.5. Reflection spectrum is in the planar texture for
stackingCLCs
II. Optical properties in different textures
CLCs exhibit three major texture. The state of a cholesteric liquid crystal is mainly determined by the surface anchoring and cell thickness, and the CLCs are easy to change its texture by adding electric or magnetic field. When an electric field applied to the CLCs cell, a texture transition occurs to minimize the free energy system. The texture transition is strongly associated with alignment layer, dielectric anisotropic, field amplitude, and the frequency
of the external field. The generally operating modes are described as following: (i) When the dielectric anisotropy>0:
Fig. 2.6 schematic diagram showing the possible transitions among the
cholesteric textures
Fig. 2.7 Schematic diagram of the states of the CLCs which dielectric anisotropy
is positive (a) Planar texture (b) Focal conic texture (c) Homeotropic texture
sufficiently high external electric field is applied cross the cell. In the focal conic texture, the helical axis is more or less parallel to the surface as shown in Fig. 2.7(b). Incident light is diffracted or scattered in the forward direction and the material in this state has less reflective color appearance. There are two possible mechanisms for the transition from the planar texture to the focal conic texture: oily streak and Helfrich deformation.
A microphotograph of the oily streak in a cholesteric liquid crystal is shown in Fig. 2.8. By bending the cholesteric layers, the electric energy is reduced as a sacrifice of the elastic energy, surface energy at the cell surface and wall energy in the vertical middle plane [8]. The transition is nucleation process. Sufficiently large oily streaks have to be created by irregularities, such as spacers, impurities and surface defect, in order to overcome the energy barrier. The applied field has to be higher than a threshold given by
0 0 2( ) 2 3 ( ) 4
V
ll[2( 2 1)
ln 2]
ll K oilyh
w
P
. (2.4)Where h is the cell thickness, w is the surface energy and K is the elastic constant. In deriving the equation. Because it is nucleation transition, the transition time is long. Once the applied voltage is above Voily, the oily streaks grow until the liquid crystal is switched to the
focal conic texture.
The Helfrich deformation is a two-dimensional undulation in the plane parallel to the cell surface [9, 10, 11], as shown in Fig. 2.9. The helical pitch is dilated in some regions and compressed in other regions. The energies involved are elastic energy, which increases with the amplitude of the undulation, and electrical energy, which decreases with the amplitude of the undulation. The electrical energy decrease of the electrical energy is able to compensate for an increase of the elastic energy, and therefore Helfrich deformation takes place. VHelfrich is
2 1 / 2 22 33 0 4 ( 2 ) 0
V
Helfrich K Kh
P
(2.5)Where k22 and k are elastic moduli for liquid crystal, and 33 0 is the permittivity. The wavelength of the undulation is λ=(2K33/K22)1/4(hP2)1/2. The threshold is pitch-dependent.
It is usually experimentally observed that VHelfrich is higher than Voily. If the applied voltage is
increased gradually, the oily streaks appear. If the voltage is increased abruptly above VHelfrich,
the Helfrich deformation dominates. Once the applied voltage is above VHelfrich, the amplitude
of the undulation increases with increasing voltage and the liquid crystal transforms into the focal conic texture.
It is noticed that CLCs exhibit two stable states. One of them is the planar state, and the other one is the focal conic state when the applied voltage is turned off. So the CLCs material has the bistable property that is an advantage for display technology. There are two ways to switch it back to planar texture. If the CLCs have appositive dielectric anisotropy, a high voltage has to be applied to switch it to the homeotropic texture, then it relaxes back to the planar texture. If the liquid crystal is a dual frequency material, exhibiting positive dielectric anisotropy at low-frequency voltages and negative dielectric anisotropy at high-frequency voltages, it can be switched back directly to the planar texture by applying a high-frequency voltage.
When the liquid crystal is in the focal conic texture and the externally applied electric field is increased, more and more of the liquid crystal molecules are aligned parallel to the field, and the pitch of the liquid crystal becomes longer. When the applied field is above a threshold E , the helical structure is unwound; the pitch become s infinitely long and the
Fig. 2.8 Microphotograph of the planar texture is transferred to the focal conic
texture when applied electric field
Fig. 2.9 Schematic diagram showing the structure of Helfrich deformation in a
plane perpendicular to the cell surface
Planar texture Oily streak and
(ii) When the dielectric anisotropy<0:
Fig. 2.10 Schematic diagram of the states of the CLCs which the dielectric
anisotropy is negative (a) Initial texture in the planar state (b) Initial texture in
the focal conic state (c) Planar texture (d) Homeotropic texture
No matter the CLCs cells are the in planar or focal conic state firstly as shown in Fig. 2.10(a) and (b), they have the same operating features when applied electric field. When an electric field E applied parallel to the axis h of the helix, it is a stable configuration and is shown in Fig. 2.10(c). In this instance the field only induces stabilization of the fluctuations. As a consequence, the order parameter is increased and displacement of the selective reflection maximum in the longwave spectral region (red shift) is observed.
Another situation is the electric field applied perpendicular to the axis of the helix as shown in Fig. 2.10(d). This situation was investigated experimentally and theoretically when the applied voltage V>>Vth [12]. The helix deformations and the threshold field are described
the by the same expression as in the case of CLCs with dielectric anisotropy
>0, E || h. It is a threshold voltage that the CLCs switch from the planar texture to focal conic texture.III. Gray Scale property of Cholesteric Liquid crystals
CLCs exhibit gray scale property because of their multi-domain structure if the planar texture and the focal conic texture are appeared at the same time. Starting from the imperfect planar texture, there are some domains can be switched to the focal conic texture when the threshold field is exceeded. The planar texture will be broken up into small domains and the incident is scattered [13, 14], as shown in Fig. 2.8. The reflective color will be decreased. Once a domain has been switched to the focal conic texture, it remains there even after the applied voltage is turned off because of the bistable property. The diagram of the gray scale states of a CLCs display is shown in Fig. 2.11. From right to left, the states are achieved by applying voltage pulses with increasing amplitude, and the reflectance decreases. The domain is around 10 μm and the domain structure cannot be observed by the naked eye. A cholesteric domain has only two stable states at zero field: it is either in the planar texture or in the focal conic texture. In a cholesteric display, it is observed that the domains in the planar texture have the same optical properties, independent of the states of other domains.
2.4 Reflective Color for CLCs
I. Controlling Cholesteric Color
In the preceding section, the theories of reflective color for CLCs are discussed generally. The cholesteric color is controlled by temperature, electric field, chiral doping ratio, etc. However, if the cholesteric color is easily changed by the temperature of the environment, it is not suitable for CLCs to be a communication of information [15].
The pitch length increases or decreases depending on the environment temperature because of the helical twisting power will be changed. It may cause the pitch length to become longer or shorter and lead the cholesteric reflected color to be different [16] [17]. Therefore, it is important that the CLCs material is not sensitive to the temperature and the color can be well controlled and fixed if it wants to use on the display applications.
The color change of the CLCs by electric fields was proposed by Harper, Hansen, and Schneeberger [18] [19]. It is also called the ETC (Electrically Tunable Color) [20]. In 1968, de Gennes [21] and Meyer [22] proposed that an electric or magnetic field perpendicular to helical axis of the CLCs would elongate the cholesteric pitch and thereby modifying the reflected color according to the Bragg’s Law [23]. It is observed that the color change from blue to red (redshift) with increasing electric field which applied perpendicular to the helical axis. In contrast, the effects observed from Harper change from red to blue (blueshift) with increasing electric field which applied parallel to the helical axis. The helical axis will be disturbed or unwind and resulting in an aligned homeotropic configuration finally.
II. Blueshift
The reflected color of the CLCs can be turned by varying the voltage across the cell. It is defined for the short pitch, a shift of the selective reflection peak to shorter wavelengths
shorter area. However, it is shown that the blueshift of the selection reflection results from a helix distortion of the texture, and it causes a larger angle with the incident light and the blueshift can be observed given by Eq. (2.3). The undesirable blue shift, however, emerges within this region. This phenomenon is associated with the LCs’ Δε and Δn based on the Helfrich deformation. In this thesis, the main purpose is to resolve the blueshift when the CLCs cells are driving. The blue shift has been modeled by Meyer .
2.5 Proposed Method to Resolve Blueshift
I. Effects of Electric Field on CLCs
Electric field acts on the anisotropic of the electric susceptibility exert torques within a LC which may compete with the elastic torques determining its internal structure. R. B. Meyer was proposed [22] [24] [25] and use the Frank’s theory of curvature elasticity in molecularly uniaxial LC is used and calculates the effects of external field on the helical structure of cholesteric materials.
Frank’s theory assumes that in cholesteric materials, only one molecular axis is aligned. They are equivalent to nematic materials on a small scale. A unit vector L is defined which is parallel to the axis of molecular alignment at any point. Frank derives an expression for the elastic free energy density in a cholesteric substance:
2 2 2 11 22 33 2 2 22 24
1
1
1
(
)
(
)
((
) )
2
2
2
1
(
)((
)
(
)
)
2
E og
k
L
k L
L q
k
L
L
k
k
L
L
L L
. (2.6)The k’s are the four independent elastic moduli, and P0 2
/qo is the pitch of the uniform helix which minimizes the elastic free energy. An L defines the helix in aright-handed (x, y, z) coordinate system is
L
( c o s
q
0z
,
s i n
q
0z
,
0
)
. (2.7)Since there is local cylindrical symmetry about L, the electric susceptibility has only two components, χ║and χ⊥, parallel and perpendicular to L, respectively. Assuming that the
system is neither ferroelectric nor ferromagnetic, the field (F) energy density is given by
1 1( ( ) ( ) )2
2 2
F ll
g FF F L FL , (2.8)
The general procedure for calculating the effect of the field is to find the structure, characterized by L as a function of position in the sample, which minimizes the total free energy.
G
sample(
g
E
g
F)
dV
(2.9) The field dependence of the structure is in general a perturbation of the helix at low fields, followed by complete breakdown of the helix at some critical field.Without following this general procedure, in simple situations, it can guess at the form of the perturbation in material far from surfaces. For example, consider the uniform helix of Eq. (2.7), and apply a F=Fx . Assuming that Lˆ z remains 0, the general form of the
In which f(0)0, and f has period /q. By varying the integral G, one can find the different equation for f. Solve this, one can then find the q which minimizes G for a given value of the field. The pitch of the helix can often be observed as the color of light reflected by the helical structure. The result in this case, to lowest order approximation, is
2 4 4 0 0 4 2 22
(
)
( )
2
[1
]
32(2 )
llF P
P
P
q
(2.11)As another example, apply to the uniform helix the field
F=Fz
ˆ
, and assume that the boundary condition will maintain the axis of the helix parallel to the field. Then a likely form of perturbation, if ll , is to rotate L at every point through an angle ρ toward the field;
L
( c o s
c o s
qz
,
c o s
s i n
qz
,
s i n
)
(2.12) In this case, the perturbation involves both bending and torsional strains, and depends on the relative magnitudes of the moduli of these strain, k33 and k22, respectively. If k33 ≧k22, there is no perturbation ( ρ = 0, q=q0 ) until a critical field Fc is reached at which complete
breakdown occurs ( ρ = π/2 ): 1/ 2 22 0
2
[
]
P
(
)
c llF
(2.13)For k33 > k22, the breakdown will involve hysteresis around this field value, since
configuration. For k33 < k22, there is a range of field for which ρ and q change continuously: c c
F
F
F
1/2 33 22 2 / 1 22 33)
(
)
(
. (2.14) In this range 33 1 / 2 0 22(
)
F
cP
P
F
. (2.15)Below this range, there is no perturbation, and above it there is complete breakdown.
II. Propose Method to Improvement Blueshift
In some cases, applying a electric field perpendicular to a thin film of the CLCs in the planar texture, rather than changing the wavelength of light reflected by the helical structure.
This case can be obtained by the present theory by assuming that
ll
in CLC’s nematic host and the reflective color will be uniform when CLCs are driving, withF=Fz . The ˆ diagram of electric susceptibility for LC molecular is shown in Fig. 2.12. Here we use the relative permittivity to substitution the electric susceptibility is given by:
e
r
pitch is difficult to decrease when CLCs are driving. This explains the blue shift is suppressed. According to the above explanations to lower the blueshift in CLCs, the host dielectric anisotropic is fine-tuned by mixing negative (ε = || 0) and positive nematic LCs. We infer that it can let the blue shift can be effectively minimized.
Fig. 2.12. The diagram of electric susceptibility for LC molecular
On the other hand, the color difference is also affected by light quantity which is shown in Fig. 3.9.. And light quantity is associated with reflective bandwidth(λ) in CLCs. And reflective bandwidth is proportional to birefringence (n). The low birefringence can get smaller color shift.
2.6 Summary
In this chapter, the basic optical properties are introduced and discussed for CLCs. It is known that different kind of nematic host is needed different operating method to drive it. Then, the statements focus on the gray scale property and color shift for CLCs because it’s the major framework in the experiments. After that, in order to resolve the problem of color shift, the method of doping negative nematic material is proposed according to the Meyer’s
explanation. It can let the blue shift to be effectively minimized when the CLCs cells are driving.
Chapter 3
Measurement Systems
3.1 Introduction
In this chapter, the measurement setups used in the experiments were described in the following section. The ε of each sample is measured by Liquid Crystal Analysis System 3 (LCAS 3). The cell gap of the empty cell and the spectra of the reflective light intensity and color shift can be measured by using a spectrometer (Perkin Elmer Lambda 950) and the incident light is normal to the sample. The samples were driven by a waveform generator (WFG 600) under 1KHz square wave and parallel to the helix axis.
3.2 Spectrometer
I. Introduction
The UV-VIS spectrometer. LAMBDA 950 (Perkin Elmer Lambda 950) is high performance between 185 nm and 3300 nm with the resolution ≦ 0.17 nm, and the spectrometer principles are double-beam, double mono-chromator, ratio recording spectrophotometers is as shown in Fig 3.1.
Fig. 3.1. The photograph of the spectrometer
The absorption, reflectance and transmittance of materials characterized with the LAMBDA 950 allows easy access to a wide variety of sampling accessories.
II. The Method for Cell Gap Measurement
For LC display, the thickness of a cell gap usually affects the optical properties. The cell gap of a LC display determines to a great extent the LCD’s electro-optical properties such as the contrast ratio, brightness, response time, and switching voltage, etc. It’s important to control the cell gap during the manufacturing process.
The concept of the measurement method is based on the interference pattern of the light reflected by a layer with two reflecting surfaces [26]. The situation diagram is shown in Fig. 3.2. It is defined that the coefficient of the reflection R1 as the ratio of the light reflected by surface 1 to the total incident light on surface 1. R2 is defined as the reflection coefficient of surface 2.
Fig. 3.2 Two reflecting surfaces separated by a layer causing light interference.
The dotted line indicates the first internal reflection [20]
If the total incident light is Icost and assume no absorption of light in surfaces 1 and 2, and then total reflected light R is
o
k k k k k t t R R R t R R
1 cos cos 1 1 1 2 1 1 1 . (3.1) Where 2 2/ 1 gap cn and t 2dgapngap2/c
1
0 , c is the speed of the light in vacuum, is the wavelength, dgap is the thickness of the layer, and ngap is the refractive index of the layer. In Eq. (3.1). For k1 are caused by internal reflections. Since R11 and R21, the magnitude of the cosine factors for k1 is much smaller than for k1.Therefore the internal reflections are neglected, so
ngapdgap t R R t R R 1cos 1 1 2 2cos 4 . (3.2)
2 R12
1 R1
2R2
2 2R1
1 R1
2R2 cos
4ngapdgap/
R (3.3)
The periodic term in Eq. (3.3) causes an interference pattern.The periodicity of the reflected interference spectrum determines the optical thickness of the cell gap, ngapdgap.
If the
1 and
2 are two wavelengths showing extrema in Eq. (3.3), then
4 /
1cos ngapdgap for
1 and
2. Therefore2 / 2ngapdgapk11 . (3.4) 2 / 2ngapdgap k22 . (3.5)
Where k1 and k2 are natural numbers. Suppose
1
2, thenx k
k2 1 . (3.6)
Where x is a natural number.
Based on Eq. (3.4), (3.5), and (3.6), it can write
1 2
2 1 4 x d ngap gap . (3.7)The value of x1 indicates the number of extrema in R
2 between the wavelengths
1
gap gapd
n . The sample data was shown in Fig.3.3 for 8.4um cell gap.
Fig.3.3. Example of a measurement
11 22
12 640.6 521.4 = =8406.26 8.4 4(640.6-521.4) 4 gap gap x n d nm m III. The method for color shift measurement
In our experiments, the major purpose is the color shift measurement. Because the color shift can not be expressed perfectly by the reflection spectrum with the light source, the color shift is expressed by E*ab. The color shift, E*ab, is determined by the spectrometer.
The color shift was measured in the CIE1976 LAB color space with standard D65 incident light in normal direction., because the lightness and chromaticity coordinates can represent the psychophysically perceived color shift [27]. The L*, a*, the b* are defined by
0 0 0 0 0 * 1/ 3 * 1/ 3 1/ 3 * 1/ 3 1/ 3
116( )
16
500{(
)
( )
}
200{( )
(
)
}
Y Y X Y X Y Y Z Y ZL
a
b
(3.8)Here, X, Y, Z are the object goal tristimulus values, and X0, Y0, Z0 are the tristimulus value of
the completely diffusely reflective surface. The L*, a*, and b* coordinates are used to construct a Cartesian color space as illustrated in Fig. 3.4.
Fig. 3.4. Three-dimensional representation of the CIELAB L*, a*, and b*
coordinates
The chromaticity coordinates difference, ab , is defined by:
(3.9)
The color difference, E*ab , is defined by:
(3.10)
Where L*, a*, and b* are the parameters of color differences when the CLCs
light red green yellow blue dark a* b*
b
*
a
*
L* *2 *2ab
a
b
* *2 *2 *2 abE
a
b
L
3.3 Liquid Crystal Analysis System 3
The Liquid Crystal Analysis System 3 (LCAS 3) is a fully automated system, consisting of proprietary hardware and software, for measuring the physical parameters of ferroelectric and nematic liquid crystal materials. In this thesis, the major purpose is the dielectric anisotropic measured for the different CLC’s nematic host is as shown in Fig 3.4.
Fig. 3.5. The photograph of the Liquid Crystal Analysis System
The LC cell can be considered a parallel-plate capacitor and follow the capacitor equation in the electromagnetic as defined:
d
S
C
. (3.10)where S is the area of the two parallel conducting plates separated by a uniform distance d ,
and is the dielectric constant. In a nematic single crystal, the static dielectric constants || and
are existed simultaneously. The LCAS 3 system will measure the capacitor value ofthe cell and calculate the dielectric constant (|| and
) value of the material. The measuring method is described as bellow:(a)The cable line and the appropriative cell for LCAS 3 will be adjusted at the first time in order to compensate for the parasitic impedances, capacitance and the resistance with the system, and then the capacitance of the empty cell CEMPTY is obtained and the value is important to the following experiments. If the step of the adjustment is not completed correctly, the experimental data that we measure will include the cell resistance and capacitance subtracted from the results, and the LCAS 3 will yield incorrect results.
(b)For measuring the parallel dielectric constant, the LCAS 3 will measure the C||
automatically. According to the Eq. (3.10), the value is determined as:
E M P T Y C C|| || . (3.11)
where C|| is the capacitance at V
th/Vrms = 0 and the CEMPTY is the measured empty cell
capacitance. It can also obtain the perpendicular dielectric constant || using the same method as defined: E M P T Y C C . (3.12)
perpendicular dielectric constant have no units.
(c) The dielectric anisotropy is the difference between the parallel and the perpendicular dielectric constants as given by:
|| . (3.13)
where it is possible that the value of the dielectric anisotropy is positive or negative. It depends on the character of the LC material.
The LCAS 3 system is useful for the LC technologies. It can measure almost kinds of parameters for LC material, such as specific resistivity, threshold voltage, dielectric anisotropy, elastic constant, voltage holding ratio, and rotational viscosity, etc.
Chapter 4
Experiments and Results
4.1 Introduction
Cholesteric Liquid Crystals (CLCs) have the severe color shift (blue shift)
phenomenon which depends on the applied voltage. It causes the selective reflection peak to shift to the shorter wavelength and the reflection color is turned. The display images will be distorted and it’s quality become much badly. This phenomenon is a serious hindrance to its potential display applications. In this study, the host dielectric anisotropic (ε) and
birefringence (n) were fine-tuned by mixing negative and positive nematic LCs based on the Helfrich deformation. The blue shift has been modeled by Meyer. The experimental results show that the blue shift can be effectively minimized.
As mentioned in the section 2.5, the
will become higher gradually with doping VA material. This method helps to increase the stability of helical axis when the CLCs cells are driving. Different mixing ratio of CLC’s host is discussed in this chapter and the best dopant ratio will be chosen to the balance of the gray scale property and the low color shift character.4.2 Display Cell preparation
The CLCs null cells are prepared by our-self in the clean room. We start to fabricate normal steps of the CLCs cell process. The detail steps to produce the prototype are listed below.
Fig. 4.1. CLCs cell processes for our experiments
(1) At first the ITO substrates were shocked 5 minute with detergent in the ultrasonic vibration equipment. Then, the substrates were rubbed with detergent by hands carefully, and then the substrates were washed with DI water until the water flowing along the surface smoothly. All cleaned substrates were put into a holder into DI water and shaken 30 minute by the ultrasonic. Then, the ITO substrates were blew with nitrogen gas to remove the DI water and then baked for 30 minutes at 110oC.
(2) The substrates were explored by UV-ozone for 20 minutes before coating the PI alignment layer for better adhesion of alignment layer. Put the clean ITO substrate into the
spin coater. Drop the solution of alignment material and wetting for 30 second (make sure the solution to cover the whole substrate), then spin. The parameters of spin-coating are shown as Table 4.1.
Table 4.1. parameters for spin-coating of alignment meterial
When the polyimide is coated, the substrates are needed to bake for 1 hour at 200oC. The polyimide (PIA-X201-G01) is from Chisso. According to the spin rate, the thickness of 50wt% polyimide is about 350Å .
(3) Using the rubbing machine to rub the substrates. Because of the material of alignment layer is the same to every substrate, the rubbing strength will not change to get the parameters. The rubbing strength is different depending on the LC material, alignment layer, and pretilt angle. The rubbing condition are shown as Table 4.2.
Table 4.2. Rubbing condition for PI alignment layer
PI alignment layer
Pile impression 0.2mm Rotation speed 500rpm Table advancing speed 7.3mm/s
5000rpm 60s 2st spin 5000rpm 60s 2st spin 800rpm 30s 1st spin 800rpm 30s 1st spin 0rpm 30s wetting 0rpm 30s wetting Speed Time Speed Time 50wt% Polyimide (Second) Solvent (First)
the top plate and press it. The cell was assembled such that the rubbing directions of the layers were anti-parallel. Next, because the UV glue is sensitive to the UV light, take the cell under a UV lamp for 5 minutes to cure the glues, and the empty cells are finished.
(5) The cell gap of the empty cells is measured by spectrometer (Perkin Elmer Lambda 950) using interferometric method. The details are explained in chapter 3.2.
(6) Heat up the CLCs material to isotropic and inject it from the edge of the cell by using capillarity until the CLCs is full of the gap. Then annealing and cooling the CLCs cells continuously in order to let the alignment of molecules much better.
(7) Soldering the wire at the ITO contact on the CLCs cells, and then the cells are available for measuring the electro-optical properties.
4. 3 Materials and CLCs Mixtures
Seven different nematic hosts from Merck were prepared to study the color shift in CLCs: pure LXX-06 1153, LXX-06 1153-60 mixtures, pure MLC 1744, MLC 1744-55 mixtures, MLC2048, BL036, and negative nematic LC (MJ-041937). The chiral dopant, DBD ( (s)-dioctan-2-yl biphenyl-4, 4'-dicarboxylate) (Fig 4.2), were mixed with nematic hosts to have a selective reflection at 555±5 nm.
COOC*H(CH3)C6H13 (s)+C6H13C*H(CH3)OOC
4.4 Properties of the Cholesteric Liquid Crystal Hosts
The Δn of MLC 2048, LXX-06 1153, MLC 1744, and BL036 are 0.2214, 0.1621, 0.0905, and 0.267, respectively. As a result, the reflection bandwidths are 62, 48, 30, and 72 nm, respectively. The narrower the reflective bandwidth, the higher the color saturation. The Δε of aforementioned LCs are 2.82, 11.1, 7.8 and 16.4, respectively. The ratio of VA in the LXX-06 1153-60 and MLC 1744-55 mixtures were 60wt% and 55wt%, respectively. They were prepared specially for Δε closed to 1 for evaluating the blue shift suppression [28, 29, 30] . And the ratio of MLC 2048, LXX-06 1153, LXX-06 1153-60, MLC 1744, MLC 1744-55 and BL036 for the selective reflection at 555±5 nm are 14.73, 15, 14.91, 14.48, 15.23 and 16.91wt%, respectively. The properties of nematic hosts properties were listed in Table 4.3.
Table 4.3. Properties of the synthesized cholesteric liquid crystals.
* Measured at 589 nm
Different values of ε show the different degrees of tilt or unwinding to the CLCs molecules when applying operating field. The different properties for each CLCs cells will be
4.5. Measurement form Spectrometer
I. Introduction
Spectrometer is usually used for CLCs displays measurement. It can cover all visible light wavelengths and help us to gauge the various properties in CLCs cells. combining with the waveform generator in order to observe the different characteristics for each CLC cell when applied electric field. The results will be discussed.
II. Observation from Spectrometer
The reflectance spectrums are measured in order to see the color shift and the gray scale properties for different mixing ratio of CLCs cells. The samples were driven by a waveform generator (WFG 600) under 1KHz square wave and parallel to the helix axis. The refractive oil (n=1.56) is used here to adjust the inner reflection which comes from the refractive index mismatch of CLCs and ITO glass. The results are shown in Fig. 4.3. and Fig. 4.4.
Fig. 4.3. Reflective spectra for 1153 mixtures for 555nm green
∆n=0.1621 ∆ε=11.1
∆n=0.1213 ∆ε=1.57
Colors start to be shift to blue and reflectance reduces severely after 8.6V and 20.8V in 1153 and 1153-60 mixtures, respectively. The blue shift is suppressed in 1153-60 is shown in Fig. 4.3. The blue shift is suppressed in order to avoid effect in the Δn for the Δn is not the same, the 1744 mixtures substitute.
Fig. 4.4. Reflective spectra for 1744 mixtures for 555nm green
Colors start to be shift to blue and reflectance reduces severely after 9.4V and 20.8V in 1744 and 1744-55, respectively. The blue shift is also suppressed when the Δn are the same in 0.09.
∆n=0.0905 ∆ε=7.8
∆n=0.0903 ∆ε=1.3
![Fig. 2.1 Helical structures formed in chiral liquid crystal. (a) N* is the cholesteric phase, (b) BP is the blue phase, (c) SmC* is the chiral smectic-C, and (d) TGB A is the twist grain boundary phase [4]](https://thumb-ap.123doks.com/thumbv2/9libinfo/8705143.199570/24.892.279.658.114.391/helical-structures-formed-crystal-cholesteric-chiral-smectic-boundary.webp)
![Fig. 2.2 Schematic of the textures in CLCs: (a) planar, (b) focal conic, (c) fingerprint, and (d) isotropic or homeotropic cholesteric texture [4]](https://thumb-ap.123doks.com/thumbv2/9libinfo/8705143.199570/25.892.127.743.471.827/schematic-textures-planar-fingerprint-isotropic-homeotropic-cholesteric-texture.webp)