Impact of Taiwan’s Integrated Prospective Payment Program on Prolonged Mechanical Ventilation: a Six-Year Nationwide Study
Chin-Jung Liu, RRT1,3;Chia-Chen Chu, RRT1,3,6; Wei Chen, MD1,7,8; Wei-Erh Cheng, MD1,4; Chuen-Ming Shih, MD, PhD1,4; Yuh-Show Tsai, PhD6;Chih-Hsin Muo, MS5, and Pei-Chun Chen, PhD2,5
Authors (Chu CC, Liu CJ, and Chen W contributed equally to this work. Address correspondence to:
Pei-Chun Chen Assistant Professor
Department of Public Health China Medical University Phone:886-4-22053366 and
Chih-Hsin Muo
Management Office for Health Data China Medical University Hospital 91 Hsueh-Shih Road. North District, Taichung City 40461, Taiwan
Phone: 886-4-22053366 ext.7901 Fax: 886-4-22078495
E-mail: [email protected]
Running title: Prospective payment for prolonged ventilation _____________________________
1Department of Respiratory Therapy;2Department of Public Health;China Medical University, Taichung, Taiwan
3Department of Respiratory Therapy;4Division of Pulmonary and Critical Care Medicine; 5Management Office for Health Data; China Medical University Hospital, Taichung, Taiwan 6Department of Biomedical Engineering, Chung Yuan Christian University, Jhongli, Taiwan 7Division of Pulmonary and Critical Care Medicine, Chia-Yi Christian Hospital, Chiayi, Taiwan
Abstract
Objective: The integrated prospective payment program (IPP), which encourages the integrated care of mechanically ventilated patients in order to reduce the heavy utilization of high-cost intensive care units, has been implemented by Taiwan’s Bureau of National Health Insurance since July 2000. The aim of this study was to assess the impact of this program on weaning, hospital stay, mortality and cost for patients requiring prolonged mechanical ventilation (PMV).
Design and setting: A dataset of 1,000,000 randomly selected insurance holders from the National Health Research Insurance, Taiwan, was retrospectively analyzed. 7,967 adult patients (age, > 17 years) who required PMV (duration, ≥ 21 days) were enrolled over a 6 year period.
Measurement and Main Results: There were 3275 patients on PMV before (1997-1999) and 4,692 patients on PMV after (2001-2003) the IPP implementation. After IPP
implementation, PMV was found to be required in patients with a significantly higher age, lower urbanization level, higher income status and a higher prevalence of neuromuscular disease (p<0.001). In-hospital mortality was similar between this two periods (17.2% before vs. 16.2% after, p=0.255); but the weaning rate was significantly lower in the latter period (68.1% vs. 64.2%, p<0.001). Total length of hospital stay (LOS, 75.3 d vs. 95.1 d, p<0.001), and duration of mechanical ventilation usage (55.8 d vs. 71.6 d, p<0.001) were both
patients was significantly lower after IPP implementation.
Conclusion: Implementations of the IPP program reduced the total hospitalization cost, increased the duration of mechanical ventilation usage and LOS, and reduced the weaning rate in PMV patients.
Key word: Integrated prospective payment, prolonged mechanical ventilation, health insurance, weaning
Introduction
The rapid increase in the number of patients requiring prolonged mechanical ventilation (PMV) has attracted much attention in the healthcare system because this population is a very resource-intensive inpatient subgroup.1-2Due to the aging population, increased acuity and severity of disease, and advances in disease management, the shortage of intensive care unit (ICU) beds at hospitals has emerged as a critical issue.2-3 Efforts have been made to move patients who need ventilator support beyond the acute stage but who are less critically ill into settings other than ICUs, including specialized respiratory care units, intermediate- and long-term care facilities.4-5
A PMV was defined as 21 consecutive days of invasive mechanical ventilation with over six hours per day in the US1; the same criterion applies in Taiwan.Experiences in the United States reveal that in 23 long-term care hospitals, more than half of post-ICU
ventilator-dependent patients were successfully weaned from PMV.6 Studies have found that transferring patients from the ICU to a regional weaning center or chronic
ventilator-dependent unit improves survival after discharge4 and reduced costs7-8 However, these studies of cost analysis are often conducted in a single care center or unit, limiting the ability to generalize the results across all centers . Furthermore, cost and resource utilization in healthcare are strongly associated with patient characteristics and comorbidity. For patients with PMV cost estimations that take these factors into consideration are rare.
(NHI) that provided coverage to 99% of the population by 2007.9 In July 2000, to manage the shortage of ICU beds and to control the use of medical resources; the Bureau of NHI
implemented an Integrated Prospective Payment (IPP) program for patients who need PMV. This payment program is an attempt to encourage large-scale hospitals, medical centers and regional hospitals to establish a respiratory care center (RCC), that provide a program for the aggressive weaning of ventilator support for hemodynamically stable patients who are receiving PMV . This integrated payment plan covers 4 types of mechanical ventilator care: fee-for-service ICU care (for up to 21 days), per-diem RCC (for up to < 42 days), capitation respiratory care ward (RCW), and per- month home ventilation service.10
However, studies focusing on the impact of the IPP program on patients requiring PMV are limited. This study aimed to determine if IPP program has beneficial effects on PMV patients in theNHI research dataset in Taiwan. The major endpoint of analysis include hospitalization costs, length of hosptial stay, weaning rate, and mortality rate both before and after IPP implementation. The beneficial means for this study that Integrated Prospective Payment Program on Prolonged Mechanical Ventilation patients should reduce the heavy utilization of high‐cost intensive care units.
Materials and methods Data source and subjects
This study used a data subset of the research database established by the National Health Research Institute (NHRI). The dataset contains all claims data for 1,000,000 subjects
randomly selected from entire population of 23,000,000 insured citizens. To protect patients’ privacy, personal identification was encrypted before the release of the database for our use.
With NHRI approval, this research dataset was used to select study subjects and to obtain health care information, including demographic (e.g. sex, birth date, residential district or township, income, and occupation), inpatient care utilization (e.g. dates of admission and discharge, diagnoses, medical expenses, and discharge disposition), and hospital information (e.g. accreditation level, and location).
Integrated Prospective Payment (IPP) program
Due to limited resources and after discussions with the physician and patient’s family, patients from Taiwan were routinely transferred to respiratory care units. In 2000, the NHI initiated the IPP, also called Integrative Delivery Services (IDS), which guarantees ICU care resources for the first 21 days, followed by transfer to a respiratory care center (RCC) for 42 days of specialized care plus weaning training, followed by transfer to a respiratory care ward (RCW) and/or home care services. As a result, lower-level–specialized-care facilities have been developed to manage PMV patients at a reduced cost, thus making many ICU wards available for other acute care services.11 The IPP system was the first integrated, near-total insurance coverage, gradual respiratory care reduction system established in the world. The purpose of the RCC and RCW is to manage patients who require specialized respiratory care but who no longer need ICU monitoring, thereby improving the implementation of specialized care and reducing wastage of medical resources. The difference between RCC and RCW are, the RCC is a ventilator
weaning center and the RCW is a ventilator‐dependent patient ward for long‐term care.
Criteria for identifying new PMV patients
Some PMV patients used mechanical machines intermittently and had multiple PMV episodes. Our research focused on patients who had PMV episodes between 1997 and 2003 and were in remission for at least 1 year (no mechanical ventilation for 365 days; i.e., admissions linked with use of 57001B, 57002B, or 57023B, including patients who both did and did not satisfy PMV diagnostic criteria). The sample selection reflects the project’s focus on conditions and outcomes among PMV patients whose earlier health was good enough for them to remain free from MV for at least 1 year before requiring PMV. We suggest that findings from such an investigation can provide more reference information for physicians and policy makers for making decisions related to clinical practice and healthcare resource allocation compared to that provided by examination of PMV patients who have been using MV services continuously or intermittently for months or even years. Few of our patients who met this criterion had more than 1 PMV episode. To simplify analysis without losing generalizability, our analysis only included each patient’s first PMV episode in this period. On the twenty-first day after a PMV episode, we defined the patient as a new PMV patient for that year, including that day. No patient was included in both periods.
We identified patients with a history of hospitalization for respiratory failure
code 518.81), who were treated with daily mechanical ventilator support. To evaluate the influence of the IPP program on patient outcomes, patients with a first hospitalization with PMV (index hospitalization) during the 3-year periods before (1997-1999) and after (2001-2003) IPP program implementation were selected. Data analysis was confined to the same length of time for the 2 study periods to reduce incomparability due to variation in long-term patient ventilation management. Patients aged <17 years old were excluded. Taiwan’s NHI defined a PMV as 21 consecutive days of invasive mechanical ventilation over 6 hours per day, the same criteria applied in the US.1
Patients’ residential areas were grouped into low, moderate, and high levels of urbanization, on the basis of the population density (persons/km2) of each township and district in which a hospital was located in Taiwan.12 In multiple liner regression models, the urbanization levels of hospitals was used a covariate instead of patients. Urbanization was classified as low if the results were in the third quartile of population density; high if the results were in the fourth quartile of population density. To account for the influence of comorbidities on patient outcome, we calculated the Charlson co-morbidity index (Appendix),13 resulting in a total score emcompassing a range of comorbid condtions weighted by mortality risk.
Costs, length of stay at hospital and the survival
Length of hospital stay (LOS) was defined as the length between admission and discharge. The daily cost of hospitalization was calculated using the total medical costs for
an entire admission divided by LOS (USD 1=32 NTD). Using the NHI definition, weaning success was considered as termination of MV for at least 5 days before the last day of follow-up. The follow-up period started during the index hospitalization, from the date of initial mechanical ventilator usage until the date of cancellation of NHI or December 31, 2008, whichever came first.
Statistical analysis
From 1997 to 2003, patients on PMV for the first time and admitted to the ICU, RCC or RCW were identified. The sociodemographic characteristics, the hospitals accreditation levels and the Charlson comorbidity index score, a total score emcompassing a range of comorbid condtions weighted based on mortality risk,13were compared between patients receiving PMV in 1997-1999 and in 2001-2003. The Charlson Co‐morbidity Index contains 19 categories of comorbidity, which are primarily defined using ICD‐9‐CM diagnoses codes. Each category has an associated weight, which is based on the adjusted risk of one-year mortality. The overall comorbidity score reflects the cumulative increased likelihood of one‐ year mortality; the higher the score, the more severe the burden of comorbidity.14
Urbanization level of the hospitals was grouped into low, moderate, and high levels, on the basis of the population density (persons/km2) of each township and district in which a hospital was located in Taiwan.12 Urbanization was classified as low if the population density was in the third quartile of its distribution; high if the population density was in the fourth quartile.
Outcomes, including mean days on MV, mean LOS, cost of hospitalization, discharge disposition, and rate of weaning success was compared between the 2 study periods.
Differences were examined using Chi-square test (Fisher’s exact test for small sample size) for categorical variables, and Students t-test (Mann-Whitney U test for skewed distribution) for continuous variables. Multiple linear regression models were applied to determine whether hospitalizations with PMV during 2001-2003, compared to that during 1997-1999, were associated with reduction in cost and LOS. The variables included for adjustment were age, sex, level of urbanization, occupation, insured income, accreditation level of hospitals, Charlson comorbidity index score and discharge disposition, which may be associated with cost and LOS for hospitalization. All analysis were done using SAS software version 9.1 (SAS Institute Inc., Carey, NC). All statistical tests were two-tailed. A p value of less than 0.05 was considered significant.
Results
In 1997, the number of total beneficiaries was 20,492,317, including 11,674,073 primary policyholders and 8,818,244 dependents. Male patients accounted for 10,313,824 (50.3%) and female patients for 10,178,493 (49.7%). The mean age of the patients was 32.7 years, and patients aged >60 years accounted for 12.49% of the total study population. In 2003, the number of total beneficiaries was 21,984,415, including 12,878,979 primary policyholders and 9,105,436 dependents. Male patients accounted for 10,938,048 (49.8%),
and female patients for 11,046,367 (50.2%). The mean age of the patients was 34.5 years, and patients aged >60 years accounted for 13.01% of the total study population.
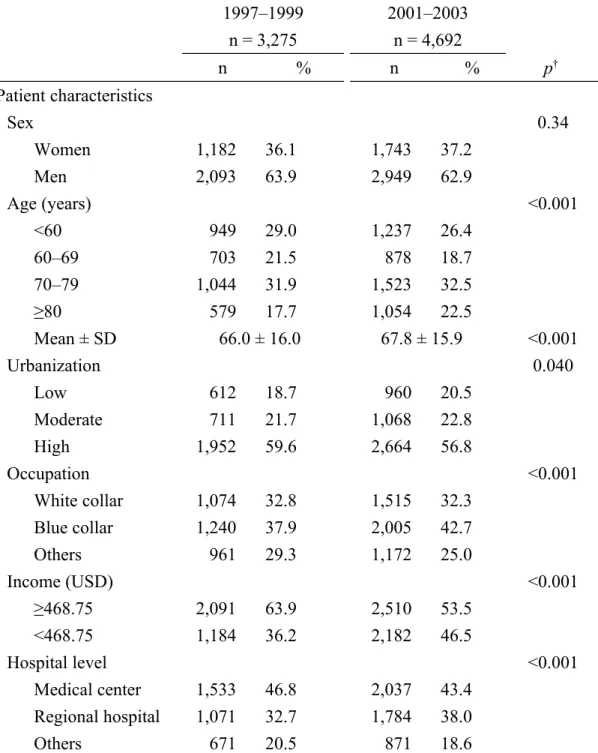
During the periods 1997-1999 and 2001-2003 periods, there were 3,275 and 4,692 inpatients requiring PMV, respectively (Table 1). Compared to patients identified in first period (1997-1999), patients requiring PMV during the second period (2001-2003) were older (mean age, 67.8 years vs. 66.0 years, p<0.001); and were more likely to reside in low-urbanized areas and to be blue-collar workers, and to have lower monthly income. Relative to the first period, the second period had more patients receiving PMV admitted to regional hospitals rather than medical centers (Table 1).
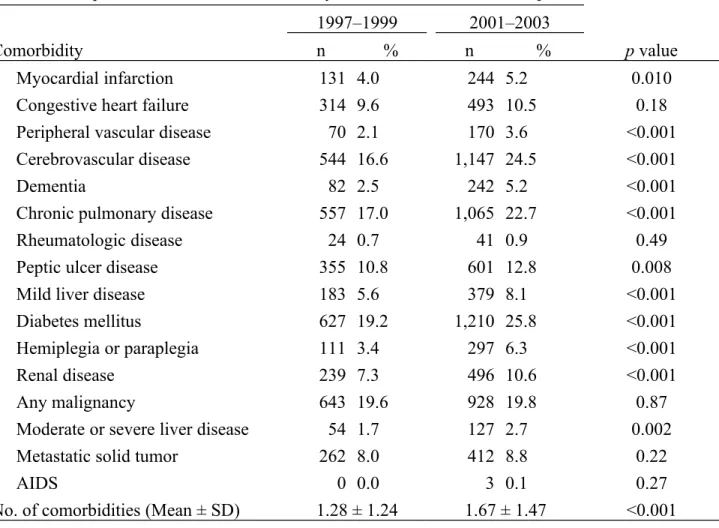
Patients on PMV in the second period had higher mean Charlson comorbidity indices (1.67 vs. 1.28, p<0.001). They were more likely to be diagnosed with more comorbidities, including cerebro- and cardiovascular diseases, dementia, chronic pulmonary disease, peptic ulcer disease, liver disease, diabetes, hemi- or paraplegia and renal disease (Table 2). Patients in second period had significant higher incidence of neuromuscular disease, including cerebrovascular disease (16.6% vs. 24.5%), dementia (2.5% vs. 5.2%), and hemiplegia or paraplegia (3.4% vs. 6.3%). Malignancy was the leading comorbidity in 1997-1999, whereas diabetes mellitus was the most common in the latter period.
Compared to the first period, the second period had significantly higher average MV days and LOS (75.3 days vs. 95.1 days, p<0.001; Table 3). As expected, the mean number of ICU days decreased from 55.7 + 92.8 in 1997-1999 to 21.4 + 12.7 days in2001-2003 The
average cost per admission was reduce by USD 500 (USD 8,532 in the first period vs. 8,031 in the second, p<0.001). In-hospital mortality of patients on PMV was not significantly different between the 2 periods (17.2% in 1997-1999 and 16.2% in 2001-2003, p=0.255). However, the rate of weaning success decreased from 68.1% in the first study period to 64.2% in the second study period (p<0.001).
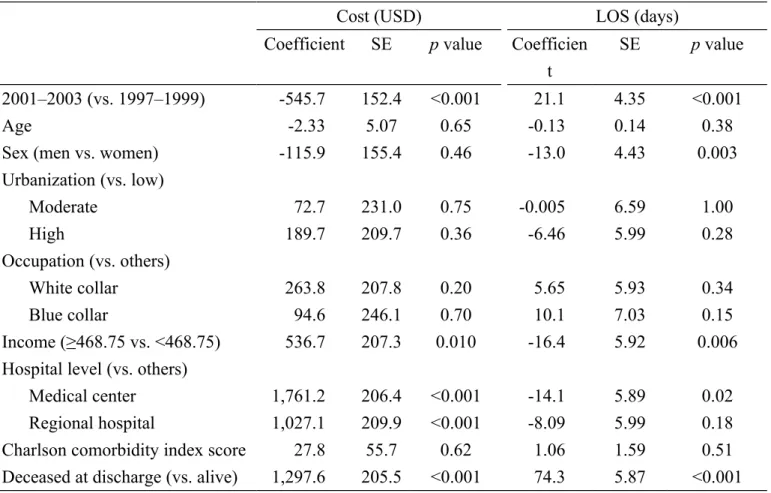
In the multiple linear regression analysis, inpatients receiving PMV in 2001-2003 had lower hospitalization costs (USD 547.70, p<0.0001) and longer LOS (21.1 days, p<0.001) (Table 4).
Discussion
This was the first study to assess the effect of the NHI program on patients requiring PMV in Taiwan. A nationwide representative database was used to compare the changes in clinical outcome and medical resource utilization before and after the two 3-year periods. After the IPP implementation, both the total LOS from the first to the second period (75.3 vs. 95.1 d, p < 0.001) and the duration of MV usage (55.8 vs. 71.6 d, p < 0.001) significantly increased. However, total hospitalization cost was significantly lower after the IPP implementation. According to the official report of NHI, the average MV day per patient, length of ICU stay (36.8 in 1997 vs. 33.3 d in 2005), and RCC mortality rate (27% in 1997 vs. 9.4% in 2005) decreased, whereas RCC (30.8% in 1997 vs. 44.7% in 2005) and RCW (5% in 1997 vs. 12.8% in 2005) weaning rates increased after the IPP implementation.15 However, this data focused only on certain stages of PMV patients. The current study provides a complete view
of this process, showing the decreased total cost and increased number of MV days, LOS, and survival months of the PMV patients.
Some limitations are present in this study. First, one of the important limitations for the before-and-after comparison study is the potential bias due to temporal trend in some factors such as mortality, and changes in reimbursement system, which may explain the observed differences between study periods. However, during this period the NHI of Taiwan had not made change in reimbursement system. Second, clinically significant differences were observed between the patients on PMV in the two periods. Although we have adjusted for demographic characteristics and comorbid medical conditions in regression analysis for cost and LOS, residual confounding due to unmeasured factors may explain certain degree of the observed effect. For example, the claims data of the NHI do not contain information on diseases severity such as the acute physiology and chronic health evaluation score, which is an accurate indicator of the case severity in the ICU population.16 Thus, we were unable to take into account for the influence of disease severity. Last, the intervention made by the national health system is specific to Taiwan, which limits the generalizability for other health care systems.
Previous studies reported that transferring PMV patients from the ICU to a long-term care facility is more cost effective.8,17,18 MV is required for acute or chronic respiratory failure patients,19–20 with an approximately 41% weaning rate in chronic obstructive pulmonary disease patients.21 ICU patients were reported to have a 31% mortality rate19 and 5%–25%
PMV rate.1 Thus, patients requiring MV are increasing annually. The NHI encouraged transferring care to hospital-affiliated respiratory care centers to solve the shortage of ICU beds and aggressively withdraw mechanical ventilation in patients with relatively stable condition, thereby encouraging a step-down to respiratory care ward or home care in PMV patients. After implementing the IPP program, more ICU beds became available.17
Fortunately, the PMV rate did not increase; it was 28%–34% before the IPP implementation and 29%–34% after. Nonetheless, the PMV rate was higher and the mortality rate was lower than those reported in other countries.1
Univariate analyses in this study showed that the characteristics of patients were different between 1997-1999 and 2001-2003. The PMV patients in 2001-2003 were older, and more likely to be from low-urbanized areas, blue-collared workers, and had lower monthly incomes, compared with the PMV patients in 1997-1999. This difference may be associated with the increase in RCCs and RCWs in the countryside, where greater number of older people resides, and patients and their families have a relatively lower socioeconomic status. Consistently, the results of this study revealed that PMV patients after the IPP
implementation are more commonly admitted to regional hospitals, rather than medical centers.
We found that the cardiovascular disease (myocardial infarction and peripheral vascular disease), cerebrovascular disease, peptic ulcer and liver disease, diabetes mellitus, hemiplegia or paraplegia, and renal disease between the two periods significantly increased. This
prevalence may be related to the family’s attitude toward the patients. In addition, patients on PMV in the second period were older; this could be another possible explanation for the higher prevalence of comorbidity and severity of illness in this period. Although the prevalence of some comorbidities changed (patients on PMV in the second period were older), in both study periods, the most common comorbidities in patients requiring PMV are infectious diseases, cardiovascular and heart-related diseases, and diabetes mellitus. This observation is consistent with the findings of previous reports.6
In conclusion, the Taiwanese IPP program for PMV patients may redistribute medical resources and reduce hospitalization costs and weaning rate. However, this program increases the duration of MV use and LOS.
Acknowledgement
This study is based in part on data from the National Health Insurance Research Database provided by the Bureau of National Health Insurance, Department of Health and managed by National Health Research Institutes (Registered number 96115). The interpretation and conclusions contained herein do not represent those of Bureau of National Health Insurance, Department of Health or National Health Research Institutes.
This study was supported by the National Sciences Council, Executive Yuan (grant numbers NSC 95-2625-Z-039-002, NSC 96-2625-Z-039-003, NSC 97-2625-M-039-003, NSC 98-2621-M-039-001), China Medical University Hospital (grant number 1MS1, DMR-96-116, DMR-96-117) and Taiwan Department of Health Clinical Trial and Research Center for Excellence (grant number DOH99-TD-B-111-004).
REFERENCES
1. MacIntyre, N.R., et al., Management of patients requiring prolonged
mechanical ventilation: report of a NAMDRC consensus conference. Chest,
2005. 128(6): p. 3937-54.
2. Zilberberg, M.D., et al., Prolonged acute mechanical ventilation, hospital
resource utilization, and mortality in the United States. Crit Care Med, 2008.
36(3): p. 724-30.
3. Stoller, J.K., Caring for the hospitalized ventilator-dependent patient outside
the ICU: united and stand, or divided and fall? Cleve Clin J Med, 1991. 58(6):
p. 537-9.
4. Scheinhorn, D.J., et al., Post-ICU mechanical ventilation: treatment of 1,123
patients at a regional weaning center. Chest, 1997. 111(6): p. 1654-9.
5. Scheinhorn, D.J., et al., Post-ICU weaning from mechanical ventilation: the
role of long-term facilities. Chest, 2001. 120(6 Suppl): p. 482S-4S.
6. Scheinhorn, D.J., et al., Post-ICU mechanical ventilation at 23 long-term care
hospitals: a multicenter outcomes study. Chest, 2007. 131(1): p. 85-93.
7. Seneff, M.G., et al., The impact of long-term acute-care facilities on the
outcome and cost of care for patients undergoing prolonged mechanical ventilation. Crit Care Med, 2000. 28(2): p. 342-50.
8. Gracey, D.R., D.C. Hardy, and G.E. Koenig, The chronic ventilator-dependent
unit: a lower-cost alternative to intensive care. Mayo Clin Proc, 2000. 75(5): p.
445-9.
9. Nathional Healthe Insurance Research Database. 2010/7/4]; Available from:
http://w3.nhri.org.tw/nhird/brief_01.htm.
10. Cheng, S.H., I.S. Jan, and P.C. Liu, The soaring mechanic ventilator
utilization under a universal health insurance in Taiwan. Health Policy, 2008.
86(2-3): p. 288-94.
11. Su, J., et al., Experience with a step-down respiratory care center at a tertiary
referral medical center in Taiwan. J Crit Care, 2006. 21(2): p. 156-61.
12.
Department of Statics Ministry of the Interior, The Executive Yuan of the
Republic of China
,statistics
, Editor:http://sowf.moi.gov.tw/stat/year/list.htm
.13. Deyo, R.A., D.C. Cherkin, and M.A. Ciol, Adapting a clinical comorbidity index
for use with ICD-9-CM administrative databases. J Clin Epidemiol, 1992.
45(6): p. 613-9.
14. Charlson ME, Pompei P, Ales KL, MacKenzie CR. A new method of classifying prognostic comorbidity in longitudinal studies: development and validation. J Chronic Dis 1987;40(5):373‐383. [Abstract]
15.
Kiekkas, P., et al., Fever and standard monitoring parameters of ICU patients: adescriptive study. Intensive Crit Care Nurs, 2007. 23(5): p. 281-8.
16. Seneff, M.G., et al., Predicting the duration of mechanical ventilation. The
importance of disease and patient characteristics. Chest, 1996. 110(2): p.
469-79.
17. Nevins, M.L. and S.K. Epstein, Weaning from prolonged mechanical
ventilation. Clin Chest Med, 2001. 22(1): p. 13-33.
18. Seneff, M.G., et al., The impact of long-term acute-care facilities on the
outcome and cost of care for patients undergoing prolonged mechanical ventilation. Critical Care Medicine, 2000. 28(2): p. 342-350.
19. MacIntyre, N.R., Evidence-based ventilator weaning and discontinuation. Respir Care, 2004. 49(7): p. 830-6.
20. Esteban, A., et al., Characteristics and outcomes in adult patients receiving
mechanical ventilation a 28-day international study. 2002, Am Med Assoc. p.
345-355.
21. Esteban, A., et al., Modes of mechanical ventilation and weaning. A national
survey of Spanish hospitals. The Spanish Lung Failure Collaborative Group.
Table 1. Comparisons of demographic characteristics between the 2 periods before and after implementation of the integrated prospective payment program
1997–1999 n = 3,275 2001–2003 n = 4,692 n % n % p† Patient characteristics Sex 0.34 Women 1,182 36.1 1,743 37.2 Men 2,093 63.9 2,949 62.9 Age (years) <0.001 <60 949 29.0 1,237 26.4 60–69 703 21.5 878 18.7 70–79 1,044 31.9 1,523 32.5 ≥80 579 17.7 1,054 22.5 Mean ± SD 66.0 ± 16.0 67.8 ± 15.9 <0.001 Urbanization 0.040 Low 612 18.7 960 20.5 Moderate 711 21.7 1,068 22.8 High 1,952 59.6 2,664 56.8 Occupation <0.001 White collar 1,074 32.8 1,515 32.3 Blue collar 1,240 37.9 2,005 42.7 Others 961 29.3 1,172 25.0 Income (USD) <0.001 ≥468.75 2,091 63.9 2,510 53.5 <468.75 1,184 36.2 2,182 46.5 Hospital level <0.001 Medical center 1,533 46.8 2,037 43.4 Regional hospital 1,071 32.7 1,784 38.0 Others 671 20.5 871 18.6
†Chi-square test, Fisher test, or t test.
Urbanization: low, first and second quartile of population density; moderate, third quartile of population density; high, fourth quartile of population density.
Table 2. Comparisons of Charlson comorbidity index scores between the 2 periods 1997–1999 2001–2003
Comorbidity n % n % p value
Myocardial infarction 131 4.0 244 5.2 0.010
Congestive heart failure 314 9.6 493 10.5 0.18
Peripheral vascular disease 70 2.1 170 3.6 <0.001
Cerebrovascular disease 544 16.6 1,147 24.5 <0.001
Dementia 82 2.5 242 5.2 <0.001
Chronic pulmonary disease 557 17.0 1,065 22.7 <0.001
Rheumatologic disease 24 0.7 41 0.9 0.49
Peptic ulcer disease 355 10.8 601 12.8 0.008
Mild liver disease 183 5.6 379 8.1 <0.001
Diabetes mellitus 627 19.2 1,210 25.8 <0.001
Hemiplegia or paraplegia 111 3.4 297 6.3 <0.001
Renal disease 239 7.3 496 10.6 <0.001
Any malignancy 643 19.6 928 19.8 0.87
Moderate or severe liver disease 54 1.7 127 2.7 0.002
Metastatic solid tumor 262 8.0 412 8.8 0.22
AIDS 0 0.0 3 0.1 0.27
Table 3. The mean costs of hospitalization, LOS, and weaning rates during the 2 time periods.
1997–1999 (n = 3275)
2001–2003 (n = 4,692)
No. Mean SD Median No. Mean SD Median p value MV days All 3,275 55.8 93.1 37.0 4,692 71.6 153.0 37.0 <0.001 ICU 3,275 55.7 92.8 37.0 4,692 21.4 12.7 19.0 <0.001* RCC 1 22.0 22.0 293 47.5 68.0 29.0 RCW 4 10.3 7.5 9.5 165 68.6 150.0 35.0 LOS 3,275 75.3 159.7 42.0 4,692 95.1 207.9 43.0 <0.001 Cost (USD) 3,275 8,531.7 6,712.8 7,070.1 4,692 8,031.0 6,540.6 6,761.1 <0.001 No. % No. % Mortality at discharge 562 17.2 760 16.2 0.255 Weaning success 2,231 68.1 3,013 64.2 <0.001
Abbreviations: ICU, intensive care unit; RCC, respiratory care center; RCW, respiratory care ward; LOS, length of hospital stay.
Table 4. Multiple linear regression analysis for cost (in USD) of hospital care and LOS for PMV.
Cost (USD) LOS (days)
Coefficient SE p value Coefficien t
SE p value
2001–2003 (vs. 1997–1999) -545.7 152.4 <0.001 21.1 4.35 <0.001
Age -2.33 5.07 0.65 -0.13 0.14 0.38
Sex (men vs. women) -115.9 155.4 0.46 -13.0 4.43 0.003
Urbanization (vs. low) Moderate 72.7 231.0 0.75 -0.005 6.59 1.00 High 189.7 209.7 0.36 -6.46 5.99 0.28 Occupation (vs. others) White collar 263.8 207.8 0.20 5.65 5.93 0.34 Blue collar 94.6 246.1 0.70 10.1 7.03 0.15 Income (≥468.75 vs. <468.75) 536.7 207.3 0.010 -16.4 5.92 0.006 Hospital level (vs. others)
Medical center 1,761.2 206.4 <0.001 -14.1 5.89 0.02
Regional hospital 1,027.1 209.9 <0.001 -8.09 5.99 0.18
Charlson comorbidity index score 27.8 55.7 0.62 1.06 1.59 0.51 Deceased at discharge (vs. alive) 1,297.6 205.5 <0.001 74.3 5.87 <0.001 Abbreviations: LOS, length of hospital stay; PMV, prolonged mechanical ventilation.
Appendix. Comorbidities and the corresponding ICD-9-CM codes used to calculate the Charlson comorbidity index score
Comorbidity ICD-9-CM code (A-code)**
Myocardial infarction* 410, 412 (A270) Congestive heart failure 428
Peripheral vascular disease* 443.9, 441, 785.4, V43.4 Cerebrovascular disease 430–438 (A290–A299)
Dementia* 290 (A210)
Chronic pulmonary disease* 490–496, 500–505, 506.4 (A323–A325) Rheumatologic disease* 710.0, 710.1, 710.4, 714.0–714.2,
714.81, 725 Peptic ulcer disease 531–534 (A341)
Mild liver disease 571.2–571.6
Diabetes mellitus 250 (A181)
Hemiplegia or paraplegia* 344.1, 342
Renal disease* 582, 583, 585, 586, 588
Any malignancy 140–172, 173–195, 200–208 (A080, A090–A096, A099–A101, A109–A110, A113–A115, A120–A126, A129–A130, A140, A141, A149)
Moderate or severe liver disease 572.2–572.8, 456.0–456.21 Metastatic solid tumor 196–199.1
AIDS 042–044
*Asterisked codes were included if listed during the index or prior admissions. **A-codes were used to classify diseases because both the A-code and ICD-9-CM were used to code diseases before 2000 in Taiwan.