(FC) adjustment methods are highly empirical and may lead to very different conclusions. The need and/or level of FC adjustment should be justified based on cyclic behavior of sand and its relationship with fines. This study made an attempt to provide that reference information for a silty sand commonly found in Central Western Taiwan. A series of isotropic consolidation, undrained monotonic and cyclic triaxial tests were conducted on reconstituted Mai Liao Sand (MLS) with various FCs and densities. Concurrent shear wave velocities were measured using bender elements in some of the cyclic triaxial tests. This paper describes the geological background, the laboratory tests and their implications in the assessment of liquefaction potential for MLS.
q2004 Published by Elsevier Ltd.
Keywords: Sand; Cyclic resistance; Fines content; Critical state; Shear wave velocity
1. Introduction
Field test results such as the N value from standard penetration test (SPT), cone tip resistance ðqcÞ from cone
penetration test (CPT) or shear wave velocity ðVsÞ have been
used to assess the liquefaction potential for sand under the framework of simplified procedure [1]. The simplified procedure uses an empirical correlation between the cyclic resistance ratio (CRR) and the field test results as the principal criterion to determine if the soil is potentially liquefiable. These CRR correlation curves have been developed through field observations. Most of the available CRR correlations provide a clean sand base curve and a suggested procedure to account for fines (soil particles passing #200 sieve) content for sands that contain fines. Experience has indicated that mineral contents and plasticity of the fines are important contributing factors to the monotonic or cyclic behavior of a sand that contains fines[2]. The effects of plastic or non-plastic fines on the behavior of sand have been a subject of geotechnical research for many decades. These studies, however, have not lead to a consensus as to whether fines can increase or decrease the undrained strength or cyclic resistance of sand as described by Polito [3]. On the other hand, systematic
studies on the effects of fines on field test results such as N; qcor Vs have rarely been reported. With these drawbacks,
Youd et al.[1]emphasized that the CRR corrections based on fines contents (FCs) should be used with engineering judgment and caution.
The Chi Chi earthquake (ML ¼ 7:3; MW¼ 7:6) of
September 21, 1999 triggered extensive soil liquefaction in Central Western Taiwan. The majority of the sand deposit in this region was relatively compressible and had significant amounts of low to medium plastic fines. When performing back analysis of sand liquefaction potential in this region, the selection of field test method, its CRR correlation and the associated FC corrections could lead to significantly different results. The factors of safety (FS) against liquefaction from SPT were consistently higher than those from CPT, which in term were higher than those according to shear wave velocities[4,5]. In order to provide a basis for judging the correctness of the simplified liquefaction potential assessment procedure, it would be highly desirable to first establish an understanding of the undrained behavior of the silty sand in this region.
The authors performed a series of laboratory tests on reconstituted Mai Liao Sand (MLS), with various FC and densities. MLS was a typical silty fine sand from Central Western Taiwan. The laboratory tests included isotropic consolidation tests and consolidated undrained monotonic
0267-7261/$ - see front matter q 2004 Published by Elsevier Ltd. doi:10.1016/j.soildyn.2004.06.013
* Corresponding author. Tel.: þ886-35-722-803; fax: þ886-35-734-116. E-mail address: [email protected] (A.-B. Huang).
and cyclic shearing tests in a triaxial cell on specimens with FC ¼ 0, 15, 30 and 50%. The triaxial cell was equipped with bender elements to allow shear wave velocity measurements on the soil specimens. The objective of these tests was to provide reference values on the compressibility, undrained shear strength and correlations between CRR and Vs for
MLS. The effective confining stress and density conditions applied in the cyclic triaxial tests reflected the cases where we had the most interest in liquefaction potential analysis. This paper describes the geological background of MLS, the laboratory tests and their implications in the assessment of liquefaction potential for MLS.
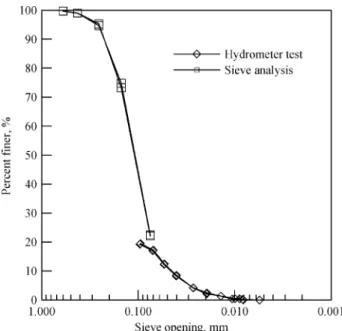
2. Geological origin and physical properties of MLS The source of MLS was the central mountain range that lied on the east side of Taiwan. Weathered sedimentary and metamorphic rocks such as sandstone, shale and slate on steep slopes were eroded by rainfall and transported by rapidly flowing streams before deposition on the west plain, to a thickness of several hundred meters. The process of transportation ground the fractured rock into sand and silt particles.Fig. 1shows typical grain size distribution curves of MLS samples from the field. The specific gravity of clean MLS (particles retained on #200 sieve) had an average value of 2.69. Particles passing #200 sieve had an average specific gravity of 2.71. X-ray diffraction analysis of MLS showed significant amounts of muscovite and chlorite, in addition to
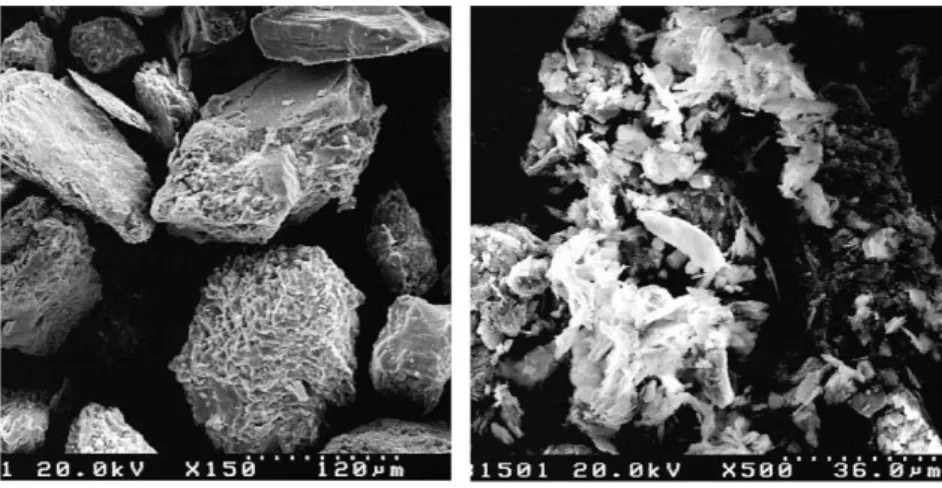
quartz. Fig. 2 depicts scanning electron microscope
photographs of the MLS particles retained on and passed #200 sieve. Particles retained on #200 sieve were angular and platy. The fines passing #200 sieve had a liquid limit of 32 and a plasticity index less than 8, which lied slightly below the A-line and classified as ML. The minimum void
ratios ðeminÞ were 0.646, 0.589, 0.593 and 0.564 and
maximum void ratios ðemaxÞ were 1.125, 1.058, 1.213 and 1.308 for MLS with 0, 15, 30 and 50% of FC, respectively. The emin (maximum density) was determined according to
ASTM D4253 method 1A using a standard 152.4 mm inside diameter compaction mold (total volume ¼ 2830 cm3). The dry sand placed in the compaction mold was subjected to a surcharge of 14 kPa, and then electromagnetically vibrated under a 60 Hz frequency for 8 min. The emax (minimum
density) was obtained according to ASTM D4254 method C, using a 2000 glass graduated cylinder. Approximately 1000 g of dry sand was placed in the glass cylinder and then plugged with a stopper. The total volume under the loosest state was determined according to the height of the sand after swiftly tipping the cylinder upside down twice. It should be noted that none of the above ASTM standards were applicable for sand with fines in excess of 15%. Also, as will be described later, due to the compressibility of MLS, the relative density could only serve the purpose of initial specimen setup. The analysis of test data used void ratios to represent the soil density.
3. Specimen preparation
It is known that the specimen preparation method or soil fabric can have significant effects on the stress – strain relationship and cyclic strength of sand[2]. The situation is more complicated for silty sand as it involves additional issues of soil compressibility and particle segregation. According to Ishihara[2], the widest range in void ratio that can be attained is by means of moist tamping (MT), and the narrowest range by means of water sedimentation (WS). The specimen preparation method, however, is not expected to have significant effects on the critical state line (CSL)[2,6]. For tests on silty sand, Ishihara[2], Høeg et al.[7], and Vaid et al.[8]reported that MT was not able to create consistent specimens or to simulate the stress – strain response of natural alluvial soil deposits. Dry deposition (DD) and WS methods were used to form Tia Juana silty sand specimens [2] at the highest possible void ratio and then consolidated to the desired confining stress.
Soil specimens with FC of 0, 15, 30 and 50% by weight were used in the consolidation and monotonic triaxial tests in this study. In order to compare the undrained shear strength and other soil behavior indexes under a given state, it was necessary to create specimens with these FC and under the same void ratio. With all of its drawbacks, the authors chose MT as the main method for specimen preparation because of the wide range of FC involved and compressibility that varied with FC. As will be explained later, as the FC exceeded 30%, the range of possible void ratios became rather limited after the specimen was consolidated. In many cases, the specimens with FC over 30% had to be made under very loose conditions to compensate for its high compressibility so that
the postconsolidation void ratio could be comparable to a specimen with FC less than 15%. MT was a practical and convenient way to create specimens with the necessary range of void ratios and thus was adopted to prepare most of the MLS specimens in this study. Recognizing the potential problems of MT specimen preparation method, the soil behavior correlations were analyzed internally among laboratory test data only. In addition, a series of tests were conducted to verify the uniformity and consistency of the specimens prepared by MT and to compare with those by DD and WS methods as will be presented later.
A large quantity of MLS taken from the field was washed through a #200 sieve and then oven dried to separate the fines. The coarse (retained on #200 sieve) and fine (passing #200 sieve) particles were then blended together to obtain the desired FC. For consolidation and monotonic triaxial tests, the specimens had a diameter of 75 mm and length of 150 mm. The cyclic triaxial test specimens had a diameter of 50 mm and length of 100 mm. The test specimens were created following the MT method in four layers. The sand was mixed with a moisture content ðwÞ of 8% and then placed in the split mold and compacted to the desired density. Because of capillary, there was no need to apply vacuum when removing the split mold. The specimen was permeated with CO2, flushed with de-aired water and
saturated under a back-pressure of 300 kPa. All specimens had a minimum pore pressure parameter B of 0.95.
It should be emphasized that due to the nature of mineral contents, MLS was relatively compressible. The change of void ratio between specimen setup and after the application of confining stress in the triaxial cell could be very significant. During the consolidation tests, the amount of pore water being absorbed or squeezed out of the saturated specimen was monitored. At the end of consolidation, the entire specimen was used to measure its moisture content and the postconsolidation void ratio ðeÞ was calculated from this moisture content. The e values at earlier stages of consolidation were then back calculated according to the pore water volume changes recorded during the test.
The end-of-consolidation void ratio was used in reporting the triaxial test results. A series of isotropic consolidation tests were performed first to establish the stress – volume relationship under various initial relative densities ðDr0Þ: For
FC ¼ 0 and 15%, Dr0ranged from 0 to 85%. As FC reached
30%, the consolidation test results became rather inconsist-ent and not repeatable when Dr0was less than 50% or larger
than 85%. For this reason, the isotropic consolidation tests on specimens with FC ¼ 30 and 50% were limited to the Dr0
of 50 and 70%.
In preparing the monotonic and cyclic triaxial specimens, a Dr0 was chosen so that the desired initial state could be
reached after application of the confining stress as predicted by the isotropic consolidation tests. Following this pro-cedure, the specimen was always denser upon application of the confining stress than it was after the specimen preparation. The final void ratio was independently determined by measuring the water content after the triaxial test similar to the case of consolidation tests.
4. Effects of specimen preparation procedure
MLS with the desired target FC was mixed first in dry condition. For specimens prepared by MT, the specimens were made following the procedure described above. The specimen prepared by DD was carried out using a known weight of dry sand that was poured from a minimum height into the rubber membrane lined split mold with the aid of a funnel. The WS method was similar to DD, except that the sand was deposited through de-aired water. The specimen was saturated and back-pressured as described earlier. Upon saturation and consolidation to an effective confining stress of 100 kPa, the specimen was removed from the triaxial cell and sliced horizontally into five equal layers, numbered 1 – 5 from top to bottom. For each slice, the water content was
measured and FC determined by wash sieving. Table 1
shows the test results and statistics from MT specimens with target FC of 0, 15, 30 and 50%, and specimens prepared by
DD and WS method with a target FC of 30%. The results showed that variations of FC or w within the specimens were mostly random indicating that there were no signs of migration of fines in the specimens, regardless of the specimen preparation method. For specimens of FC ¼ 30%, the specimen prepared by WS had the lowest uniformity whereas the DD specimen was the most uniform. The standard deviation of water contents of the WS specimen represent a coefficient of variation of approximately 5%, well within the accuracy of water content measurements. The results described above and shear wave velocities measured within the triaxial specimens to be presented later show that the specimens prepared by MT are reasonably uniform and consistent.
5. The stress – volume ratio and strength behavior of MLS under monotonic loading conditions
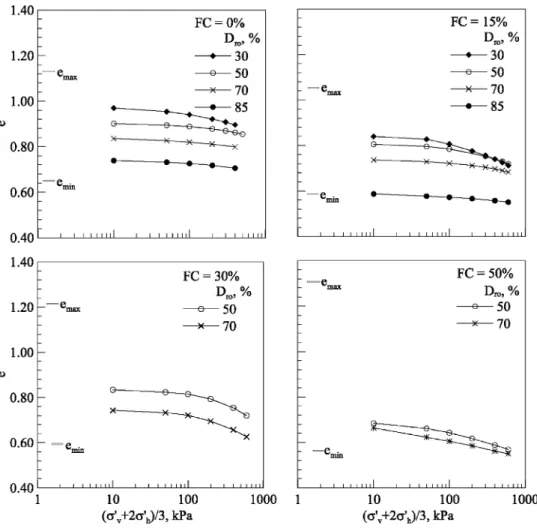
A Wykeham – Farrance triaxial apparatus was used in the monotonic consolidation and triaxial shearing tests. An internal load cell was used to monitor the axial force imposed on the specimen and an externally mounted LVDT was used to measure the axial deformation. Fig. 3
shows the relationship between e and effective mean normal stress p0ð¼ ðs0vþ 2s0hÞ=3Þ; wheres
0
v is the effective
vertical stress ands0h; the effective horizontal stress, from
the isotropic consolidation tests. The emin and emax are
marked in the figure. In general, the compressibility increased with FC and p0; and decreased as the specimen became denser. When the FC reached 50%, the appli-cation of initial confining stress and the saturation process apparently caused enough compression that the consolida-tion curves were almost indistinguishable among speci-mens with different Dr0: In many cases, the e became less than emin; or the postconsolidation relative density
exceeded 100%.
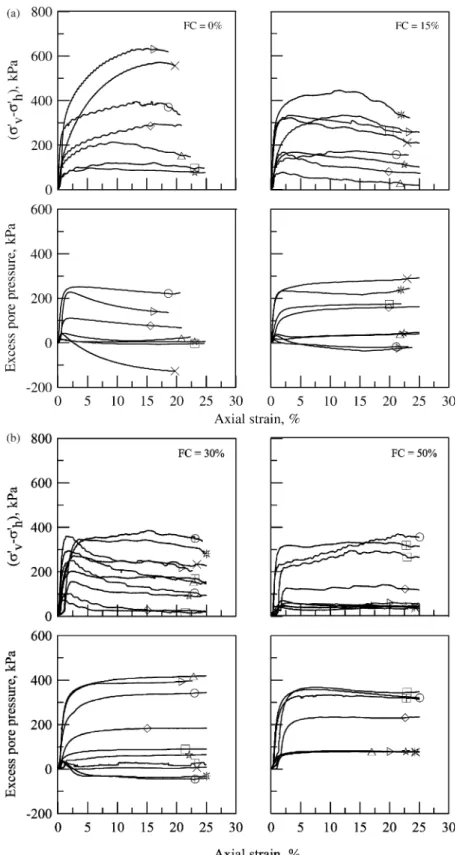
Isotropically consolidated undrained triaxial tests were performed on specimens with FC ¼ 0, 15, 30 and 50%. The void ratios applied corresponded to loose to dense conditions. The specimens were sheared monotonically by axial compression to strains well in excess of 20% to reach or be close to critical state [6]. For the densities and confining stresses applied, the specimens rarely demon-strated dilatant behavior, even for dense specimens. In many cases, the test results showed strain softening behavior. The strain softening seemed to be more apparent as the FC increased. The relationships among deviator stress, excess pore pressure and axial strain, as well as the effective stress paths in terms of qð¼ ðs0v2s0hÞ and p
0ð¼ ð
s0vþ 2s0hÞ=3Þ
from all the consolidated undrained triaxial tests are depicted inFig. 4a – c. A combination of deviator stress, q and pore pressure was chosen for each undrained triaxial test according to the definition of critical state where the sand deformed continuously at relatively constant pore pressure and constant q: The critical state points are marked in Fig. 4a – c. A straight line was fitted to the data set of ðp0; qÞ that corresponded to the critical state of each triaxial
test as shown in Fig. 4c. The slope of this fitted line was referred to as Ms: For the tests performed, Ms¼ 1:24 for
FC ¼ 0 – 30%, and Ms¼ 1:21 as FC reached 50%. These
Msð¼ 6 sinf0s=ð3 2 sinf0sÞÞ values should correspond to
interparticle friction angles ðf0sÞ of 30.9 and 30.28,
respectively. The similarity in f0s regardless of the FC
indicates that the coarse and fine MLS particles had similar grain to grain frictional behavior.
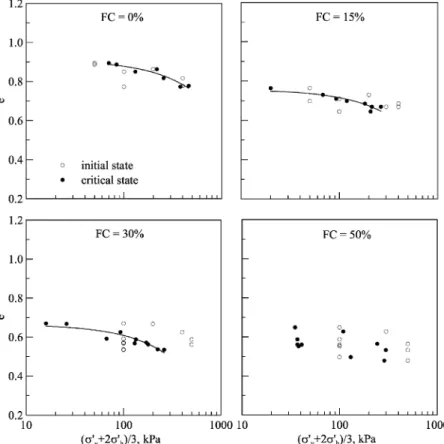
A CSL was established by fitting a line to the data set of p0at the critical state against the void ratio for each of the FC tested as shown in Fig. 5. The CSL became curved as p0 approached 100 kPa. For FC % 30%, the coefficient of correlation of the CSL was over 0.85. As FC reached 50%, the coefficient of correlation of the CSL was reduced to 0.37. Because of this lack of consistency in monotonic
Table 1
Water content and fines content distributions within soil specimens
Target FC Dr0 e Level 1 Level 2 Level 3 Level 4 Level 5 Mean Standard deviation
Moist tamping 0 70 0.82 FC 3.90 4.25 2.39 3.99 1.63 3.23 1.15 w 30.56 30.49 30.09 30.84 30.97 30.59 0.34 15 50 0.82 FC 17.54 16.04 15.95 16.67 17.10 16.66 0.68 w 30.59 30.51 30.46 30.63 30.65 30.57 0.08 30 65 0.77 FC 30.07 31.45 31.67 30.11 29.44 30.55 0.96 w 28.56 28.49 29.87 27.38 28.93 28.65 0.90 50 50 0.71 FC 51.46 51.15 50.79 50.85 51.31 51.11 0.29 w 26.82 26.56 26.12 26.13 26.79 26.48 0.34 Water sedimentation 30 65 0.76 FC 31.63 26.38 27.94 28.47 28.53 28.59 1.91 w 26.24 28.43 27.39 30.00 28.82 28.18 1.43 Dry deposition 30 65 0.69 FC 28.68 27.47 29.28 27.97 28.00 28.28 0.71 w 25.46 26.30 25.76 25.73 24.71 25.59 0.58
triaxial tests, no cyclic triaxial tests on specimens with FC ¼ 50% were conducted.
6. The cyclic resistance of MLS
The CRR values were measured using a stress controlled pneumatic cyclic triaxial apparatus made by Seiken Inc. of Japan. The soil specimen was consolidated under an isotropic effective confining stress s0c and then subjected
to a cyclic deviator stress,sdin axial direction. Three to five
cyclic triaxial tests were performed with various sd=2s0c
values. CRR was defined as the sd=2s0c that produced an
axial strain of 5% in double amplitude in 20 cycles ðNcÞ of
uniform load application. Since in the simplified procedure, CRR is usually correlated with in situ test results normalized with respect to an effective overburden stress of one atmospheric pressure or 100 kPa, all CRR measurements on MLS were thus, conducted withs0c¼ 100 kPa
isotropi-cally applied to the soil specimen during consolidation. The FC were limited to 0, 15 and 30%.Fig. 6depicts the CRR versus Ncfrom cyclic triaxial tests.
An attempt was made to compare CRR for MLS with different FC but similar void ratio. Because of
the drastically different range of void ratios under
various FC as shown in Fig. 3, such a comparison
would be rather difficult. Void ratios of approximately 0.80 (close to the maximum applicable e for specimens with FC ¼ 30%) and 0.73 (close to the minimum applicable e for specimens with FC ¼ 0%) represent the maximum and minimum void ratio, respectively, that could be used as a common value for all three FC applied in the cyclic triaxial tests. According to Fig. 6, CRR consistently decreased as FC changed from 0 to 15 and 30%, for tests conducted under common void ratios of 0.80 and 0.73. It is conceivable that similar trend would exist for void ratios between 0.80 and 0.73.
The data points of CRR versus state parameter (difference in void ratio between the initial state and critical state under the same effective mean normal stress) appear to have a consistent trend, regardless of the FC as shown in
Fig. 7. The straight line in Fig. 7 had a coefficient of correlation of 0.81 with the data points. This correlation may be used to provide a first order estimate of CRR based on state parameter for MLS with various FC within the range of 0 and 30%. There is a theoretical basis for this correlation to be valid as the state parameter relates to soil dilatancy.
7. Shear wave velocity measurements in triaxial specimens
Bender elements of the type described by Dyvik and Madshus[9]were installed in the top and bottom platens of
the cyclic triaxial cell, each projecting 3 mm into the soil sample. The shear wave velocity, Vs; was measured using
the bender elements after the specimen was consolidated, prior to the cyclic triaxial test. A single sinusoidal pulse with a frequency of 7 – 10 kHz and amplitude of ^ 10 V was
Fig. 4. (a) Stress, excess pore pressure and strain relationships from tests with FC ¼ 0 and 15%. (b) Stress, excess pore pressure and strain relationships from tests with FC ¼ 30 and 50%. (c) Effective stress paths from triaxial tests.
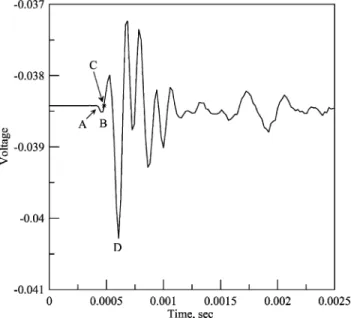
applied in the bender element tests.Fig. 8shows an example of a time history of output voltage from the receiver. In this bender element test, the specimen with FC ¼ 15% and Dr0¼ 79% was consolidated under an effective stress of
100 kPa, and the sinusoidal pulse frequency was 7 kHz. The determination of the shear wave travel time followed a procedure suggested by Kawaguchi et al. [10]. Point C marked inFig. 8was selected as the shear wave arrival time.
Fig. 4 (continued )
The tip-to-tip distance between the two bender elements was used as the travel distance in the calculation of shear wave velocity.
Fig. 9plots the relationships between e and Vsaccording
to bender element measurements, under various FC. According to Fig. 9, for similar e; Vs decreases as FC
increases. The results in Fig. 9 shows that for specimens with the same FC and similar e; the measured Vsclustered
within a rather narrow range. This is a further indication
that the specimen preparation by MT and Vs
measurement procedures were sufficiently repeatable.
Following the expression proposed by Hardin and Richart
[11], Vscould be related to e as
Vs¼ ða 2 44:6eÞðs0cÞ 0:25
ð1Þ
where a ¼ 91; 85 and 79 for FC ¼ 0, 15 and 30,
respectively.
Vsis in m/s ands0cin kPa. The coefficient of correlation
between Eq. (1) and the corresponding data points were 0.93, 0.79 and 0.97, respectively, for FC ¼ 0, 15 and 30%. According to data presented inFig. 9and Eq. (1), the Vsof
MLS was at least 30% smaller than those of Ottawa sand under similar states as reported by Hardin and Richart[11].
Fig. 6. CRR versus Nc:
Fig. 7. CRR versus state parameters.
Fig. 8. Time history of output voltage from the receiver.
There was a significant decrease of Vsas the FC increased
from 0 to 30%, indicating that the fine grains of MLS were softer under small strains. These Vs values are comparable
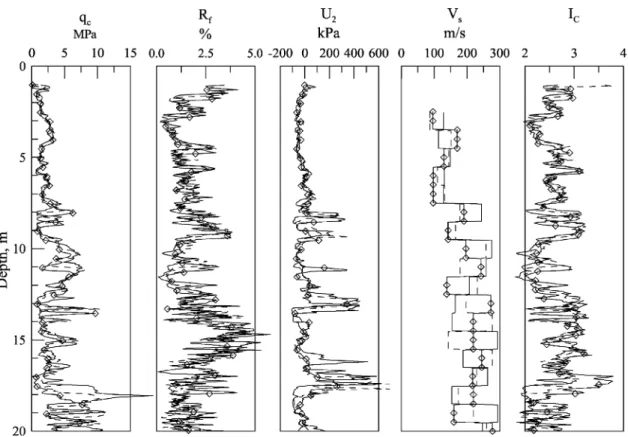
to those from seismic cone penetration tests (SCPTs) performed in silty sand with similar geological background, at a test site in Yuan Lin which was approximately 40 km east of the origin of MLS. Profiles of cone tip resistance ðqcÞ;
sleeve friction ratio ðRfÞ; excess pore pressure readings
immediately behind the cone tip ðU2Þ; Vsand soil behavior
index ðICÞ from three SCPT performed within a distance of
5 m are shown inFig. 10. The Vsvalues within the top 10 m,
varied mostly between 100 and 200 m/s.
8. Relationships among CRR, fines content and Vs
Since for every cyclic triaxial test specimen, there was a Vs taken prior to the cyclic loading test, a correlation
between laboratory determined CRR and Vs could be
easily established based on these data. The shear wave velocity corrected to an overburden stress of 1 atmos-pheric pressure ðPaÞ or Vs1 is the same as Vs from bender
element measurements since all Vs measurements and
cyclic triaxial tests were performed with s0h¼s0v¼ 100
kPa ¼ 1Pa: Fig. 11shows a plot of CRR versus Vs1 from
this study and their comparison with the correlations proposed by Andrus and Stokoe [12]. For a given CRR, the Vs1 value from laboratory tests on MLS specimens
were generally smaller than those suggested by Andrus
and Stokoe [12]. There were no significant differences in the CRR – Vs1 correlation as FC increased from 0 to 30%.
The result may offer an explanation for the reported low FS against liquefaction using shear wave measurements in this region [4,5].
It should be emphasized that the findings may be soil specific and strongly influenced by the specimen
Fig. 10. SCPT test results from Yuan Lin test site.
preparation and test procedures. The authors are not
ready to suggest that the CRR – Vs1 correlation as
proposed by Andrus and Stokoe [12] should be revised for field applications in this region, solely based on the data reported herein. The evidence was strong enough,
however, to indicate that the Andrus and Stokoe [12]
correlation may be too conservative and further
evaluation of the field data is warranted for the silty sand in this region. The test data also raised a question as to the necessity of FC adjustment for the CRR – Vs1
correlation.
A limited number of cyclic triaxial and bender element tests were performed on specimens with FC ¼ 30% and
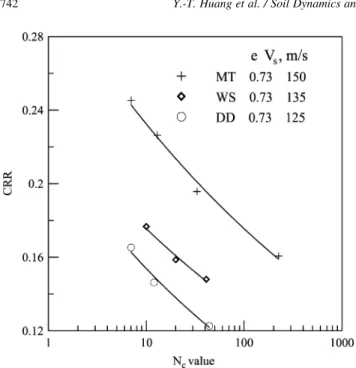
prepared by DD and WS methods. Fig. 12 depicts the
CRR versus Nc from this series of cyclic triaxial tests.
According to Fig. 12, for e of 0.73, specimens prepared by DD had the lowest cyclic strength and those by MT had the highest. Similar comparisons were also reported by Ishihara[2]. Vs measurements followed the same trend
as the CRR. As a result, the additional CRR – Vs1 data
points from the WS and DD specimens fit well within the trend obtained from specimens prepared by MT method as shown in Fig. 11.
9. Concluding remarks
Due to the mineral and grain characteristics, the compressibility of MLS was relatively high and the CSLs were curved even under mild confining stresses. The
laboratory measured Vs values obtained in MLS were
smaller in comparison with those in reconstituted clean, quartz dry sand under similar states. These lower values are most likely related to the relatively soft and crushable
nature of MLS and the effects of fines. The grain characteristics of MLS could also lead to lower CRR from cyclic triaxial tests. Apparently, the decrease in CRR was not as significant as that in Vs according to the data
presented in this paper. As a result, the CRR – Vs
correlations developed from laboratory tests on MLS fell to the left of the correlation proposed by Andrus and Stokoe[12]. For void ratios ranging from 0.73 to 0.80 and FC at 0, 15 and 30%, the test data in this paper seem to indicate that the CRR decreases with FC for MLS under the same state. A similar trend was found between the Vs
and FC.
The laboratory test results presented in this paper may help in explaining why FS against liquefaction from shear wave velocity were consistently low for the silty sand in Central Western Taiwan. It is well recognized that the soil fabric and aging can affect CRR and Vs:
MLS specimens with 30% of FC, prepared by three different methods resulted in significantly different CRR values. The soil specimens prepared by MT method may not duplicate the soil compressibility and fabric in the field. It is thus, premature to conclude that the currently used CRR – Vs correlation should be modified solely in
view of the new laboratory data. The effects of grain characteristics are not strongly influenced by soil fabric and aging. The data presented in the paper did indicate that the effects of grain characteristics can be very significant and should be carefully considered in the assessment of liquefaction potential for the silty sand in Central Western Taiwan.
References
[1] Youd TL, Idriss IM, Andrus RD, Arango I, Castro G, Christian JT, Dobry R, Liam Finn WD, Harder Jr LF, Hynes ME, Ishihara K, Koester JP, Liao SSC, Marcuson III WF, Martin GR, Mitchell JK, Moriwaki Y, Power MS, Robertson PK, Seed RB, Stokoe II KH. Liquefaction resistance of soils: summary report from the 1996 NCEER and 1998 NCEER/NSF workshops on evaluation of liquefaction resistance of soils. J Geotech Geoenviron Eng, ASCE 2001;127(10):817 – 33.
[2] Ishihara K. Liquefaction and flow failure during earthquakes. Geotechnique 1993;43(3):351 – 415.
[3] Polito CP. The effects of nonplastic and plastic fines on the liquefaction of sandy soils. PhD Thesis, Virginia Polytechnic Institute and State University, Blacksburg, Virginia, 1999.
[4] Moh and Associates, Soil liquefaction and rebuild policy evaluations, Phase I (Yuan Lin, Ta Tzuen and Tou She Townships (in Chinese)), Taipei, Taiwan: Moh and Associates; 2000.
[5] Huang AB, Lee DH, Lin PS, Tsai JS, Lin CP, Chi YY, Ku CS, Chen JW, Juang CH, Liou YJ. In: Culligan, et al., editors. Lessons learned from the post Chi Chi EQ geotechnical explorations in Central Western Taiwan. In: 12th Pan American Conference on Soil Mechanics and Geotechnical Engineering, Cambridge, Massachu-setts, vol. 1.; 2003. p. 245 – 52.
[6] Been K, Jefferies MG, Hachey J. A critical state of sand. Geotechnique 1991;41(3):365 – 81.