~
Pergamon
Int. J Heat Mass Tran,~[i~r. Vol. 40, No. 8, pp. 19(17 1922. 1997 ~~ 1997 Elsevier Science Ltd Printed in Great Britain. All rights reserved 0017 9310/97 $17.00+(I.00
PII : S0017-9310(96)00187-1
Flow visualization and numerical simulation of
transverse and mixed vortex roll formation
in mixed convection of air in a horizontal
flat duct
M. Y. C H A N G , C. H. Y U and T. F. L I N t
Department of Mechanical Engineering, National Chiao Tung University, Hsinchu, Taiwan, Republic of China
(Received 19 April 1996 and in final form 24 May 1996)
Abstrae~Combined experimental flow visualization and three-dimensional unsteady numerical simulation were carried out to investigate the formation of the traveling transverse and mixed vortex roll structures from the initially unidirectional, subcritical flow of air in a bottom heated horizontal flat duct when the Rayleigh number was raised to a supercritical level. In the study the Reynolds number was varied from 2.5 to 20 and the Rayleigh number from 1500 to 8000. Both the experiment and computation, being in qualitative agreement, indicated that in the early stage of the transient a pair of longitudinal rolls are induced in the side wall region ; then new longitudinal rolls were induced near the existing ones. Meanwhile, weak transverse rolls were generated in the duct entry. As time proceeds, the transverse rolls grow in size and strength and slowly move downstream to push the longitudinal rolls in front of them out of the duct. At the same time new transverse rolls are generated in the duct entry. At a low Reynolds number (Re <~ 5) the transverse rolls are longer and stronger to expel all the longitudinal rolls out of the test section so that a pure and regular transverse vortex roll structure is formed. While at a higher Reynolds number (Re >~ 7.5) the transverse rolls are shorter and weaker and a few longitudinal rolls stay, all the time, near the duct sides, resulting in a mixed longitudinal and transverse roll structure. In the numerical simulation the temporal characteristics of the two vortex flow structures at the statistical state are also examined in detail.
© 1997 Elsevier Science Ltd. All rights reserved.
1. I N T R O D U C T I O N
The buoyancy induced vortex flow structures in a mixed convective gas flow through a b o t t o m heated horizontal flat duct play an important role in growing thin crystal film from chemical vapor deposition pro- cesses and recently they have been studied extensively [1]. Various vortex flow structures such as the steady and unsteady longitudinal rolls, traveling transverse rolls, mixed longitudinal and transverse rolls, and irregular cells have been reported in the literature. The formation o f the longitudinal vortex flow is known to begin with the generation o f a pair of longitudinal rolls near the duct sides and the subsequent generation of the longitudinal rolls near the existing ones. However, the detailed dynamic processes of how other vortex flows are formed from an initially simple unidi- rectional subcritical flow, when the governing par- ameters are raised to the supercritical levels, are still poorly understood. A well designed flow visualization experiment combined with the three-dimensional numerical simulation were carried out in the present study to unravel these dynamic processes for the for- mation o f the m o v i n g transverse rolls and the mixed
t Author to whom correspondence should be addressed.
longitudinal and transverse rolls in an air flow through a bottom heated flat duct.
A comprehensive review of the literature on the longitudinal vortex rolls in a horizontal duct was already given in our previous study [2]. Here, only the literature relevant to the present study is briefly reviewed in the following.
In a mixed convective flow of fluid between two horizontal plates with the b o t t o m plate at a higher uniform temperature than the top one, the critical Rayleigh number for the onset of secondary flow is at Rac = 1708. Beyond Rac steady longitudinal rolls prevail and the roll diameter is nearly equal to the duct height [3-6]. The vortex rolls become irregular for a high Gr/Re 2 [7, 8]. A flow regime m a p of the Reynolds number Re vs the Rayleigh number Ra was proposed for nitrogen gas to locate the boundaries a m o n g the flow with no roll, steady and unsteady rolls [9, 10]. The existence of the transverse thermo- convective rolls was proved with silicone oil as the working fluid [11], at a very low Reynolds number, 0.001 ~< Re <~ 0.01. A refined flow regime map to include the transverse rolls was provided later [12, 13]. Recently, we reported a mixed roll pattern which is characterized by longitudinal rolls induced near the duct sides and transverse rolls in the duct core [14]. Also, the deformation of the transverse rolls was 1907
1908 M.Y. CHANG et al.
NOMENCLATURE
a, a' dimensionless and dimensional time Tc
constants Th A aspect ratio, b/d u, v, w b channel width d channel height W g gravitational acceleration x, y, z Gr Grashof number, gfld3( Th - Tc) /V 2 l, L dimensional and dimensionless length
of test section, lid
Nu local Nusselt number on the bottom plate
p dimensionless dynamic pressure
Pr Prandtl number
Ra Rayleigh number, gfld3( Th - T~)/v~ Rac critical Rayleigh number
corresponding to the onset of
convection in the form of longitudinal rolls
Re Reynolds number, ~Vd/v
T, 0 dimensional and dimensionless temperature, ( T - T c ) / ( T h r To)
temperature of the cold surface temperature of the hot surface
dimensionless velocity components scaled with I~
average axial velocity
dimensionless Cartesian coordinates scaled with d.
Greek symbols
thermal diffusivity
fl thermal expansion coefficient
v kinematic viscosity.
Subscripts
f final state
fd fully developed state i initial state
max maximum.
investigated. In all the literature reviewed above only the final flow structures at steady or statistical state were examined. The processes through which these structures are formed have not been explored and will be experimentally and numerically investigated in the present study. Attention will be focused on the sub- sequent evolution of the vortex flow after the change in the Reynolds or Rayleigh number by visualizing the flow from the top, end and side views. In the study the Reynolds number was varied from 2.5 to 20 and the Rayleigh number from 1500 to 8000.
2. EXPERIMENTAL APPARATUS AND PROCEDURES
2.1. Experimental apparatus
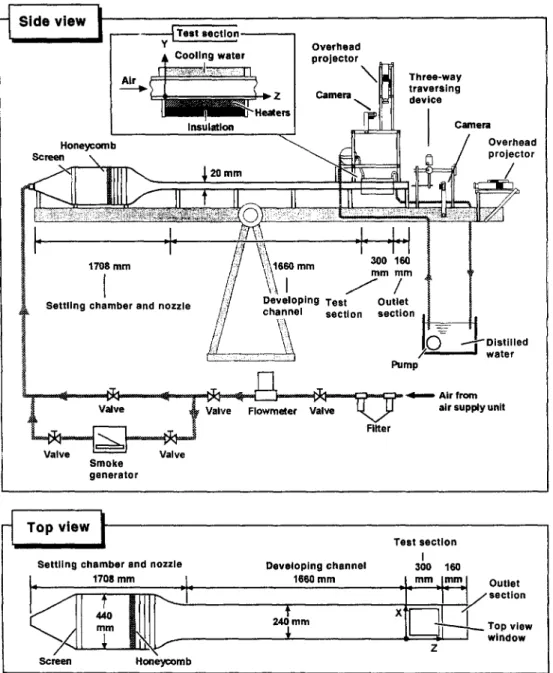
A sketch of the established test apparatus for the mixed convection of air in a bottom heated horizontal plane channel and the adopted coordinate system are shown in Fig. 1. The test section is a rectangular duct 240 mm wide and 300 mm long with a gap width of 20 mm between the hot and cold walls ; thus the aspect ratio of the duct is 12. The lower plate of the test section is made of a 15 mm thick, high purity copper plate and is electrically heated by d.c. power supplies. The heaters glued onto the outside surface of the bot- tom wall were divided into 10 segments in the flow direction and each heater was controlled inde- pendently by a GW GPC 3030D laboratory power supply. The high thermal conductivity, density and large thickness of the copper plate can minimize the nonuniformity and unsteadiness in the bottom wall temperature. The width of the lower plate is 40 mm larger than that of the test section in order to reduce
the edge effect in the spanwise direction of the test section. The upper plate is cooled by distilled water flowing above it. The distilled water is maintained at constant temperature by a heat exchanger. The heat exchanger can control the temperature of the distilled water within +_0.1°C. The volume flowrate of the distilled cooling water is adjusted carefully so that the temperature difference in the cooling water over the glass plate is within _+ 0.1 °C. The water head is also suitably adjusted to minimize any possible defor- mation of the glass plate. The side walls of the test section are made of 5 mm thick ptexiglass.
The temperature of the lower plate is measured by 13 calibrated and electrically insulated T-type thermo- couples embedded in the plate. The temperature of the upper plate is measured by 6 T-type thermocouples stuck to the inside surface of the plate. The tem- perature of both plates can be maintained nearly uni- form and at constant values with deviations ranging from _+0.05°C to _+0.12°C, depending on the Ray- leigh number tested. For each experiment the top plate temperature is kept at the same value as that of the inlet air flow for the purpose of eliminating the for- mation of a thermal boundary layer on the top wall.
The open loop mixed convection apparatus begins with the air regulated from a 600 psi and 50 000 ft 3 high pressure air tank which is passed through a settling chamber, a contraction nozzle and a developing chan- nel before entering the test section. In the settling chamber turbulence is suppressed by firstly passing the air through two fine mesh screens, then a honeycomb section and finally four fine mesh screens. The nozzle with a contraction ratio of 20 : 1 has been designed to eliminate flow separation, minimize turbulence and
Transverse and mixed vortex roll formation 1909
-~ Side view
H o n e ~ b ~ r e e n \ - - - - ~ y Test sectl© Cooling water Insulation J. 20 mm Overhead projector\
Camera Three-way traversing device Camera Overhead projector/
1708 mmI
Settling chamber and nozzle
_1.
_l.A
6 mm 300 16Q mm mm •J
/
cDlea:lnOP In g Te st Outlet section section Valve Valve ~ Valve Smoke generatorValve Flowmeter Valve
Pump
Filter
water
Air from air supply unit
Top view i
Test section
Settling chamber and nozzle
Screen Honeycomb Developing channel 1660 mm 240 mm I 300 160 _[. mm A m m l Outlet 7- 7" - I / s e c t i ° n
xFTI
II ~ p view • " - ~ I window ZFig. 1. Schematic of test apparatus and the chosen coordinate system.
provide a nearly uniform velocity at the inlet of the developing section. The developing section is 1600 mm in length, approximately 83 times the channel height. This ensures the flow is fully developed at the inlet of the test section for Re <~ 50.0. A 160 mm outlet section is added to the exit end of the test section to reduce the disturbance resulting from discharging the flow into the ambient. The settling chamber and the contraction nozzle are made of stainless steel, whereas the developing channel and the outlet section are made of 5 mm thick plexiglass. The whole test apparatus is placed in a quiescent house to eliminate any possible disturbance from the ambient surrounding the house. The entire loop including the settling chamber, con- traction nozzle, developing channel, test section and outlet section is thermally insulated with the superlon
insulator 20 mm thick and is mounted on a rigid supporting frame.
The volume flow rate of air is controlled and mea- sured by a Hasting H F C flow controller with an accu- racy better than 1%. The flow measuring system is calibrated periodically by a Brooks bell prover with an accuracy of 0.2%. The operating condition of the flow meter in actual measurement is adjusted to a condition similar to that of a calibration stand. The mean air speed in the test section is calculated from the total flow rate.
To measure the velocity and temperature of the air flow in the test section, probes are inserted from the downstream end of the test section. The probes are supported by a three-way traversing device. Velocity is measured by a hot-wire probe. For calibrating the
1910 M.Y. CHANG
et al.
hot-wire, the pipe flow method in which the probe is placed in the center of a fully developed laminar pipe flow is used. The total flow rate is measured and the pipe center velocity is calculated from the parabolic distribution. The temperature is measured by a ther- mocouple probe which is an OMEGA (model HYP- O) extremely small T-type thermocouple (33 gauge) implanted in a 1 in long stainless steel hypodermic needle.
2.2.
Data uncertainty
The data acquisition and control system and vari- ous instruments including : a PC 486-66, multiplexers (Computer Product RTP 743 series), a digital bar- ometer (Setra System 361B), reference junctions (Cel- sco Transducer Products BRJ 14), laboratory power supplies (GW GPC 3030D), O M E G A type T ther- mocouples, a Hasting HFC flow controller and a reduction software, were calibrated and adjusted end- to-end on site by Instrument Calibration Section, Q.A. Center, Chung Shan Institute of Science and Technology (CSIST), Taiwan with the transfer stan- dards that the calibration hierarchy can trace back to the standards of National Institute of Standard and Technology (NIST), U.S.A. Before performing the end-to-end calibration all the sensors and transducers used were transported to CSIST for calibration or adjustment with the inter-lab standards based on the test point that was encountered in the present test in order to get the best calibration curve-fit data. The main purpose of this calibration is to reduce any poss- ible bias between the true physical values and the readouts of the sensors or transducers. The data reduction error is reduced further by using the best nonlinear least square calibration curve-fits and by selecting a suitable gain code of the multiplexers. The system is well grounded and the electric noises are suitably filtered out. Fixed physical or simulated sig- nals are then applied in the data uncertainty test. Samples higher than 32 are measured at each test point during the data uncertainty test. Uncertainties in the Rayleigh number, Reynolds number and other independent parameters were calculated according to the standard procedures established by Kline and McClintock [15] and Abernethy and Thompson [16]. Uncertainties due to the control unsteadiness and tem- perature nonuniformity are also accounted for in the data uncertainty evaluation. In addition, uncertainties of the thermophysical properties of the air were also included in the analysis. The detailed uncertainty analysis indicated that uncertainties of temperature, volume flow rate, dimensions, Reynolds number and Rayleigh number measurements are estimated to be less than ±0.15'~C, _+5%, _+0.05 mm, _+6% and _+ 6%, respectively, in this low Reynolds and Rayleigh number experiment.
2.3.
Preliminary investigation of flow field
Firstly, the main forced flow is investigated to check its fully developed condition at the entrance of the test
section with no heat input to the bottom plate. The results indicate that at the test section inlet the velocity profile is fully developed and is in good agreement with the analytical results given by Shah and London [17]. Additionally, the turbulence intensity is found to be less than 0.7%.
Flow visualization is conducted to observe the sec- ondary flow patterns by injecting smoke at some dis- tance ahead of the settling chamber. It is carried out by using a 1.5 2.5 mm plane light beam to shine through the flow field containing tiny incense particles as the light scattering centers and a sharp contrast could be achieved between the duct walls and the smoke.
In all the experiments reported below, we first imposed a fully developed flow in the entire test sec- tion and then turned on the power supply to the bot- tom plate and in the mean time circulated chilled water over the top plate. The Rayleigh number Ra is raised to 1500 and stabilized for half an hour. After this we started the transient processes and visualized the evolution of the vortex flow.
3. N U M E R I C A L S I M U L A T I O N
3.1. Mathematical modeling
Considered in the numerical simulation is a mixed convective air flow with a mean velocity W i n a differ- entially heated horizontal rectangular duct, as sche- matically shown in Fig. 2 along with the chosen coor- dinates. The flow enters the duct at a uniform temperature T~ and the top plate of the duct is also kept at this uniform temperature during the entire transient. Initially the bottom plate temperature is kept at a uniform subcritical level Th~ so that the Ray- leigh number associated with the corresponding tem- perature difference (Th,--To) is below 1708. After a sufficiently long period of time a steady subcritical flow prevails in the duct. Then at a certain instant
w . / x , . T tl"
I
11°1'°'6°
- ~ x'~,.J., . ' ~ I ~ I 0 5 o2'.10o13o
Fig. 2. Schematic of the physical system and the detection points at a cross section. (The x and y coordinates at various points are as follows: 1 (6.79,0.17), 2 (6.79,0.5), 3 (6.79,0.83), 4 (9.16,0.17), 5 (9.16,0.5), 6 (9.16,0.83), 7 (11.41,0.17), 8 (11.41,0.83), 9 (5.21,0.17), 10 (5.21,0.5), 11 (5.21,0.83), 12 (2.84,0.17), 13 (2.84,0.5), 14 (2.84,0.83), 15
Transverse and mixed vortex roll formation 1911
of time designated as t = O, the bottom plate tem- perature is raised to a uniform supercritical level Thf. In view of the large thermal inertia of the bottom plate in the experimental setup, the rise in the bottom plate temperature with time is described as
T h = Thiq-(Thf--Tiai)(1--e-a't), where a' is the time constant of the temperature rise and will be selected to comply with the experiment. Note that since the thermal conductivity of the plexiglass side walls is (k~ = 0.21 W m - l ° C -~) much higher than that of air
( k a i ~ = 0.026 W m - ~ °C - ~), perfect thermal conduction
is assumed in the side walls. It should be noted that upstream and downstream of the heated section of the duct is thermally well insulated. When the length, time and velocity and temperature are respectively scaled with the duct height d, mean convection time d / i f ' ,
mean velocity W and temperature difference AT( = Thf-- T J , the basic non dimensional equations describing the formation of the buoyancy driven vor- tex flow of a Boussinesq fluid from the initially uni- directional subcritical flow studied here are :
Ou &, Ow 0~ + ~-yy + ~-z = 0 (1) Ou Ou Ou Ou Op
o~+Ua-x+Vay+Wo~
ax
1 (0:. 02. o:.)
+ ~ \ax: + ~ + Oz:]
(2)
dv Ov Ov av 0par o
+ ~ \ a x : (3) Ow Ow a w Ow apa~-+u~ + ~ + w 0~
0~
00 00 00l (O:w O:w O:wX
+
kay: + --o/+
(4)
00_
1
(0:0 + 0:0 + 0:0)
+
(5)
Oz R e - - P r \ O x 2 @ : Oz: J
subject to the following initial and boundary con- ditions :
z = 0 ,
(u, v, w, 0) = steady subcritical flow and temperature fields calculated from computation [2] z > 0
x = O , A
U=V=w=O
rRa, + (1-
° = (1-y)L
RafJ --e a'r)]
y = O , L , < ~ z < ~ L + L , u = v = w = O = Rai 1 ~a2 ( 1 - e -"~) y = 0 , 0 ~<z < La, z > L + L a y = l,La <<.z<<.L+La y = 1 , 0 ~ < z < L a , z > L + L a 00 u = v = w = 0 0 ~ = 0 u = v = w = 0 0 = 0 00 u = v = w = 0 ~ = 0 z = 0 u = v = 0 w = w f d , O = O 0u 0v 0w 00 z ~ o v 0 z - 0 z - 0 z - 0 z - 0 (6)
where the inlet velocity wfd in the far upstream z ~ - Go is assumed as fully developed
=
Wrd \ m / \ n /
with the values of the constants m and n depending on the aspect ratio A [17].
The nondimensional groups which appeared in the above formation are defined as
• "d v
Re = - - P r = -
gfl(Th -- Tc)d 3 b , W Gr = v 2 A = ~l a = a d " (8) To account for the upstream diffusion at low Reynolds number flow, an upstream insulated section of length L, was added to the heated section as shown in Fig. 2. The selection of the proper La will be discussed in the next section. The local Nusselt number which signifies the heat transfer from the bottom heated plate to the channel flow is defined and evaluated as
hd q'£ d 00
U u = k (Thf-- To) k - 03' ,.=o (9) where q; is the local convective heat flux and k is the thermal conductivity of the fluid in the duct.
3.2. Solution m e t h o d
In view of the nonlinearity in the inertia terms, the basic flow equations were solved numerically. In particular, the projection method [18] was chosen to integrate the equations on a staggered grid system. This splitting ( fractional step) method consists of two steps. First, a provisional velocity field was explicitly computed, ignoring the pressure gradient. Then, it was corrected by including the pressure effect and by enforcing the mass conservation. The pressure dis-
1912 M.Y. CHANG et al.
tribution is obtained from solving the pressure Pois- son equation by the vectorized SOR method.
To enhance numerical accuracy and stability, all the spatial derivatives were discretized by the fourth- order central differences [19], except the convective terms which were treated by the third-order upwind difference proposed by Kawamura et al. [20]• For the nodes near the boundaries, the usual second order central difference was employed to facilitate the treat- ment of the boundary condition. This is not expected to significantly affect the accuracy of the solution since the flow either is rather slow due to the no-slip con- dition near the solid boundaries or changes slowly near the free boundaries. To allow for the possible presence of asymmetric flow with respect to the central vertical plane at x = A/2 for the time dependent flow induced at high Gr/Re 2, the computation domain includes both the left-half and right-half of the chan- nel. Although the downstream boundary conditions were exactly specified at z ~ oo, only a finite unheated section is added in the downstream to facilitate the numerical analysis. Both this unheated section and the upstream insulated section must be long enough so that the solution for the problem is independent of their sizes. Numerical tests indicated that the suitable length for the upstream and downstream unheated section is 0.2L and 0.47L, respectively.
Time advancement may be done either implicitly or explicitly. The first-order Euler explicit scheme was employed here since it has a much lower com- putational cost per time step and requires much less computer memory allocation than any equivalent implicit implementation. We also found that the first- order scheme was sufficiently accurate to resolve the smallest physical time scale. The stability of the sch- eme is limited by the requirement that the Courant number must be less than unity [21]. To insure the numerical convergence, the Courant number is set below 0.05 in the computation, which leads to
• . [ A x Ay Az'~
At < 0.05 x m i n i m u m [ - - , - - ) (10) \ u .... v .... ' ~ x "
The sequence of numerical operation is as follows : (1) Explicitly calculate the provisional velocity. (2) Solve the pressure equation by the vectorized Gauss-Seidel method with successive over-relaxation. The solution for the pressure is considered as con- vergent when the mean relative pressure difference between two consecutive iterations is below 10 4 i.e.
--(PiJ'k)ml / ( / x J x K ) <
lO - 4(ll)
z l(pT, j,
2
)m+l .+1n + I m + I
,J,~
I (p,,~,k)
I
where i, j , k are the indices o f the nodes in the x, y, z directions, respectively, m is the i t e r a t i o n n u m b e r and I, J, K are the t o t a l numbers o f nodes in the x, y, z directions, respectively. This ensures the mass i m b a l - ance at each n o d e is less t h a n I 0 -4 o f the inlet mass f l o w rate.
(3) Explicitly calculate the desired velocity and temperature fields at the new time step.
Procedures (1)-(3) were repeatedly applied from the initiation of the transient to a final steady state or to a statistical state when the flow was no longer steady for a long time.
Stringent program tests were carried out in the previous study [2] to verify the proposed solution method. Very good agreement between the present predictions and published results in the literature was shown by comparing our predictions with the exper- imental data for the mixed convective vortex flow in a horizontal flat duct [7, 10]. The comparison of our predicted velocity profile for a typical case with P r = 7 , R a = 2 4 2 0 and A = 3 . 6 3 with the exper- imental data of Ouazzani et al. [13] also shows good agreement. Finally, a grid-independence test was per- formed• Sampled results from this test indicate that the oscillation frequency of the flow, a very important characteristic of the oscillatory flow, calculated from the 9 1 × 1 5 x 1 2 1 , 1 0 1 x 1 5 x 1 2 1 , 9 1 x 2 5 x 1 2 1 and 91 × 15x 131 grids for a typical case with Pr = 0.71, Re = 10, Ra = 5000, A = 12 and L = 15 is 0.513, 0.513, 0.509 and 0.536, respectively. The differences between them all are less than 4%. Moreover, the predicted time oscillations of the axial velocity w and temperature 0 at a large time computed from the four different grid densities also show good agreement. Comparison of the present numerical simulation with our experimental results will be discussed later. Through these program tests, the adopted solution procedures are considered to be suitable for the pre- sent study.
4. RESULTS A N D DISCUSSION
In the following, selected results from the present study will be presented to illustrate the formation of the transverse and mixed vortex roll structures from the initially unidirectional flow and the associated flow and thermal characteristics.
4.1. Experimentally observed Jormation of vortex
s t r u c t u r e s
The formation of the transverse and mixed roll structures from the initially forced convective uni- directional flow observed in this experiment will be investigated first. Before presenting the results it should be noted that the top view flow photos can illustrate the vortex flow formation most clearly and will be examined carefully in the following. To unravel the formation of the moving transverse rolls, the initially unidirectional flow is obtained at first by set- ting the Rayleigh number at a subcritical value for a long period of time at a fixed Reynolds number and then raising the Rayleigh number to a desired super- critical level at which the transverse roils are expected to appear. Due to the large thermal inertia of the bottom (copper) plate, it takes about one to two minutes to raise Ra to the required level. The evolution
Transverse and mixed vortex roll formation 1913
/
/
/
/
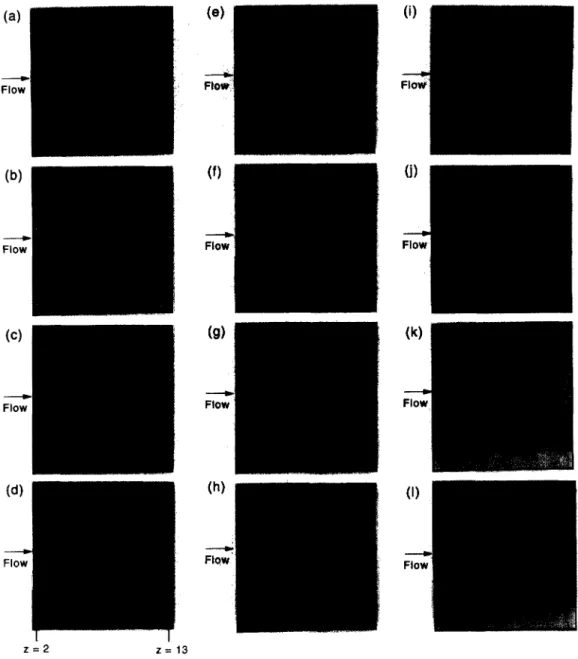
z = 2 z = 1 3Fig. 3. Flow pattern transformation from the unidirectional flow to the transverse rolls by raising Ra from 1500 to 4300 in 110 s at Ra = 5 and t =(a) 0 s (b) 33 s (c) 51 s (d) 60 s (e) 64 s (f) 87 s (g) 95 s (h) 101 s
(i) 120 s (j) 154 s (k) 530 s and (1) 600 s (6 = 7.4 s).
of the transverse vortex flow patterns in this simple experiment for a typical case in which Ra is raised from 1500 to 4300 in 110 seconds with Re -- 5 is por- trayed in Fig. 3. The instant at which we start raising the Rayleigh n u m b e r to 4300 is designated as time t = 0 s. The results indicate that shortly after the start o f the transient at t = 33 s two strong longitudinal vortex rolls already appear near each side wall o f the duct along with a number of weak rolls in the duct core (Fig. 3(b)). As time proceeds, the existing rolls are strengthened and new longitudinal rolls are gradu- ally induced; meanwhile extremely weak transverse rolls are generated in the entry region of the duct, as is evident from a snapshot o f the flow from the top view, shown in Fig. 3(c). T h e n the transverse rolls grow in size and strength and are pushed by the mean
flow to m o v e slowly downstream. In the meantime new transverse rolls are generated in the duct entry. As the transverse rolls travel downstream, they push the longitudinal rolls in front of them forward, but they are also blocked to a certain degree by these longitudinal rolls (Fig. 3(d)-(h)). This mutual inter- action of the rolls causes the transverse rolls to become distorted and curved toward the duct inlet and the longitudinal rolls also become curved. The resulting flow patterns at these intermediate time steps are rather complicated. Later when the highly distorted longitudinal rolls are pushed out of the duct, the trans- verse rolls gradually straighten up (Fig. 3(i)-(j)). With a further elapse of time the longitudinal rolls near the duct sides gradually disappear (Fig. 3 (k)). Finally the pure and regular transverse rolls occupy the entire
1914 M. Y. CHANG et al.
',QI~
I
I
I
i
I
I
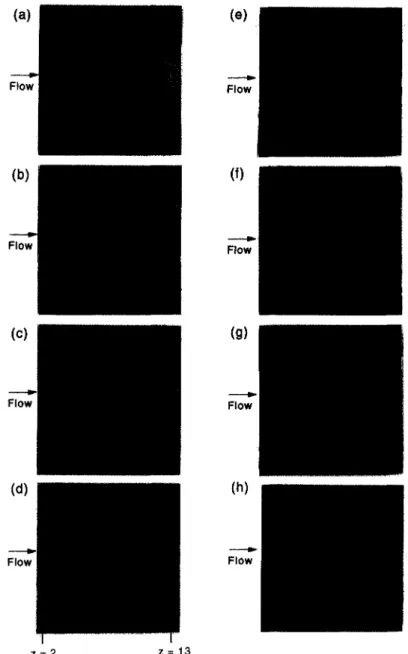
Z = 2 Z = 1 3Fig. 4. Flow pattern transformation from the unidirectional flow to the mixed longitudinal and transverse rolls by raising Ra from 1500 to 4200 in 90 s at Re = 10 and t = (a) 0 s (b) 35 s (c) 49 s (d) 56 s (e) 69 s (f)
86 s (g) 220 s and (h) 300 s (tt, = 3.8 s).
duct (Fig. 3(1)). The flow is found to be time periodic with the period tp = 7.4 s.
An exemplified case is shown in Fig. 4 to show the formation o f the mixed roll structure. The results indicate that upon raising the Rayleigh n u m b e r to 4200 at t = 0, weak longitudinal rolls are subsequently induced near the duct sides in the initially subcritical flow with R e = 10 and R a = 1500. A t this higher Rey- nolds number the longitudinal rolls do not fill the entire duct so that the flow in the duct core is still forced convective and unidirectional (Fig. 4(c)). Later at t = 56 s two short and relatively weak transverse rolls appear in the downstream core region (Fig. 4(d)). As time advances, the transverse rolls gradually m o v e
downstream and expand in the spanwise direction and their vortex intensity increases slowly (Fig. 4(e)-(g)). Meanwhile, new transverse rolls are induced in the entry region. In addition, the longitudinal rolls also get stronger. N o t e that the growth o f the transverse rolls with time and the growth o f the longitudinal rolls with the axial distance cause the longitudinal rolls to be squeezed to a certain degree and the transverse rolls to become slightly bent and distorted. In the interboundary region between the longitudinal and transverse rolls the flow is unstable and irregular. Eventually, a mixed roll structure is formed (Fig. 4(h)). The flow is also noted to be time periodic with tp = 3.8 s.
Transverse and mixed vortex roll formation 1915
4.2. Numerically predicted formation o f vortex struc- tures
The numerical predicted vortex flow formation of the moving transverse rolls to simulate the above experiment can be conveniently illustrated by the results for the local Nusselt number distributions on the bottom plate and the air temperature in the middle horizontal plane at y = 1/2. Fig. 5(a)-(h) presents these results to show the flow formation from an initially steady subcritical flow at Re = 5 and
Ra = 1500 to a final traversing transverse vortex flow at Re = 5 and Ra = 4300. To model the thermal iner- tia of the bottom plate in the experiment, the time constant a is set at 0.35 in this numerical computation. The results in Fig. 5 clearly indicate that immediately after the start of the transient at t = 15.3 s near each side wall a weak longitudinal vortex roll is induced in the initially unidirectional flow. Meanwhile, a pair of weak transverse rolls are induced in the duct entry. Later as the buoyancy gets stronger with time, the rolls grow in size and strength and more longitudinal rolls are induced (Fig. 5(c)). In the entry half of the duct core, a number of recirculating cells prevail. As the process proceeds, at t = 45.9 s the cells merge together to form short distorted transverse rolls which slowly move downstream. Additionally, a new pair of transverse rolls are generated in the duct entry. The transverse rolls are found to merge with the longi- tudinal rolls to form curved rolls (Fig. 5(d)). With a further increase in time the transverse portion of the curved rolls during movement downstream expand in the spanwise direction to become longer. This causes the longitudinal rolls near the duct sides to gradually shrink and finally disappear. At this time the newly generated transverse rolls in the duct inlet extend nearly to the side walls. When the transverse rolls slowly move downstream, the curved rolls are pushed out of the duct (Fig. 5 (e)-(g)). Finally, a regular trans- verse vortex flow is reached at t = 137.7 s and the flow gradually evolves to a time periodic state. A close inspection of the computed time records of the air temperature in the time periodic flow at selected detec- tion points specified in Fig. 2 at selected cross-sections suggests that the entire flow oscillates at a single fre- quency (F = 0.56 or f = 2.88 Hz) and the oscillation amplitude increases significantly with the axial dis- tance in the duct entry z < 5, where the transverse rolls are generated and are developing as they move downstream. As the transverse rolls become fully developed at z >/5 the oscillation amplitude does not vary with the axial distance but changes substantially with the vertical coordinate. A small sample of the time records for 0 and w is shown in Fig. 6. It is also noted that the flow in the entire transient including the initial development and final periodic state is sym- metric with respect to the center vertical plane at x = 6. It is important to realize that the numerically predicted transverse vortex flow evolution discussed above is in qualitative agreement with that observed in the experiment shown in Fig. 3.
In simulating the formation of the mixed roll struc- ture, the initially unidirectional flow at Re = 10 and
Ra = 1500 is first numerically obtained. Then the Rayleigh number is raised to 4200 at t = 0 with the time constant a chosen to be 0.2 to account for the thermal inertia of the bottom plate. The subsequent flow development is again illustrated by the dis- tributions of the local Nusselt number and air tem- perature at the middle horizontal plane and is shown in Fig. 7(a) (h). The results clearly demonstrate that as the transient starts the longitudinal rolls are suc- cessively induced, first near the side wall regions and then extending toward the duct core. At T = 15 (t = 38.3 s) the entire duct is filled with the longi- tudinal rolls. Later, as the buoyancy strengthens, a pair of weak and short transverse rolls are generated in the core region near the duct inlet. With a further increase in time the transverse rolls move downstream and get stronger and larger. The longitudinal rolls ahead of the transverse rolls are gradually pushed out of the duct and the longitudinal rolls adjacent to the transverse rolls merge with the transverse rolls (Fig. 7(e)). Meanwhile, new and longer transverse rolls are induced in the duct entry. As time proceeds, the flow slowly evolves to a time periodic state
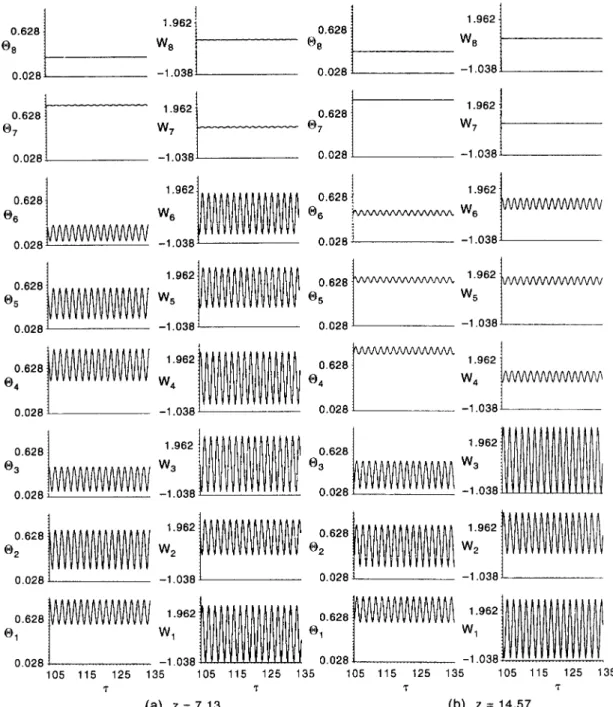
(Zp = 1.88, tp = 4.8 s) as z > 60. The prevalent per- iodic flow is characterized by two longitudinal rolls near each side wall and traversing transverse rolls in the duct core (Fig. 7(g)-(h)). Like the experimental observation, in the interboundary region between the longitudinal and transverse rolls the numerically pre- dicted flow is somewhat irregular. Also, it should be noted that due to the growth of the longitudinal rolls with the axial distance, the transverse rolls are squee- zed to a certain degree and become shorter as they travel downstream. Checking the computed time his- tories of 0 and w shown in Fig. 8(a)-(b) reveals that in the transverse roll region the flow oscillation is much stronger than that in the longitudinal roll region. Additionally, in the transverse roll region the oscillation amplitude is significantly dependent on the vertical position but changes slightly with the axial distance. However, in the longitudinal roll region an increase in the oscillation amplitude with distance from the side wall is observed (Fig. 8(b)).
A comparison of the above numerically predicted evolution of the mixed roll structure with that vis- ualized in the experiment shown in Fig. 4 indicates that qualitative agreement is again reached. However, in the numerical prediction the longitudinal rolls were found to fill the entire duct during the transient stage of flow development. This is not observed in the exper- iment in which the duct is only partially occupied by the longitudinal rolls.
5. CONCLUDING REMARKS
Through a combined experimental flow vis- ualization and three-dimensional unsteady numerical simulation, the present study demonstrates the
1916 M . Y . C H A N G et al. Q,| !
0.1
~,o (t = 45.9 s) 3 (t = 3 0 . 6 s ) qb 3(t=15.3s) (a) ,~= o ( t = o s)Fig. 5. T h e local N u s s e l t n u m b e r d i s t r i b u t i o n o n the b o t t o m p l a t e a n d the t e m p e r a t u r e d i s t r i b u t i o n in the m i d d l e h o r i z o n t a l p l a n e (y = 0.5) for Re = 5 a n d Ra = 4300 a t e i g h t selected t i m e i n s t a n t s (a) z = 0 ( t = 0 ) ; ( b ) ~ = 3 ( t = 1 5 . 3 s ) ; (c) r = 6 ( t = 3 0 . 6 s ) ; ( d ) z = 9 ( t = 4 5 . 9 s ) ; ( e ) ~ = 15 (t = 76.5 s) ; (f)
Transverse and mixed vortex roll formation 1917 | | 1 ,i 0 4 !7 ( t = 1 3 7 . 7 s) qb 0 4 ¢ • " ~1 (t = 1 o 7 . 1 s ) 0. l ° ' ° ~t-o 8(t=91.Ss) O. 1 o~.. ,m (e) ,=15(t=76.ss) Fig. 5 continued.
1918 M . Y . C H A N G et al.
o.6721
2.o881
o.6721
- 3 . 9 1 2
e'oo,2L
w'912~'~ e°
IAAAAAAAA
~:o,,.
.
0.072V V V V V V V VV -3.912
~;.o,~1
_~;o,~~ °;.o,~
~ ; o , ~ 1 w ; o , ~ l
~;o,~
I
~:"
~o,~
w ; ~ ~
-3.912~ . . .
0.072 ~ - 3 . 9 1 2 ' .072 - 3 . 9 1 2 45 50 55 60 45 50 55 60 45 50 55 60 45 50 55 60 T 3" 3" 3" ( a ) z = 3.41 ( b ) z = 7 . 1 3 Fig. 6. T i m e s a m p l e s a t selected d e t e c t i o n p o i n t s f o r w a n d 0 f o r R e = 5 a n d R a = 4 3 0 0 a t c r o s s - s e c t i o n s y ( a ) z = 3.41 a n d (b) z = 7.13.T r a n s v e r s e a n d m i x e d v o r t e x r o l l f o r m a t i o n 1 9 1 9 qb = 30 (t = 76.5 s) qb Q~ 0,0 u¢. o o~. o 15 (t = 38.3 s) ~.~ 0.rj '.5 (t = 19.1 s) i ( a ) ~ = 0 ( t = 0 s ) F i g . 7. T h e l o c a l N u s s e l t n u m b e r d i s t r i b u t i o n o n t h e b o t t o m p l a t e a n d t h e t e m p e r a t u r e d i s t r i b u t i o n i n t h e m i d d l e h o r i z o n t a l p l a n e ( y = 0 . 5 ) f o r R e = 10 a n d R a = 4 2 0 0 a t e i g h t s e l e c t e d t i m e i n s t a n t s (a) ~ = 0 ( t = 0 ) ; ( b ) v = 7 . 5 ( t = 1 9 . 1 s ) ; ( c ) z = 15 (t = 3 8 . 3 s) ; (d) z = 3 0 (t = 7 6 . 5 s) ; (e) ~ = 3 7 . 5 (t = 9 5 . 6 s) ; (f) z = 4 5 (t = 1 1 4 . 8 s) ; (g) z = 55 (t = 140.3 s) ; (h) T = 65 (t = 1 6 5 . 8 s). ( C o n t i n u e d overleaf.)
1920 M.Y. CHANG et al. I h ~ Q.4 Q,g dr.,=, - - ~ 5 (t = 1 6 5 . 8 s) qb Q-i .R. o o ' . o ~c (t = 140.3 s) ( t = 1 1 4 . 8 s ) 9.Q ~2.Q ( e ) ~ = 3 7 . 5 (t = g 5 . 6 s) Fig. 7--continued.
detailed formation of transverse and mixed longi- tudinal and transverse vortex rolls, from the sub- critical flow, in the mixed convection of air in a bottom heated horizontal flat duct. In the early transient the flow is always dominated by the longitudinal rolls near the duct sides. The later induced transverse rolls in the duct entry get stronger with time and move downstream to push the longitudinal rolls in front of them out of the duct. At low Reynolds numbers the transverse rolls are longer and stronger to expel the
longitudinal rolls in the side wall region out of the duct. Thus, a pure and regular transverse roll pattern results. But at a higher Reynolds number the trans- verse rolls are shorter and weaker and the longitudinal rolls stay near the duct sides to form a mixed roll structure. The experimentally observed and numeri- cally predicted vortex pattern are in qualitative agree- ment.
It should be pointed out that the detailed trans- formation processes from one vortex flow pattern to
Transverse and mixed vortex roll formation 1921
0.628
1
080.028}
0.628
0.6281 06]
.
.
o.o28 AM/W
0.628
0.028
IAAAAAAAAAAAAAAA/
~.028 I''''''''vVv''H'
0,628 1
0.028 I
t
1.962 i
1 962 t
W:oj
-1.o381
-11oa8~
1
1.962
W3
-1.038
-1.0380.628
0.028
0.628
070.028
0.628
®6
0.028 I
0.628 vvv~vw~vv~AA~
®5
0.028
0.628
~O~.028
0.628
1O~.028
:° iAAAAAM AAA AA
0.028 l I l l v v V v l I V I V I I I I1.962 i
W8
-1.0381
1.962 1
W7
-1.0381
1.962 lt~AAAAA^AAAAAA^A~
1.962 t
-1.038 1.962 11.962 ~
We -1.038]105 115 125 135
105 115 125 135
105 115 125 135
105 115 125 135
'1" 3" 3" 'T ( a ) z = 7 . 1 3 ( b ) z = 1 4 . 5 7Fig. 8. Time samples at selected detection points for w and 0 for Re = 10 and Ra = 4200 at cross-sections (a) z = 7.13 and (b) z = 14.57.
another, such as the change from the longitudinal to the transverse rolls or to mixed rolls or the reverse processes, are also relatively important in m a n y tech- nological applications and need to be explored in the future.
Acknowledgemen~The financial support of this study by the engineering division of National Science Council of Taiwan, Republic of China through contract NSC83-0404-E009-054 is greatly appreciated.
REFERENCES
I. Evan, G. and Grief, R., A study of traveling wave insta- bilities in a horizontal channel flow with application to
chemical vapor deposition. International Journal o/'Heat and Mass Transfer, 1989, 32, 985-911.
2. Hwang, C. C. and Lin, T. F., Buoyancy induced flow transition in mixed convective flow of air through a bottom heated horizontal rectangular duct. International Journal o f Heat and Mass Transfer, 1994, 37, 1235-1255. 3. Mori, Y. and Uchida, Y., Forced convective heat trans- fer between horizontal flat plates. International Journal of Heat and Mass Transfer, 1996, 9, 803 817.
4. Akiyama, M., Hwang, G. J. and Cheng, K. C., Experi- ments on the onset of longitudinal vortices in laminar forced convection between horizontal planes. Journal o/ Heat Tran.~/~r, 1971, 93, 335 341.
5. Hwang, G. J. and Liu, C. L., An experimental study of convective instability in the thermal entrance region of a horizontal parallel-plate channel heated from below.
1922 M.Y. CHANG et al.
Canadian Journal o f Chemical Engineeriny, 1976, 54, 521 525.
6. Lee, F. S. and Hwang, G. J., Transient analysis on the onset of thermal instability in the thermal entrance region of a horizontal parallel plate channel. Journal of Heat Tran,fer, 1991, 113, 363 370.
7. Ostrach, S. and Kamotani, Y., Heat transfer aug- mentation in laminar fully developed flow by means of heating from below. Journal of Heat Transfer, 1975, 97, 220-225.
8. Kamotani, Y. and Ostrach, S., Effect of thermal insta- bility on thermally developing channel flow. Journal of Heat Tran,~fer, 1976, 98, 62-66.
9. Chiu, K. C. and Rosenberger, F,, Mixed convection between horizontal p l a t e s ~ . Entrance effects. Inter- national Journal of Heat and Mass Transfer, 1987, 30, 1645 1654.
10. Chiu, K. C. and Rosenberger, F., Mixed convection between horizontal plates II. Fully developed flow. International Journal o f Heat and Mass Tran~'['er, 1987, 30, 1655-1662.
11. Luijkx, J. M. and Platten, J. K., On the existence of thermoconvective rolls transverse to a superimposed mean poiseuille flow. International Journal o f Heat and Mass Transfer, 1981, 24, 1287--1291.
12. Ouazzani, M. T., Caltagirone, J. P., Meyer, G. and Mojtabk A., Etude num6rique et exp6rimental de la con- vection mixte entre deux plans horizontaux. Inter- national Journal o f Heat and Mass Tran,~fer, 1989, 32, 261 269.
13. Ouazzani, M. T., Platten, J. K. and Mojtabi, A., Etude exp6rimental de la convection mixte entre deux plans horizontaux fi temp6ratures defferents--ll. International Journal o[' Heat and Mass TransJi, r, 1990, 33, 1417
1427.
14. Yu, C. H., Chang, M. Y. and Lin, T. F., Structures of moving transverse and mixed rolls in mixed convection of air in a horizontal plane channel. International Journal qf'Heat and Mass Transfer, 1997, 40, 333 346. 15. Kline, S. J. and McClintock, F. A., Describing uncer-
tainties in single-sample experiments. Mechanical Engin- eerin9, 1953, 75, 3-12.
t 6. Abernethy, R. B. and Thompson, Jr, J. W., H a n d b o o k - - uncertainty in gas turbine measurement. Technical report No. AEDC-TR-73-5 (AD-755256), 1973. 17. Shah, R. K. and London, A. L., Laminar Flow Forced
Convection in Ducts. Academic Press, New York, 1978, pp. 196~198.
18. Peyret, R. and Taylor, T. D. Computational MethodsJbr Fluid Flow, Chap. 6. Springer-Verlag, New York, 1983. 19. Hirsch, C., Numerical Computation o f Internal and Exter- nalFlow, Vol. I. Wiley, New York, 1989, pp.17(~179. 20. Kawamura, T., Takami, H. and Kuwahara, K., New
higher-order upwind scheme for incompressible navier~ stokes equations. Ninth 1CNMFD, Vol. 10 (1985), pp. 285-291.
21. Anderson, D. A., Tannehill, J. C. and Pletcher, R. H., Computational Fluid Mechanics and Heat Transfer. Hemisphere, Washington, DC, 1984, pp. 71-77.