Department of Business Administration
I-Shou University
Master thesis
Factors that affect the employee loyalty in the
organization
Advisor: CHING SUNG LAI, Ph.D
Co-advisor: HO SY TAM, Ph.D
Graduate Student: VU DUY KHOI
ACKNOWLEDGEMENT
First of all, I would like to thank all professors and staff of I-Shou University, Hong Bang University and Electricity Power University for their teaching and support for the last two years. Especially, I am highly grateful for the guidance of Dr. Ching Chung Guey and Dr. Bui Thi Mong Trang who are my thesis advisors. I also thank leaders and employees from companies I conducted my survey for their kind and enthusiastic support.
I also thank my classmates for their encouragement, cooperation and support both in classes and life. I have learnt much from them and surely shared wonderful experiences with my classmates.
Last but not least, I would like to thank my family for their support and motivation. They have always supported me to overcome hardship and achieve higher goals in my life. Without them, I may not be able to finish my learning in this program. Thank you very much!
ABSTRACT
In Vietnam, the retention of employees is a difficult problem for managers, especially after WTO accession. Apart from the need of high quality human resource, domestic enterprises, which have a demand to expand production, should know how to retain qualified staff to avoid the brain drain. This is a matter of business survival. Thus, the question is that enterprises need to identify, consider and evaluate exactly factors that affect the loyalty of employees. With this study, the author aims to identify factors affecting the loyalty of employees in the enterprises and measure the influence of some factors to the loyalty of employees. In addition, this research also contributes to the further similar research on the loyalty of employees in enterprises to enhance administration or investment.The result of multiple regression analysis has identified that employee loyalty is affected by 06 factors: (1) High income; (2) Favorable working conditions; (3) Conformity to organization goals; (4) Management decision; (5) Fair reward system and (6) Empowerment. Among them, the component Management decision has the most important effect on employee loyalty. It is followed by Conformity to organization goals, Favorable working conditions, Empowerment, Fair reward system respectivelyand finally High income.
Keywords: employee’s loyalty, income, working conditions, conformity, management decision, fairness, empowerment
TABLE OF CONTENTS
ACKNOWLEDGEMENT ... i
ABSTRACT ... ii
TABLE OF CONTENTS ... iii
LIST OF FIGURES ... vi
LIST OF TABLES ... vii
CHAPTER 1 INTRODUCTION ... 1
1.1 THE REASON FOR CHOOSING THE TOPIC ... 1
1.2 THE RESEARCH PURPOSE ... 1
1.3 RESEARCH SUBJECT AND SCOPE OF RESEARCH ... 2
1.4 RESEARCH METHODS ... 2
1.5 PRACTICAL MEANING OF THE THESIS ... 2
1.6 THE STRUCTURE OF THE THESIS ... 2
CHAPTER 2 THEORETICAL FOUNDATION AND RESEARCH MODEL ... 4
2.1 THEORETICAL FOUNDATION ... 4
2.1.1 Some issues about the loyalty of employeesin the organization... 4
2.1.2 Summary of some previous researches on theemployee loyalty ... 6
2.1.3 Factors affecting theemployee loyalty ... 6
2.2 SCALES ARE USED IN RESEARCH MODEL ... 10
2.2.1 Scale of independent components ... 10
2.2.2 Loyalty scale ... 11
2.3 RESEARCH MEDEL ... 12
2.3.1 Sample research model ... 12
CHAPTER 3RESEARCH METHODS ... 14
3.1 DESIGNING RESEARCH ... 14
3.1.1 Qualitative research ... 14
3.1.2 Quantitative research ... 14
3.2 OFFICIAL RESEARCH ... 15
3.2.1 Primarily research and adjusting scales ... 15
3.2.2 Designing scales for questionnaire ... 15
3.2.3 Interpreting and coding scales ... 15
3.2.4 Quantitative Research ... 16 iii
CHAPTER 4 RESEARCH RESULTS ... 18
4.1 THE SYNTHESIS OF SURVEY RESULTS ... 18
4.1.1 Survey results by gender ... 18
4.1.2 Survey results by age ... 18
4.1.3 Survey results by qualifications ... 20
4.1.4 Survey results by job positions ... 20
4.1.5 Survey results by types of business entity ... 21
4.2 DESCRIPTIVE STATISTICS ... 22
4.2.1 Factors affecting the loyalty of employees ... 22
4.2.2 The loyalty of the employees ... 23
4.3 SCALE EVALUATION ... 23
4.3.1 The scale of the independent variables ... 24
4.3.2 The scale of the loyalty ... 24
4.4 FACTOR ANALYSIS ... 24
4.4.1 Factor analysis ... 24
4.4.2 Giving names and explaining factors ... 25
4.4.3 Interpretations of results ... 26
4.5 ADJUSTED MODEL ... 28
4.6 TESTING MODEL ... 29
4.6.1 The Pearson correlation coefficient test ... 29
4.6.2 Regression Analysis ... 30
4.7 RESULTS OF HYPOTHESIS TESTING ... 33
4.8 TESTING THE LOYALTY OF MEN AND WOMEN ... 34
4.10 TESTING THE LOYALTY BY DIFFERENT JOB POSITIONS ... 37
Summary of Chapter 4 ... 40
CHAPTER 5 CONCLUSION AND RECOMMENDATIONS... 41
5.1 CONCLUSION AND CONTRIBUTIONS OF THE THESIS TOPIC ... 41
5.1.1 Conclusion ... 41
5.1.2 Contributions of the thesis topic ... 42
5.2 PRACTICAL SIGNIFICANCE AND MEASURES ... 42
5.2.1 Practical significance ... 42
5.2.2 Recommending some measures to apply research results ... 43
5.3 LIMITATIONS AND THE NEXT RESEARCH TRENDS ... 45
5.3.1 Limitations ... 45 iv
5.3.2 The next researches ... 45
Summary of Chapter 5 ... 46
REFERENCES ... 47
APPENDIX ... 49
LIST OF FIGURES
Figure 2.1: Sample research model ... 12 Figure 2.2: Research model ... 13 Figure 3.1: Flowchart of the research design ... Error! Bookmark not defined. Figure 4.1: The adjusted research model ... 28
LIST OF TABLES
Table 3.1: Components scale after adjusting the independent variables... 15
Table 3.2 Loyalty scale ... 16
Table 4.1: The survey results of the number of employees by gender... 18
Table 4.2: Survey results of the number of employees by age ... 19
Table 4.3: The survey results of the number of employees by qualifications ... 20
Table 4.4: The survey results of the number of employees by job positions ... 21
group leader/expert ... 21
Table 4.5: The survey results of the number of employees by types of business entity ... 21
Table 4.6: Descriptive statistics of the factors affecting the loyalty of employees ... 22
Table 4.7: Descriptive statistics of the variables of the employee loyalty ... 23
Table 4.8: The correlation matrix between the variables ... 29
Table 4.9: The descriptive statistics of the factors of model ... 30
Table 4.10: The assessment on the appropriateness of the model ... 31
Table 4.11: ANOVA Testing the appropriateness of the model ... 31
Table 4.12:The regression results using the Enter method ... 32
Table 4.13: Determination of the importance of the independent variables ... 32
Table 4.14: Testing the loyalty of men and women ... 35
Table 4.15: Testing the loyalty by education level ... 36
Table 4.16: Table of testing of the loyalty by job position ... 38
Table 4.17: Table of testing of the loyalty by types of business entity ... 39
CHAPTER 1 INTRODUCTION
1.1 THE REASON FOR CHOOSING THE TOPIC
At present, in the harsh conditions of the market, the competition in human resources has always been a serious challenge in the companies. Therefore, in order to attract talented people, many enterprises continuously improve the policy on human resource development of which compensation and other benefits are becoming issues the employers care.
Personnel management includes many aspects such as timekeeping, payroll, selecting, recruiting, training, coaching, evaluation of employee performance, drafting compensation policy, and other incentive compensations. However, one of the most important issues that recruiting officers cannot be ignored is planning and implementing human resource development strategy, attracting talents to work at their company and not letting them to worry about “the grass always looks greener on the other side of the fence.”
All managers recognize that they pay very high prices for losing key partners. One of the usual problems is that the departure of key partners will bring about the loss of VIP customers. The research shows that up to 70% of loss of customers involves in losing key employees. Besides, if key employees continuously leave, it will cause the leaving of entire staff.
In Vietnam, the retention of employees is a difficult problem for managers, especially after WTO accession. Apart from the need of high quality human resource, domestic enterprises, which have a demand to expand production, should know how to retain qualified staff to avoid the brain drain. This is a matter of business survival. Thus, the question is that enterprises need to identify, consider and evaluate exactly factors that affect the loyalty of employees. Then, on the ground of it, they will have appropriate direction in human resource management and take positive action to retain those for enterprises to avoid the brain drain in the future. It is the reason I chose the topic “Factors that affectthe
employee loyalty in the organization”. 1.2 THE RESEARCH PURPOSE
The purposes of the research are as follows:
To identify factors affecting the loyalty of employees in the enterprises
To measure influence of some factors to the loyalty of employees
In addition, this research also contributes to the further similar research on the loyalty of employees in enterprises to enhanceadministration or investment.
1.3 RESEARCH SUBJECT AND SCOPE OF RESEARCH
Research subjects arethose who are currently working in the organizations such as Limited Liability Company, Joint Stock Company, Private enterprise, State-owned company, Joint venture company, and 100% Foreign Direct Investment Enterprise.
Because of limited ability and time, my research replies on database of subjects working only in Ho Chi Minh City with job positions such as staff, team leaders/specialist, managers.
1.4 RESEARCH METHODS
The research includestwo following stages:
Stage 1:It uses qualitative methods to confirm and complement criteria forevaluating,
adjusting the scale and designing a questionnairefor quantitative research process.
Stage2: It uses quantitative methods. From the measured variables in qualitative
research, Iidentify factors andmeasurementattributes. Then, final adjustment scale is used for formal interview.
Sample and sample information: quantitative survey is conducted in Ho Chi Minh City. Subject samples are those who are now working at the companies in Ho Chi Minh City.They are intervieweddirectly with a questionnaire. Sampling method selects some students randomly in the classrooms at night (in service, second-degree certificate, master and so on) in the universities in Ho Chi Minh City (University of Economics Ho Chi Minh City, Open University, University of Sciences, and University of Industry)
1.5 PRACTICAL MEANING OF THE THESIS
Result of the research helps to identify which factors are affecting the loyalty of employees. Based on this, enterprises will focus on necessaryresources to adjust or develop suitable personnel policies. Moreover, they give the methods to motivate employeesaiming at retainingthem for enterprise.
1.6 THE STRUCTURE OF THE THESIS
The content of the thesis includes five chapters: 2
Chapter 1: Overview
Chapter 2: Theoretical foundation and research model Chapter 3: Research methods
Chapter 4: Research results
Chapter 5: Conclusions and suggestions
CHAPTER 2 THEORETICAL FOUNDATION AND
RESEARCH MODEL
2.1 THEORETICAL FOUNDATION
2.1.1 Some issues about the loyalty of employeesin the organization 2.1.1.1 Concept
There are many approaches in researching about the loyalty of employees. Loyalty can be an element of organizational commitment,and be anindependent concept. Allen & Mayer (1990) focused on three psychological conditions when employees work in the organization. Itmight be from their true feelings.They stay despite having higher salaries and better working environment.They do not have the opportunity to earn better jobs, orsimply they espouse the ethical standards. Cook & Wall (1980) concerned about aspects of employee behaviors. According to Mowday, Steers and Porter (1979), loyalty is the “intention or desire to maintain as a member in the organization”. Mowday’s famous definition of loyalty is similar to the concept of “Maintaining” in a study of Aon Consulting Institute at thenation level in many years. Employees intend to stay in an organization/enterprise although others offer much more attractive wages (Stum 1999, 2001). According to Johnson (2005), employees “are more loyal to their careerthan to employers”and“the nature in the relationship between employees and employers has fundamental changes and it is needful to judge againthe loyal concept” (Reevaluating Loyalty). In the current labor market, many employers find hard to retain their staff because of the attractiveness and potential wealth from stock market (Cheryl Breetwor 2007). In Vietnam, the appearance of many foreign investors and the shortage of high quality human resourcesfrom banks after Vietnam’s accession to the WTOmake the labor market hotter. Staff makes the request so they could be loyal to the company. Some of them consider income as the most important factor in their job. Many of them want to work at the place that has the same core values. Others desire to have the opportunity to learn and develop them. According to Jaerid Rossi (adapted from Penelope Trunk (2007),“Being similar to the function of time, loyalty is a wishing idea, the job is really attractive only whenthey usually learn”.Contrarily, “companies do not want blind loyalty;the best form of loyalty comes when both companies and employees have mutual benefits”. According to
The Loyalty Research Center, 2004,“Loyalty of employees is when they commit to the organization’s success and believe that working here is the best their choice”. In employees’ loyalty scale model of Man Power (2002), the standard to evaluate loyalty includes “the willingness to recommend their company as a good place to work,the willingness to introduce products and services of the company,and the long-term commitment to the company”.
A few general managers said that the organizations want to have an excellentemployee for three years rather than a lifelong bademployee. However, a new point of view of loyalty is not popular in Vietnamese enterprises and it has difficulties in measuring. Therefore, this research is still using definition of loyalty (Mowday et al.,1979), with the staff loyalty scale of Man Power (2002).
2.1.1.2 Benefits of building and maintaining the loyalty of employees
Value of employeeloyalty is extremely large, such as reducing costs to change employee, and the benefits of retaining experienced staff is invaluable. Theover 40-year-old managersmight remember that everything making employees loyal todayis different from what makingthem loyal in the past. Seniority, work experience and stability of the enterprise are what we think first. However, beyond personal experience,they will give us an overview of the benefits in organizations about building and maintaining the loyalty of employees in the current context:
- In terms of revenue, the loyal employees tend to work better than what customers expect and they always have high spiritwiththe best their ability. Both features are so important that the company retain loyal customers and makehigh revenue in the future.
- In terms ofcosts, loyal staff will work at the company for a long time, decline the offer from competitors, do not actively look for a new job and always introduce their company as a good place to work. All four attitudes positively affect the cost column in the balance sheet because the company will be prevented fromsignificant costs for changing staffs.
In the other hand, instead of focusing on holding staffs (try to retain those quitted), the employersshould be more active in recognizing the benefits of understanding, managing and enhancing the loyalty of employees.
Thus, although the loyalty of employeesis confirmed as one of the factors affecting the business success, it is not surprising when companies and organizations are facing with several challenges in developing a passionate and dedicated group.
2.1.2 Summary of some previous researches on theemployee loyalty
There are many researches on the loyalty of employees, but most of them just focused on researchinga generalaspect such as whether organizational culture or leadership styles affect the employee loyalty or not. Thus, no research has ever mentioned specific factors affecting employeeloyalty. In this research, it will investigate each specific element like income, favorable work conditions or appropriate targets that could affect theemployee loyaltyin the enterprises.
2.1.3 Factors affecting theemployee loyalty 2.1.3.1 Income
Wages have many different names such as labor compensation, labor income.In France, “remunerationmeans the salary orthe basic, ordinary or minimum wages and all interests, additional things, whichis paid directly or indirectly, in cash or in kind by the employers to workers”. In Taiwan, “compensation is everything that workers are given;regardless of wages, salaries, wage allowances,bonuses or any nominal paid to them hourly, daily, monthly orby the product”. In Japan,“salary, regardless of calling as salary, wages,money divided interest or othernames, is just remuneration that employers pay for workers”.
Remuneration is always one of the most challenging issue for managers in every enterprise. Enterprises often have multiple points of view and different objectives when building remunerationsystem, but generally,they have four basic objectives such as attracting employees, maintaining good employees, motivating employees and meeting the requirements of the law.
- Attracting employees:The enterprises, which pay more, improve their ability to attract good candidates from the local market.
- Maintaining good employees:in order to maintain good employees for the enterprise, they not only pay highly but alsoensure the fairnessin the enterprise. - Motivating employees: all elements included in workers’ income, which consist of
basic salary, bonus and benefits, allowances, should be used effectively to motivate all employees.
- Meeting the requirements of the law: the basics of law related to remuneration in enterprises often focus on the following issues: minimum salary regulations, time and working conditions regulations, children labor regulations, wage allowances, social welfare such as social insurance, sickness, maternity leave and labor accidents (Dung, 2000).
When mentioning job and work quality, most peopleusuallymeasure through income that the job brings. Therefore, income is considered as a measurement for the job as well as the success of the employees at work.
High income makes people more satisfied physically so they dedicate easily, pay more attention to work and try to prove their value. Thus, it greatly affects the working spirit of the staff, in the following aspects:
When employees earn wages that are suitable for their dedication, they will workenthusiastically.
They have little intention of leaving the company to looking for another job while working and being satisfied with their income.
They have greater spirit and responsibilityto the work that they are in charge of. They are more disciplined in abiding by the rules and self-controlled.
Thus, hypothesis is formulated:
H1: High income will make employees more loyal to the company.
2.1.3.2 Favorable working conditions
Workers is always interested in working environment because it is related to personal convenience, also helps them complete missions effectively. They do not like dangerous, unfavorable and inconvenient working environment. Temperature, lighting, noise and other
environmental factors must besuitable. Moreover, some prefer working closer to their house, with clean, modern means of work, and appropriate equipment (Lam, 1998).
Thus, hypothesis is formulated:
H2: Favorable working conditions make workers more loyal to the organization.
2.1.3.3 The congruous target
Congruous target occurs when employees realize that their goals and values match to the company and they make commitmentto it (Hart, 1994; Vancouver& Schmitt, 1991). The target is also equivalent to the concept of individual-organization harmony, which is defined as the appropriateness between values, personal beliefs and the rules and values of organization (Netemeyer & CTG, 1997; O’Reilly & CTG, 1991). Different definition of individual-environment harmony includes harmony between individual-group and harmony between individual-work. By the way, the individual-organization harmony (congruous target) is the most important foundation for forecasting inmany factors studied (Chatman, 1991; Kristof, 1996; Van Vianen, 2000). The congruous target is associated withbehavior results and influences such as staying longer, being more devoted to enterprises and being better in job (O’Reilly & CTG, 1991; Vancouver & Schmitt, 1991). Research in sales planning indicates that the congruous target is a pre-condition for a positive working attitude and behavior’s staffs (Netemeyer & CTG, 1997). Commitment to organization’s objectives and values playan important role in servicesector and retail sector. The implementation of the policies and activities of an organization relating to service requires the commitment of staff to its goals and values (Hartline & CTG, 2000).
Thus, hypothesis is formulated:
H3: The congruous target makes staff more loyal to the organization.
2.1.3.4 Support from the superior
Support from superior is an important thing in the research (Podsakoff & CTG, 1996). It is defined as the level of consideration and support that staffs receive from the supervisor (Netemeyer & CTG, 1997). An understanding leader shouldbe talented and treat employees fairly, encourage two-way communication, and recognize the contributions of employees to the implementation of goals of the organization (Humphreys, 2002; Singh, 2000).
Thus, hypothesis is formulated:
H4: Having the support from superiors makes staff more loyal to the organization.
2.1.3.5 Support from colleagues
The behavior of leadership is also key factor to determine satisfaction. Satisfaction of employees increases when their leader is knowledgeable and friendly. They know how topraise employees whenthey work well, and listento employees’opinions, and careabout the benefit of workers (Lam, 1998).
Thus, hypothesis is formulated:
H5: Having support from colleagues makes staff more loyal to the organization.
2.1.3.6 Fair reward
Fair reward exists when the staffs were rewarded worthily with work pressure and mission completed (Netemeyer & CTG, 1997). It replies onthe concept of fair distribution (Lane & Messe, 1971). The concept encompasses both distributed fairness and procedures. Nevertheless, previous researches indicate that the distributed fairness is more important in work relationships than in fair procedures (Netemeyer & CTG, 1997; Organ, 1998).
Equity theory points out that each individual follows a particularlyequitable rule affecting his or her attitudes and behaviors (Lane & Messe, 1971). This shows that staffs who are rewarded fairly will have a positive attitude andsupport their organizations.
Thus, hypothesis is formulated:
H6: Fair reward makes employees more loyal to the organization.
2.1.3.7 Empowerment
Empowerment exists when the supervisors believe in the ability to makedecision of supporters and encourage them to give an idea (Conger & Kanungo, 1998; Hartline & CTG, 2000). Empowerment is similar to the self-governing (Singh, 2000, Varca, 2001). The center of both concepts is the willingness of supervisors to empower subordinates to make decisions within the regulations and give an idea. It can be a tool to increase effectiveness in anorganization because it enhanceswork performance of the staff (Conger
& Kanungo, 1988). It is particularly important for employees who directly contact customerssince it creates the flexibility to meet the requirements of customers (Bowen & Lawler, 1992).
Thus, hypothesis is formulated:
H7: Givenempowerment in making decision at work makes employees more loyal to the organization.
2.2 SCALES ARE USED IN RESEARCH MODEL
Scales that are used in research model includethe scale of independent components and the scale of dependent components.
2.2.1 Scale of independent components
Scale of independent components include the following scales:
The component of high income
The component of “High income”is measured by three observedvariables:
1) My current salary is proportional to my working capacity. 2) I completely have a good life with my current salary. 3) I think that mycompany paysfairly salary.
The component of favorable working condition
The component of “Favorable working condition”is measured by four observed variables:
1) Equipment,which supports my work,is very well.
2) The airy and convenient office makes me feel comfortable.
3) Temperature, light and noise in the company are suitable for my work. 4) I feel safe in my workplace.
The component of congruous target
The component of “Congruoustarget”is measured by four observed variables:
1) I thinkmy abilityfit the job requirements of the organization. 2) I undertake to do the objectives of the organization.
3) I agree with the business policies of the organization.
4) My development objective is similar to that ofthe organization.
The component of support from superiors
The component of “Support from superiors”is measured by threeobservedvariables:
1) I always have direct support from superiors in all areas. 2) Superior always supports me when problems arise.
3) I often get the support from superiors when things go badly.
The component of support from colleagues
The component of “Support from colleagues” is measured by two observedvariables:
1) My supervisor always listens to employees’ opinions and caresabout their benefits. 2) My superior is always knowledgeable, friendly and approachable.
The component offair reward
The component of “Fair praise” is measured by five observedvariables
1) I am rewarded fairlythrough mission completed. 2) I am rewarded fairly throughjob responsibilities. 3) I am rewarded fairly through my efforts.
4) I am rewardedfairly when working under pressure. 5) I am rewarded fairlywhen accomplishing job well.
The componentof Empowerment
The component of “Empowerment” is measured by five observed variables:
1) The superior assigns work to me and let me do it. 2) The superior empowers me to make decision.
3) The superior believes in my ability to make decision. 4) The superior encourages me to use power.
5) The superior believes in my evaluation of job performance.
2.2.2 Loyalty scale
The component of “Loyalty”is measured by three observed variables: 11
1) I am willing to introduce about my company as a good place to work. 2) I am proud of introducing the product/service of company.
3) I will stay with the company for a long time regardless of more attractive salaries in somewhere.
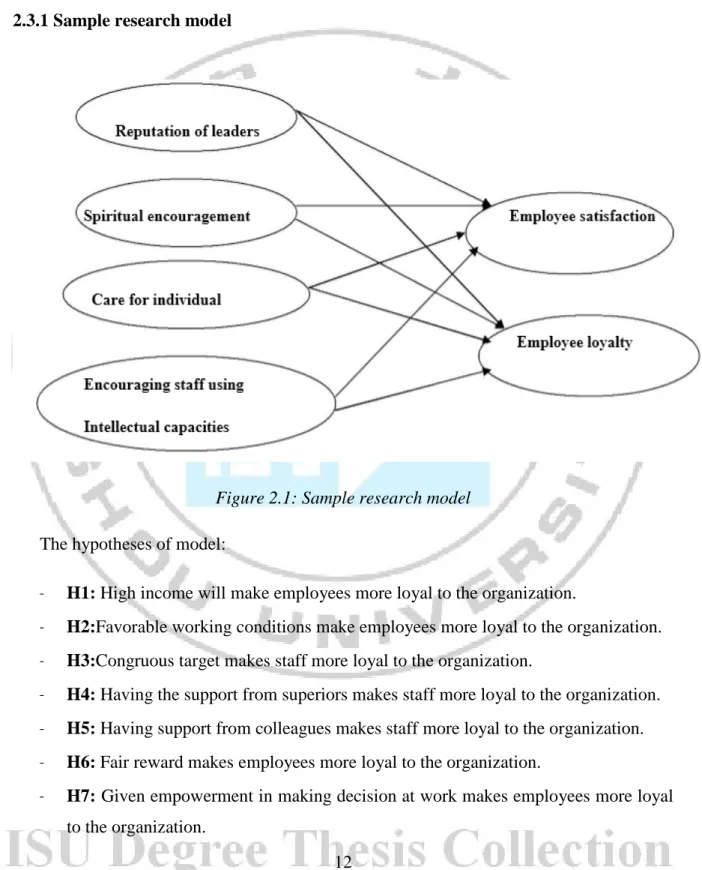
2.3 RESEARCH MODEL 2.3.1 Sample research model
Figure 2.1: Sample research model
The hypotheses of model:
- H1: High income will make employees more loyal to the organization.
- H2:Favorable working conditions make employees more loyal to the organization. - H3:Congruous target makes staff more loyal to the organization.
- H4: Having the support from superiors makes staff more loyal to the organization. - H5: Having support from colleagues makes staff more loyal to the organization. - H6: Fair reward makes employees more loyal to the organization.
- H7: Given empowerment in making decision at work makes employees more loyal to the organization.
Based on the above research model by Tran Thi Thu Trang (2006) and qualitative research process, we have builtthe following model as illustrated in figure 2.2.
Figure 2.2: Research model
High income Favorable working conditions Congruous target Support from superior Support from colleagues Fair reward Empowerment Loyalty 13
CHAPTER 3 RESEARCH METHODS
3.1 DESIGNING RESEARCH
The research is conducted in two stages: qualitative research and quantitative research
3.1.1 Qualitative research
The first step of qualitative research is to adjust the scales. According to a pre-prepared contentsreplying on available scales, variables are adjusted and addedby bilateral discussion.It would berecorded and then synthesizedasa foundation for adjusting and adding variables.
Information needs to be collected:
- Determining howHR managers understand staff demand. According to them, which factors could make employees more loyal to the organization?
- Defining what employees expect in the organization.In their opinion, whichfactors make them more loyal to the organization?
3.1.2 Quantitative research
This is the officialstage of research with data collection technique of interviewthrough aquestionnaire. Data is processed by SPSS software. After coding and screening data, the formal analyses are conducted:
- Evaluating the reliability of scale: reliability of scales is evaluatedby using Cronbach’scoefficient Alpha.Variables is rejected if the corrected item-total correlation is small (<0.3) and the scale is accepted when having suitable Cronbach’s coefficient Alpha (> 0.6).
- Using factor analysisto check the convergence of component variables for the concept. Variableshavefactor loading less than 0.5 will be rejected. Principal axis factoring methodand Promax rotation would be done and stopped when takingEigenvalue factors greater than 1.
- Testing hypotheses about structural model and relevance to overall model.
In this study, the significance level is set to be 5%. The model of multiple regression is as follows.
Loyalty = B0 + B1 * High Income + B2 * Favorable working conditions + B3 *
Congruoustargets + B4 * Support from superiors + B5 * Support from colleagues + B6 *
Fairreward + B7 * Empowerment
- Next, using T-test and ANOVA analysis (Analysis Of Variance) to find significant differences between different groupsand components of the structural model.
3.2 OFFICIAL RESEARCH
3.2.1 Primarily research and adjusting scales
There are 23 individuals representing management department and staffs participated in the interview in theform of direct discussionon the ground of pre-prepared outline. Results from preliminary research are presented in the next adjustment of scale.
3.2.2 Designing scales for questionnaire
All observedvariables in the components use 5-point Likert scale, in which number 1means “totally disagree” with the statement and number 5 means “totally agree" with the statement.
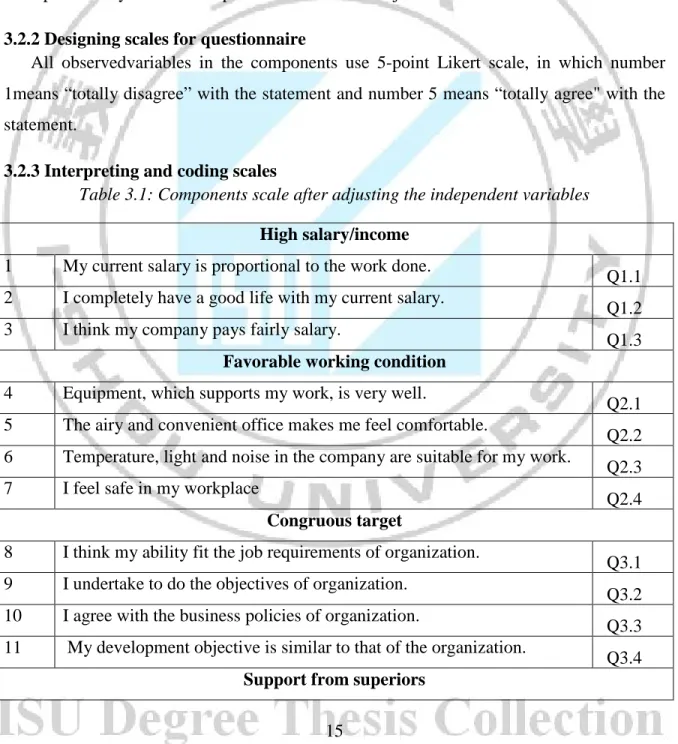
3.2.3 Interpreting and coding scales
Table 3.1: Components scale after adjusting the independent variables
High salary/income
1 My current salary is proportional to the work done.
Q1.1 2 I completely have a good life with my current salary.
Q1.2 3 I think my company pays fairly salary.
Q1.3
Favorable working condition
4 Equipment, which supports my work, is very well.
Q2.1 5 The airy and convenient office makes me feel comfortable.
Q2.2 6 Temperature, light and noise in the company are suitable for my work.
Q2.3 7 I feel safe in my workplace
Q2.4
Congruous target
8 I think my ability fit the job requirements of organization.
Q3.1 9 I undertake to do the objectives of organization.
Q3.2 10 I agree with the business policies of organization.
Q3.3 11 My development objective is similar to that of the organization.
Q3.4
Support from superiors
12 I always have direct support from superiors in all areas. Q4.1 13 Superior always supports me when problems arise.
Q4.2 14 I often get the support from superiors when things go badly.
Q4.3
Support from colleagues
15 My supervisor always listens to employees’ opinionsand cares about their benefits.
Q5.1 16 My superior is always knowledgeable, friendly and approachable.
Q5.2
Fair reward
17 I am rewarded fairly through mission completed.
Q6.1 18 I am rewarded fairly through job responsibilities.
Q6.2 19 I am rewarded fairly through my efforts.
Q6.3 20 I am rewarded fairly when working under pressure.
Q6.4 21 I am rewarded fairly when accomplishing job well.
Q6.5
Empowerment
22 The superior assigns work to me and let me do it.
Q7.1 23 The superior empower me to make decision.
Q7.2 24 The superior believe in myability to make decision.
Q7.3 25 The superior encourages me to use power.
Q7.4 26 The superior believe in my evaluation ofjob performance.
Q7.5
Table 3.2 Loyalty scale
Loyalty
1 I am willing to introduce about my company as a good place to work.
Y1 2 I am proud of introducing the product/service of company.
Y2 3 I will stay with the company for a long time regardless of more
attractive salaries elsewhere.
Y3
3.2.4 Quantitative Research 3.2.4.1 Designing samples
a) Subjects collected
Subjects are those who currently work in organizations such as Limited Liability Company, Joint Stock Company, Private Enterprise, State-owned Company, Joint Venture
Company, and 100% Foreign Direct Investment Enterprisewith job positions such as staffs, team leaders/specialist, managers.
b) Sampling frame
Sampling frame is a part of overallsamples, which are selected for observation. Sampling frame is onlylimited in Ho Chi Minh City.
c) Sampling method
There are two methods including probability sampling and non-probability sampling. Probability sampling method is a method whichresearchers foresee the participation probabilityof element. Non-probability sampling methodis selecting elements for the samplethat does not follow random regulation. In this research, we useprobability-sampling method.
d) Sample size
In the model shown above, seven research hypotheses and 29 observed variables have been identified and 5-point Likert scale was used. Therefore, the minimum ruleis 5 x 3 = 15 samples for measurementvariables (Bentle & Chou, 1987), then initial samplesare29 x 15 = 435.To reserve case study patterns generated and collected enough respondents, the votes emitted aredetermined to be 600 questionnaire survey.
e) Sampling
Sampling method randomly selects some students in the classrooms at night (in service, second-degree certificate, master) at universities in Ho Chi Minh City (University of Economics Ho Chi Minh City, Open University, University of Sciences, University of Industry)
3.2.4.2 Results and information about sample
Detailed questionnaire is presented in Appendix A.
It has 600 questionnaires that are sent directly to the subjects. During the survey, some groups of subject do not work now and questionnaires leave blank. All of them will be removed before data entry. Thus, the number of formal questionnaire analyzed is only 453,accounting for 76% total panel sent out.
3.2.4.3 Collecting and analyzing data
Using data processing techniques by SPSS Software, testingisconducted through the following steps:
1) Preliminarily evaluating the scale and reliability of the variables measured by Cronbach’s coefficient Alpha and factor loading by Exploratory Factor Analysis
2) Testing hypotheses about structural model and relevanceto overall model. Next, using T-test and ANOVA analysis (Analysis Of Variance) between different groups and components of the structural model tested to find significant differences of a few specific groups.
CHAPTER 4 RESEARCH RESULTS
4.1 THE SYNTHESIS OF SURVEY RESULTS 4.1.1 Survey results by gender
According to the survey results, the total number of female employees is 283 (accounting for about 62.5%) and the total number of male employees is 170 (accounting for about 37.5%).
Table 4.1: The survey results of the number of employees by gender
Cumulative
Frequency Percent Percent
female 283 62.5 62.5
male 170 37.5 100.0
Total 453 100.0
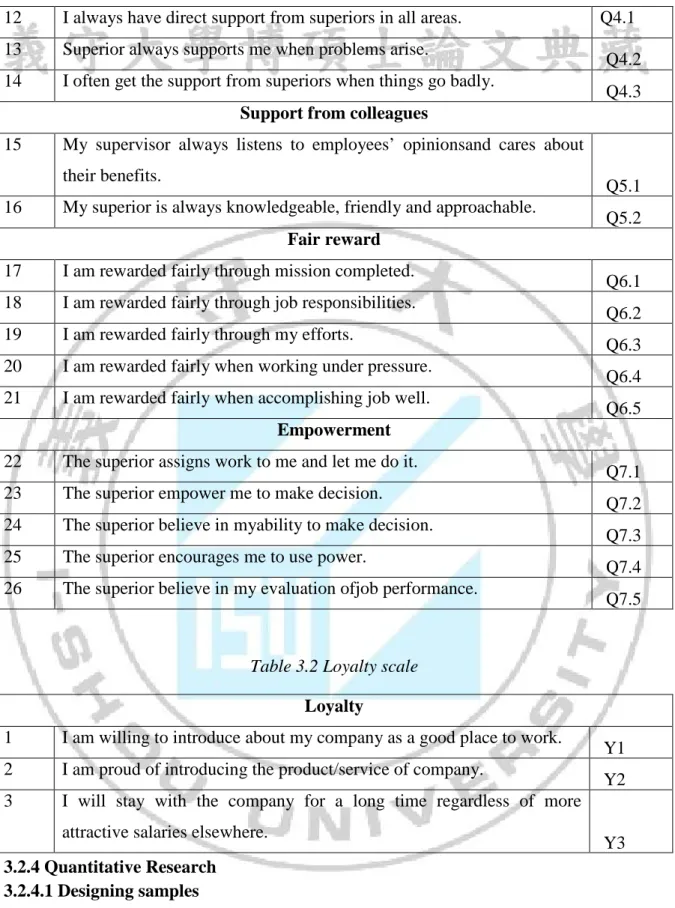
4.1.2 Survey results by age
According to the survey results, the greatest group of employees is between the age of 21 and 30 with 351 people, accounting for 77.5% (including 241 women and 110 men). It is followed by the number of 90 employees (including 36 women and 54 men) who are between 31 and 40 years of age, accounting for about 19.9%. The two remaining groups of employees who are under 20 yeas of age and over 40 years of age comprise only 12 people.
Table 4.2: Survey results of the number of employees by age
Gender Group Total
female male
Count
Col %
Count Col % Count Col %
Age <20 2 .7% 2 .4% 21-30 241 85.2% 110 64.7% 351 77.5% 31-40 36 12.7% 54 31.8% 90 19.9% >41 4 1.4% 6 3.5% 10 2.2% Group Total 283 100.0% 170 100.0% 453 100.0% 19
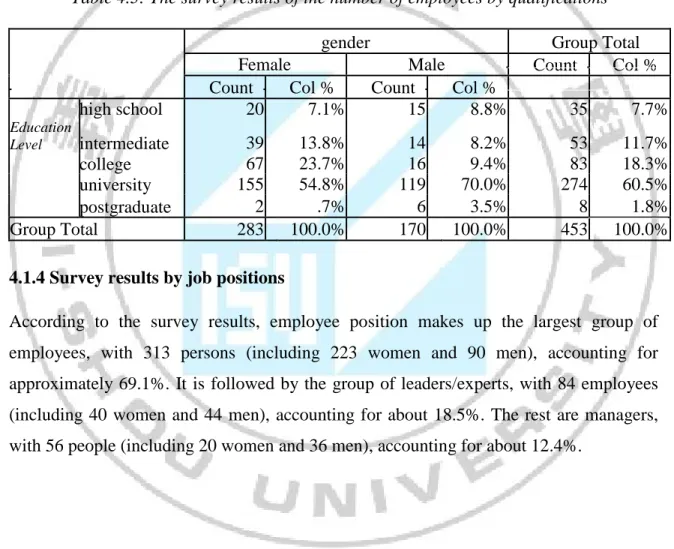
4.1.3 Survey results by qualifications
According to the survey results, the largest group of employees, with 274 people (including 155 women and 119 men), comprises those who have the undergraduate degree, accounting for approximately 60.5%. In the second largest group, 83 employees (including 67 women and 16 men) have college degree, accounting for about 18.3%. After that, 53 people (including 39 women and 14 men) have intermediate level, accounting for 11.7%. It is followed by those at high school level, with 35 employees (including 20 women and 15 men), accounting for about 7.7%. The remaining 8 people (2 women and 6 men) with postgraduate employees account for approximately 1.8%.
Table 4.3: The survey results of the number of employees by qualifications
gender Group Total Female Male Count Col % Count Col % Count Col %
high school 20 7.1% 15 8.8% 35 7.7% Education Level intermediate 39 13.8% 14 8.2% 53 11.7% college 67 23.7% 16 9.4% 83 18.3% university 155 54.8% 119 70.0% 274 60.5% postgraduate 2 .7% 6 3.5% 8 1.8% Group Total 283 100.0% 170 100.0% 453 100.0%
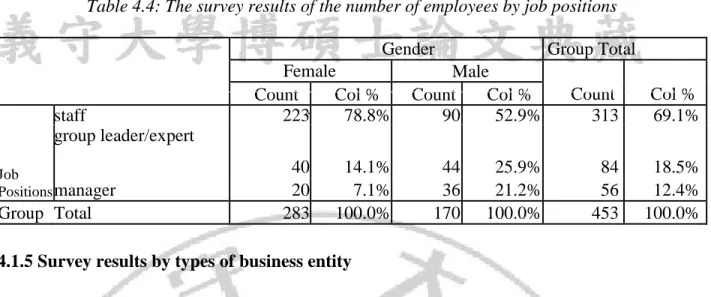
4.1.4 Survey results by job positions
According to the survey results, employee position makes up the largest group of employees, with 313 persons (including 223 women and 90 men), accounting for approximately 69.1%. It is followed by the group of leaders/experts, with 84 employees (including 40 women and 44 men), accounting for about 18.5%. The rest are managers, with 56 people (including 20 women and 36 men), accounting for about 12.4%.
Table 4.4: The survey results of the number of employees by job positions
Gender Group Total Female Male
Count
Col % Count Col % Count Col %
Job Positions staff 223 78.8% 90 52.9% 313 69.1% group leader/expert 40 14.1% 44 25.9% 84 18.5% manager 20 7.1% 36 21.2% 56 12.4% Group Total 283 100.0% 170 100.0% 453 100.0%
4.1.5 Survey results by types of business entity
According to the survey results, those who work for the joint stock companies make up the largest group, with 130 people (including 76 women and 54 men), accounting for about 28.7%. It is followed by the group of employees working for the limited liability companies, with 125 people (including 94 women and 31 men), accounting for approximately 27.6%. The state and private companies share the same number of people working for them, with 72 people each type, accounting for about 15.9%. The number of people working for 100 percent foreign-owned enterprises is 28 people, accounting for 6.2%. Finally, people who work for the joint-venture companiesmake up the smallest group with 26 people, accounting for about 11.7%.
Table 4.5: The survey results of the number of employees by types of business entity
Gender Group Total Female Male
Count
Col % Count Col % Count Col %
Types of business entity LLC 94 33.2% 31 18.2% 125 27.6% JSC 76 26.9% 54 31.8% 130 28.7% PE 47 16.6% 25 14.7% 72 15.9% GOC 37 13.1% 35 20.6% 72 15.9% JVC 12 4.2% 14 8.2% 26 5.7% SCIC 17 6.0% 11 6.5% 28 6.2% Group Total 283 100.0% 170 100.0% 453 100.0% 21
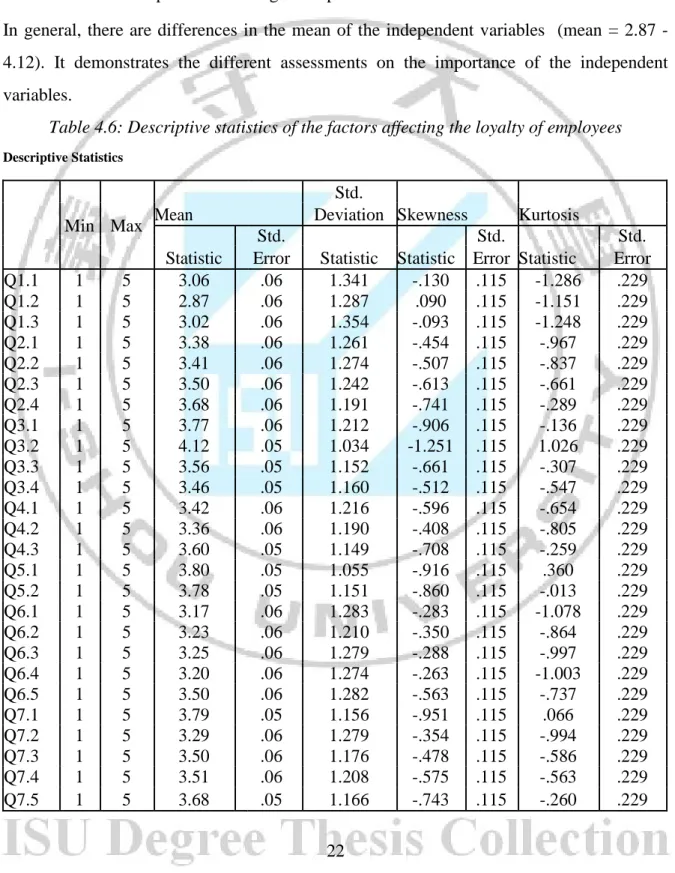
4.2 DESCRIPTIVE STATISTICS
4.2.1 Factors affecting the loyalty of employees
Statistical results show that the employees rank the factors as being very low to very high. It means that, for the same statement, there are some totally agree and some totally disagree. This can be explained by the samples which were collected in many different enterprises which have different personnel management policies.
In general, there are differences in the mean of the independent variables (mean = 2.87 - 4.12). It demonstrates the different assessments on the importance of the independent variables.
Table 4.6: Descriptive statistics of the factors affecting the loyalty of employees
Descriptive Statistics
Std.
Min Max Mean Deviation Skewness Kurtosis
Std. Std. Std.
Statistic Error Statistic Statistic Error Statistic Error Q1.1 1 5 3.06 .06 1.341 -.130 .115 -1.286 .229 Q1.2 1 5 2.87 .06 1.287 .090 .115 -1.151 .229 Q1.3 1 5 3.02 .06 1.354 -.093 .115 -1.248 .229 Q2.1 1 5 3.38 .06 1.261 -.454 .115 -.967 .229 Q2.2 1 5 3.41 .06 1.274 -.507 .115 -.837 .229 Q2.3 1 5 3.50 .06 1.242 -.613 .115 -.661 .229 Q2.4 1 5 3.68 .06 1.191 -.741 .115 -.289 .229 Q3.1 1 5 3.77 .06 1.212 -.906 .115 -.136 .229 Q3.2 1 5 4.12 .05 1.034 -1.251 .115 1.026 .229 Q3.3 1 5 3.56 .05 1.152 -.661 .115 -.307 .229 Q3.4 1 5 3.46 .05 1.160 -.512 .115 -.547 .229 Q4.1 1 5 3.42 .06 1.216 -.596 .115 -.654 .229 Q4.2 1 5 3.36 .06 1.190 -.408 .115 -.805 .229 Q4.3 1 5 3.60 .05 1.149 -.708 .115 -.259 .229 Q5.1 1 5 3.80 .05 1.055 -.916 .115 .360 .229 Q5.2 1 5 3.78 .05 1.151 -.860 .115 -.013 .229 Q6.1 1 5 3.17 .06 1.283 -.283 .115 -1.078 .229 Q6.2 1 5 3.23 .06 1.210 -.350 .115 -.864 .229 Q6.3 1 5 3.25 .06 1.279 -.288 .115 -.997 .229 Q6.4 1 5 3.20 .06 1.274 -.263 .115 -1.003 .229 Q6.5 1 5 3.50 .06 1.282 -.563 .115 -.737 .229 Q7.1 1 5 3.79 .05 1.156 -.951 .115 .066 .229 Q7.2 1 5 3.29 .06 1.279 -.354 .115 -.994 .229 Q7.3 1 5 3.50 .06 1.176 -.478 .115 -.586 .229 Q7.4 1 5 3.51 .06 1.208 -.575 .115 -.563 .229 Q7.5 1 5 3.68 .05 1.166 -.743 .115 -.260 .229 22
4.2.2 The loyalty of the employees
The observed variables in the scale of the employee loyalty, Y1 (I am willing to recommend my company to other people as a good workplace), Y2 (I am proud to recommend my company’s products/servicesto other people), Y3 (I will stay in the company for a long time despite the more attractive salaries of other companies) have the relatively high average value (mean = 3.72; 3.84; 3.17). It demonstrates that the employees really would like to stay in the company that they are working in the long term.
Table 4.7: Descriptive statistics of the variables of the employee loyalty
Descriptive Statistics
Mean Std. Skewness Kurtosis
Min Max Deviation
Statistic Std. Statistic Statistic Std. Statistic Std.
Error Error Error
Y1 1 5 3.72 .06 1.256 -.747 .115 -.435 .229 Y2 1 5 3.84 .05 1.141 -.861 .115 -.020 .229 Y3 1 5 3.17 .06 1.313 -.190 .115 -1.097 .229
4.3 SCALE EVALUATION
The reliability of the scale is evaluated by two tools: Cronbach’s Alpha coefficient and factor analysis. Cronbach’s alpha coefficient is used to eliminate the “junk” variables. The variables with the corrected item total correlation less than 0.3 will be eliminated and the scale will be finished when the Cronbach Alpha coefficient is greater than 0.6 (Nunnally & Bernstein, 1994).
The reliability is used to describe the measurement errors, because we cannot know exactly the variation of the correct and error variables and calculate the reliability of the scale directly. However, we can establish the reliability based on the Cronbach’s Alpha coefficient. This coefficient indicates the correlation between the variables in the questionnaire. Therefore, it is used to calculate the change of each variable and the correlation between variables (Bob E.Hays, 1983).
4.3.1 The scale of the independent variables
The component High income/salary meets the requirement for the next factor analysis with the Cronbach’s Alpha coefficient of 0.76 and the Corrected Item - Total Correlation greater than 0.3.
The component Favorable working conditions meets the requirement for the next factor analysis with the Cronbach’s Alpha coefficient of 0.84 and the Corrected Item - Total Correlation greater than 0.3.
The component Conformity to organization goalsmeets the requirement for the next factor analysis with the Cronbach’s Alpha coefficient of 0.79 and the Corrected Item - Total Correlation greater than 0.3.
The component Support of superiors meets the requirement for the next factor analysis with the Cronbach’s Alpha coefficient of 0.80 and the Corrected Item - Total Correlation greater than 0.3.
The component Support of colleagues meets the requirement for the next factor analysis with the Cronbach’s Alpha coefficient of 0.84 and the Corrected Item - Total Correlation greater than 0.3.
The component Fair reward system meets the requirement for the next factor analysis with the Cronbach’s Alpha coefficient of 0.92 and the Corrected Item - Total Correlation greater than 0.3.
The component Empowerment meets the requirement for the next factor analysis with the Cronbach’s Alpha coefficient of 0.87 and the Corrected Item - Total Correlation greater than 0.3.
4.3.2 The scale of the loyalty
The component Loyalty meets the requirement for the next factor analysis with the Cronbach’s Alpha coefficient of 0.84 and the Corrected Item - Total Correlation greater than 0.3.
4.4 FACTOR ANALYSIS 4.4.1 Factor analysis
The (Kaiser - Meyer - Olkin) KMO indicator is used to consider the suitability of the factor 24
analysis. If the value of KMO is high (between 0.5 and 1) then the factor analysis is appropriate; if it is less than 0.5, the analysis of factors is likely to be inappropriate with the data. (Trong & Ngoc, 2005).
The variables with the factor loading less than 0.5 will be eliminated, it stops when Eigenvalue (which represents the variation explained by each factor) is greater than 1 and the total variance explained is greater than 50% (Gerbing & Anderson, 1988).
The principal axis factoring and Promax rotation are used in the factor analysis of the scale of independent components. The use of principal axis factoring and Promax rotation more accurately reflects the data structure compared with the Principal component method and the Varimax rotation (Gerbing & Anderson, 1988).
After removing the variables in the reliability evaluation, the set of the scales above remains 26 variables. The process of factor analysisof this scale includes two steps. The analytical results of each step are clearly represented in the Appendix.
In Step 1, there are 26 variables to be analyzed with the standard Eigenvalue greater than 1, only 6 factors are extracted. In this Table (Annex B), the Cumulative = 68.255% illustrates that the first six factors can explain 68.255% of the variation of data. The KMO = 0.91 (> 0.5). However, the observed variable Q7.1 is eliminated due to the too low factor loading. In Step 2, after removing the observed variable Q7.1, the 25 remaining variables are analyzed along with the standard Eigenvalue greater than 1. However, there are only 6 factors extracted. In this Table (Annex B), the Cumulative increases to 69.38% and the KMO = 0909 (> 0.5). The factor loading of observed variables are at least 0.5.
4.4.2 Giving names and explaining factors
The explanation of the factors is implemented on the ground of identification of the observed variables that have the great factor loading in the same factor. Therefore, this factor can be explained by the variables with the large factor loading.
In factor matrix after rotation in this table (Annex B), the factor 3 includes sets of variables observed from the components “Support of superiors” and “Support of colleagues” that consist of the observed variables Q4.1, Q4.2, Q4.3, Q5.1 and Q5.2. This factor includes the behaviors of the leaders’ relationships with the staffs under their direct management. As a result, this factor can be named as the factor “Management decision”. The observed variables of the five remaining factors “High income/salary”, “Favorable working
condition”, “Conformity to organization goals”, “Fair reward system”, “Empowerment”
remain unchanged.
4.4.3 Interpretations of results
The results of factor analysis gives the measurement model of employee loyalty towards the organization that is the combination of the scales: High income/salary; Favorable
working condition; Conformity to organization goals; Management decision; Fair reward system and Empowerment.
The observed variables are of the components: High income/salary; Favorable working
condition; Conformity to organization goals; Fair reward system and Empowerment
have the high factor loading in a factor as originally expected. The observed variables closely correlates with the initial factor.
The group of factor Management decision includes the observed variables that are of the components: Support of superiors and Support of colleagues.
The results of factor analysis include these following components:
The component High income/salary
Description Variables
1 My current salary is compatible with my capacity Q1.1
2 I have a completely good life with my current salary Q1.2
3 I think that the company which I am working for pays salary fairly Q1.3
The componentFavorable working conditions
Description Variables
1 The equipment at the workplace supporting my work is very good Q2.1
2 The airy rooms in my workplace make me feel comfortable Q2.2
3
The temperature, lighting, noise in the company are very consistent with
my job Q2.3
4 I feel very safe in my workplace Q2.4
The componentConformity to organization goals
Description Variables
1
I feel that my personal ability is compatible with the job requirement of
the organization Q3.1
2 I commit to implement the goals set out by the organization Q3.2
3 I agree with the business method of the organization Q3.3
4 My goals are appropriate with the organization’s goals Q3.4
The componentManagement decision
Description Variables
1 I always have the direct support from my superiors in every aspects Q4.1
2 The superiors always support me immediately when a problem arises Q4.2
3 I often receive the support of my superiors when things go wrong Q4.3
4
My superiors always listen to the staffs’ opinions and pay attention to
their interest Q5.1
5 My superiors always are knowledgeable, friendly and approachable Q5.2
The componentFair reward system
Description Variables
1 I am fairly awarded once I accomplish my task Q6.1
2 I am fairly awarded for my responsibility to the job Q6.2
3 I am fairly awarded for my effort Q6.3
4 I am fairly awarded for working under high pressure Q6.4
5 I am fairly awarded for my good task completion Q6.5
The componentEmpowerment
Description Variables
1 My superiors empower me to make decisions Q7.2
2 My superiors believe in my decisions Q7.3
3
My superiors encourage me to use the empowered right to make
decisions Q7.4
4 My superiors believe in the assessment on my job performance Q7.5 27
4.5 ADJUSTED MODEL
Figure 4.1: The adjusted research model
In this model, the dependent variable is Loyalty. The independent variables are: High
income/salary, Favorable working condition, Conformity to organization goals, Management decision, Fair reward system, and Empowerment.
The hypotheses of this model are as follows:
- H 1: High income makes employees more loyal to the organization.
- H 2: Favorable working condition makes employees more loyal to the organization.
- H 3: Conformity to organization goals makes employees more loyal to the organization.
- H 4: Suitable management decision makes employees more loyal to the organization. High income Favorable working conditions Conformity to organization goals Management decision Fair reward Empowerment Loyalty 28
- H 5: Fair reward system makes employees more loyal to the organization. - H 6: Being empowered to make decisions makes employees more loyal to
the organization.
4.6 TESTING MODEL
After the factor analysis, six factors are added to the testing of model. The factor value is the mean of the observed variables in that factor. The Pearson correlation analysis is used to consider the appropriateness of the components to be added to the regression model. The results of the regression analysis are used to test hypotheses from H1 to H6.
4.6.1 The Pearson correlation coefficient test
The Pearson correlation coefficient test is used to check the linear relationship between the independent and dependent variables. If these variables are closely correlated, the multicollinearity must be paid attention to in the process of regression analysis.
According to the correlation matrix shown in table 4.8, the variables are correlative and significant at the 0.01 level. The correlation coefficients of the dependent variable of employee loyaltyand other independent variables are relatively high. We can preliminarily reach the conclusion that the independent variables can be put into the model to explain the variable of Employee loyalty (Y). However, the correlation coefficients between the independent variables range from 0.289 to 0566. Therefore, we should consider the role of the independent variables above in the multiple linear regression model.
Table 4.8: The correlation matrix between the variables
Correlations Y Q1 Q2 Q3 Q4 Q5 Q6 Y 1 .404(**) .458(**) .572(**) .579(**) .530(**) .472(**) Q1 .404(**) 1 .369(**) .362(**) .336(**) .537(**) .289(**) Q2 .458(**) .369(**) 1 .486(**) .425(**) .395(**) .321(**) Q3 .572(**) .362(**) .486(**) 1 .566(**) .510(**) .465(**) Q4 .579(**) .336(**) .425(**) .566(**) 1 .561(**) .509(**) Q5 .530(**) .537(**) .395(**) .510(**) .561(**) 1 .516(**) 29
Q6 .472(**) .289(**) .321(**) .465(**) .509(**) .516(**) 1
** Correlation is significant at the 0.01 level (2-tailed).
4.6.2 Regression Analysis
The regression analysis is implemented with 6 independent variables, shown in table 4.9, and includes: High income/salary (Q1), Favorable working condition (Q2),
Conformity to organization goals(Q3), Management decision (Q4), Fair reward system (Q5), Empowerment (Q6) and the dependent variable EmployeeLoyalty (Y). The
results of the descriptive statistics of the variables that are put into the regression analysis:
Table 4.9: The descriptive statistics of the factors of model
Descriptive Statistics
Std.
Min Max Mean Deviation Skewness Kurtosis
Statistic Statistic Statistic Statistic Statistic Std. Error Statistic Std. Error Q1 1.00 5.00 2.98 1.09 -.016 .115 -.897 .229 Q2 1.00 5.00 3.49 1.02 -.485 .115 -.539 .229 Q3 1.00 5.00 3.73 .89 -.844 .115 .328 .229 Q4 1.00 5.00 3.59 .90 -.789 .115 .383 .229 Q5 1.00 5.00 3.27 1.12 -.415 .115 -.686 .229 Q6 1.00 5.00 3.50 1.05 -.572 .115 -.274 .229 Y 1.00 5.00 3.58 1.08 -.581 .115 -.448 .229
The mean values of the independent variables are calculated based on the observed variables of components of such independent variables. The value of the dependent variable is the average value of the observed variables of employee loyalty. The analysis is conducted by Enter method. The variables are put at the same time to see which variable is accepted. The results of this regression analysis are shown in table 4.10.
This results shows that the regression model is relatively consistent with the significance level of 0.05. The adjusted R2= 0.475 means that about 47.5% of the variance of the loyalty is explained by 6 independent variables: High income/salary (Q1), Favorable working condition (Q2), Conformity to organization goals(Q3),
Management decision (Q4), Fair reward system (Q5), Empowerment (Q6).
Table 4.10: The assessment on the appropriateness of the model
Model Summary
Adjusted R Std. Error of the Model R R Square Square Estimate 1 .694(a) .482 .475 .78171
a Predictors: (Constant), Q6, Q1, Q2, Q4, Q3, Q5
The F-test used in the table of variance analysis is the test of hypothesis about the degree of appropriateness of the population linear regression model and is illustrated in table 4.11. The idea of this test is about the linear relationship between the dependent variable and the independent variables. In the ANOVA analysis, we can see that the sig. valueis very small (sig = 0.00); therefore, the regression model can be consistent with the data set and available for use.
Table 4.11: ANOVA Testing the appropriateness of the model
Sum of Mean
Model Squares df Square F Sig. 1 Regression 252.982 6 42.164 69.000 .000(a)
Residual 271.923 445 .611 Total 524.905 451
a Predictors: (Constant), Q6, Q1, Q2, Q4, Q3, Q5 b Dependent Variable: Y
The ANOVA analysis shows the value F = 69 (sig = 0.00). The multicollinearity does not affect the explanation results of the model with the largeest VIF of each variable equals to 2.049 (<10). The rule is that if VIF exceeds 10, it is a sign of multicollinearity (Trong & Ngoc, 2005).
The regression equation demonstrating the relationship between the Employee loyalty in the organization (Y) and the independent variables includes: High income/salary (Q1), Favorable working condition (Q2), Conformity to organization goals(Q3), Management decision (Q4), Fair reward system (Q5), Empowerment (Q6). It is represented by the following expression and the analytical results are shown in table 4.12:
Loyalty= -0.13 + 0.097 * High income/salary+ 0.134 *Favorable working condition+
0.272 * Conformity to organization goals+ 0.285 * Management decision+ 0.115 * Fair reward+ 0.119 * Empowerment.
Table 4.12:The regression results using the Enter method
Unstandardized Standardized
t Sig.
Coefficients Coefficients Collinearity Statistics B Std. Error Beta Tolerance VIF (Constant) -.013 .185 -.069 .945 Q1 .097 .041 .098 2.373 .018 .679 1.472 Q2 .134 .043 .127 3.098 .002 .696 1.437 Q3 .272 .055 .226 4.936 .000 .557 1.796 Q4 .285 .056 .239 5.131 .000 .537 1.861 Q5 .115 .047 .118 2.419 .016 .488 2.049 Q6 .119 .044 .115 2.703 .007 .643 1.555 a Dependent Variable: Y Annotation of results:
To identify which independent variable plays a more important role to the dependent variable, we use the Partial correlations. The regression results demonstrate that the component Management decision has the greatest influence on employee loyalty (Partial = 0.236), followed by the component Conformity to organization goals(Partial = 0.228), the component Favorable working condition (Partial = 0.145), the component
Empowerment (Partial = 0.127), the component Fair reward system (Partial = 0.114)
and finally the component High income (Partial = 0.112).
Table 4.13: Determination of the importance of the independent variables
Unstandardized Standardized t
Sig.
Coefficients Coefficients Correlations Model
Zero-
B Std. Error Beta order Partial Part 1 (Constant) -.013 .185 -.069 .945 Q1 .097 .041 .098 2.373 .018 .404 .112 .081 Q2 .134 .043 .127 3.098 .002 .458 .145 .106 Q3 .272 .055 .226 4.936 .000 .572 .228 .168 Q4 .285 .056 .239 5.131 .000 .579 .236 .175 Q5 .115 .047 .118 2.419 .016 .530 .114 .083 Q6 .119 .044 .115 2.703 .007 .472 .127 .092 a Dependent Variable: Y 32
4.7 RESULTS OF HYPOTHESIS TESTING The hypotheses of the model:
H 1: High income makes employees more loyal to the organization. The component High
income has beta = 0.098, t-value = 2.373, sig = 0.018; so, this hypothesis is accepted.
H 2: Favorable working condition makes employees more loyal to the
organization. The component Favorable working condition has beta = 0.127, t-value = 3.098, sig = 0.002; thus, this hypothesis is accepted.
H 3: Conformity to organization goalsmakes employees more loyal to the
organization. The component Conformity to organization goalshas beta = 0.226, t-value = 4.936, sig = 0.00; Thus, this hypothesis is accepted.
H 4: Management decision makes employees more loyal to the organization. The
component Management decision has beta = 0.239, t-value = 5.131, sig = 0.00; therefore, this hypothesis is accepted.
H 5: Fair reward system makes employees more loyal to the organization. The
component Fair reward system has beta =0.118, t-value = 2.419, sig = 0.00; thus, this hypothesis is accepted.
H 6: Being empowered in making decisions makes employees more loyal to the
organization. The component Empowerment has beta =0.115, t-value = 2.730, sig = 0.00; thus, this hypothesis is accepted.
Employees are also the internal customers of the organization; thus, this result can be explained by the Kano model as follows:
The component High income is of the one-way group – the higher, the better. If the employees receive the salaries compatible with their capacity and they think that they are fair salaries, they will feel more satisfied. In addition, if their salaries are enough to make their living, they will be comfortable to focus on their job; as a result, they will become more closely with the organization which they are working for.
The favorable working condition is one of the factors that reflect the working environment. Once the employees work in the working environment which is comfortable, fresh, quiet, safe and fully equipped, then they will be comfortable and their
confidence increases as well. If they feel their workplace like their home, they will work more enthusiastically and love their workplace more. Consequently, they will not want to leave their workplace for another.
The closer employees’ objectives to the organization’s, the more loyal they are to the organization. However, the objectives of two sides are expected to increase over time, maybe with the different growth rate. Therefore, the employees will be loyal to the organization when both sides have the same goals.
Management decision is the factor which presents managers’ working style towards their employees. The working environment where the managers are always ready to support their staffs will bring them the comfort. Apart from that, if the relationship between the managers and the staffs is open and comfortable and the managers are always the mental support for their employees in every aspect, the employees will be more confident in the managers, organization and also more loyal to their current organization.
Fair reward system is still the basic element that affects the loyalty of the employees. If they think that they receive the appropriate remuneration, they will maintain the high level of their capacity, attempt more to work and stick to the organization for the long term.
Empowerment - the factor represents the autonomy of the staffs in their job. When a staff has the certain powers to deal with the tasks, he/she will be more active. This not only promotes staffs’ creativeness but also represents managers’ confidence to the staffs. Consequently, the employees will be more confident in the working methods of the managers, interested in the current job and also more loyal to the current organization.
4.8 TESTING THE LOYALTY OF MEN AND WOMEN
Independent-samples t-test demonstrates the difference in loyalty of men and women. According to the result of Levene's test, sig.> 0.05 (sig = 0.611), the variation between men and women is not significant. Therefore, in the t-test result, we use the result Equal variancess assumed with sig.> 0.05 (sig = 0.592) in table 4.14. We can see that there is no great difference in the average value of men and women. Thus, we reach the conclusion that the loyalty of men and women is the same.
Table 4.14: Testing the loyalty of men and women
Independent Samples Test
Levene's Test for Equality of
Variances t-test for Equality of Means
95% Confidence Sig. (2- Mean Std. Error Interval of the F Sig. t df tailed) Difference Difference Difference
Lower Upper Y Equal variances .258 .611 .536 450 .592 .0562 .10484 -.14988 .26218 assumed Equal variances .535 354.71 .593 .0562 .10499 -.15032 .26263 not assumed
4.9 TESTING THE LOYALTY OF THE EMPLOYEES WITH DIFFERENT QUALIFICATIONS
The ANOVA analysis of variance is to consider the difference in the loyalty of employees by qualifications. According to the result table Test of Homogeneity of Variances and the significance level of sig = 0.166, we can see that the variance of assessment on the loyalty by qualifications is not statistically different. Therefore, the result of ANOVA analysis can be used.
According to the result of ANOVA analysis in table 4.15 and the significance level of sig. <0.05 (sig = 0.00), we can conclude that there is the statistical difference in the loyalty of employees with different qualifications. ANOVA analysis is analyzed more deeply to discover the difference between the groups.
According to the deeper ANOVA analysis, there only have the difference between those who have undergraduate degree (sig = 0.001) and the difference between those who have undergraduate and master’s degree (sig = 0.043) because observed significance level in test of the paired average difference <0.05. Therefore, we can conclude that the loyalty of those who have university degree differs from that of those who have college degree and the loyalty of those who have undergraduate degree differs from that of those who have master’s degree .
Table 4.15: Testing the loyalty by education level
Test of Homogeneity of Variances
Y
Levene Statistic df1 df2 Sig. 1.629 4 447 .166
ANOVA
Y
Sum of Squares df Mean Square F Sig. Between Groups 24.167 4 6.042 5.393 .000 Within Groups 500.738 447 1.120
Total 524.905 451