1
(Revised MS:
es-2007-03245d)
1
Determining optimal operation parameters for reducing PCDD/F emissions (I-TEQ
2values) from the iron ore sintering process by using the Taguchi experimental
3design
4Yu-Cheng Chen1, Perng-Jy Tsai1,2, Jin-Luh Mou3 5
6
1
Department of Environmental and Occupational Health, Medical College, National Cheng Kung 7
University, 138, Sheng-Li Road, Tainan 70428, Taiwan; 8
2
Sustainable Environment Research Center, National Cheng Kung University, 1 University Road, 9
Tainan 70101, Taiwan; 10
3
Department of Occupational Safety and Health, Chung Hwa University of Medical Technology, 89, 11
Wenhwa 1st St., Rende Shiang, Tainan 71703, Taiwan 12
13
14
*Correspondence author: Perng-Jy Tsai, Department of Environmental and Occupational Health,
15
Medical College, National Cheng Kung University. 138, Sheng-Li Rd., Tainan 70428, Taiwan. Tel.: 16
+886-6-2353535 ext. 5806; Fax: +886-6-2752484; E-mail address: [email protected] 17
2
Abstract
18
This study is the first one using the Taguchi experimental design to identify the optimal operating 19
condition for reducing polychlorinated dibenzo-p-dioxins and dibenzofurans (PCDD/Fs) formations 20
during the iron ore sintering process. Four operating parameters, including the water content (Wc; range 21
= 6.07.0 wt %), suction pressure (Ps; range = 10001400 mmH2O), bed height (Hb; range = 500600
22
mm) and type of hearth layer (including sinter, hematite, and limonite), were selected for conducting 23
experiments in a pilot scale sinter pot to simulate various sintering operating conditions of a real scale 24
sinter plant. We found that the resultant optimal combination (Wc=6.5 wt%, Hb=500 mm, Ps=1000 25
mmH2O, and hearth layer= hematite) could decrease the emission factor of total PCDD/Fs (total
26
EFPCDD/Fs) up to 62.8% by reference to the current operating condition of the real-scale sinter plant
27
(Wc=6.5 wt %, Hb = 550 mm, Ps = 1200 mmH2O, and hearth layer = sinter). Through the ANOVA
28
analysis, we found that Wc was the most significant parameter in determining total EFPCDD/Fs
29
(accounting for 74.7% of the total contribution of the four selected parameters). The resultant optimal 30
combination could also enhance slightly in both sinter productivity and sinter strength (30.3 t/m2/day 31
and 72.4%, respectively) by reference to those obtained from the reference operating condition (29.9 32
t/m2/day and 72.2%, respectively). The above results further ensure the applicability of the obtained 33
optimal combination for the real-scale sinter production without interfering its sinter productivity and 34
sinter strength. 35
Keywords: PCDD/F formation, iron ore sintering, Taguchi experimental design, optimization,
36
operation parameter 37
3
Running Title: Optimizing operating parameters for reducing PCDD/F emissions by using the Taguchi
38
experimental design 39
Outline of Section Headers
40
Introduction 41
Material and Methods 42
Results and Discussion 43
Literature cited 44
4
Introduction
45
Iron ore sintering is an agglomeration process to convert iron ore fines (raw mixture) into lumpy 46
agglomerates. In the preliminary stage of sinter making process, water was sprayed onto the raw 47
mixtures in the mixing drum to increase the granular sizes for enhancing the permeability of the sinter 48
bed. During sintering, the raw mixtures were first ignited by gas-fueled (nature gas) burns situated at 49
the beginning of the steel belt conveyer. Then, the sinter bed was heated to temperature ~1000 ºC or 50
above. Suction air passes through the sinter layer by means of wind legs and a fan, which moves the 51
melting/combustion zone to the down layer to produce sintered products. 52
Mechanisms associated with the formations of dibenzo-p-dioxins and dibenzofurans (PCDD/Fs) in 53
the sintering process are very complicated. Possible formation mechanisms might be related to 54
precursor reactions (1-2) and combustion conditions of sinter raw mixtures (3-5). Particiularly, 55
PCDD/Fs could also be formed through de novo synthesis reaction in the dry zone of the sinter bed 56
under various combustion conditions (2, 6). Many studies have indicated that the four operating 57
parameters, including the water content (Wc) (7), suction pressure (Ps) (8), bed height (Hb) (9) and 58
type of the hearth layer (10), are major factors affecting combustion conditions during the iron ore 59
sintering process. Among these four parameters, the content of Wc in the sinter zone might affect the 60
adsorption of PCDD/Fs on the surface of particles and the solubility of PCDD/Fs in water (7); the 61
magnitude of Ps affects the air (or oxygen) supply which might play an important role in the oxygen-62
chlorine interactions related to PCDD/Fs formation (8); Hb affect the thickness and temperature profile 63
of the combustion zone of the sinter bed and in consequence affects the contents of unburned 64
hydrocarbon compounds during the sintering process (9); and the type of the hearth layer might affect 65
the catalytic oxidation reaction associated with PCDD/F formations (10). All these operating parameters 66
have been used to control the structure of the sinter bed to simulate various operation conditions for the 67
sintering process in many studies (11-14). 68
Since the discovery of PCDD/Fs from the fly ash of a municipal solid waste incinerator (MSWI) 69
(15), PCDD/F emissions from various emission sources, such as MSWI, power generation, 70
5 metallurgical process and chemical-industrial sources has became a significant environmental issue (16). 71
Among them, PCDD/F emissions from iron ore sinter plants have been recognized as the most 72
important source in many countries (17-19). To date, most sinter plants have installed various air 73
pollution control devices (APCDs) for the control of PCDD/F emissions. Nevertheless, most sinter 74
plants have faced the dilemma regarding how to continuously upgrade their APCDs in order to comply 75
with stricter and stricter emission standards adopted in their countries. In order to comply with future 76
PCDD/F emission standard and decrease the cost resulting from upgrading the end-pipe PCDD/F 77
control devices, it is important to develop an effective method for directly reducing PCDD/F 78
generations during the sintering process. It is known that the change of the contents of sinter raw 79
mixture for reducing PCDD/F emissions would be impractical in the real situation. Therefore, to 80
optimize operating conditions in order to reduce PCDD/F formations via de novo synthesis reaction in 81
the dry zone of the sinter bed might provide a promising solution. 82
In principle, experimental design methods can be used to determine the optimal operating condition 83
for a given purpose. For many years, experimental design methods originally developed by Fisher have 84
been widely used in many industries (20). However, the use of the above methods might be subjected to 85
their complexities and their requirement for a large number of experiments to be carried out as the 86
number of the designed parameters increased. To solve the above problems, the Taguchi experimental 87
design is considered as a less complicated method requiring only much smaller number of experiments 88
to be conducted for identifying an optimal operation condition. The Taguchi experiment design is a 89
powerful tool that provides a simple, efficient and systematic approach to optimize operating conditions 90
under designated ranges of all selected parameters. The method is valuable when the designed 91
parameters are qualitative and discrete. The method can used to optimize the performance 92
characteristics through the settings of designed parameters and reduce the sensitivity of the system 93
performance to sources of variation. In recent years, the Taguchi experiment design has been used in 94
many industries to optimize the operating conditions for the waste water treatment and air pollution 95
control (21-24). Therefore, in the current study the Taguchi experimental design is used to determine 96
6 the optimal operating combination for reducing PCDD/F formations during the sintering process. In 97
addition, two important indexes (i.e., the sinter productivity and sinter strength) widely used for 98
characterizing the quality of the sintering products were also examined to further ensure the optimal 99
combination obtained from the Taguchi experiment design can be used in the real scale sinter plant. 100
101
Material and Methods
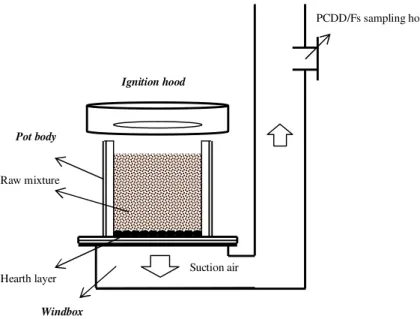
102The Pilot Scale Sinter Pot and Its Operating Procedures. A pilot scale sinter pot was used in this
103
study to simulate the real-scale sintering process (Fig. 1). This sinter pot included a pot body (inner 104
diameter = 330 mm, height = 600 mm), an ignition hood, and a windbox connected to an exhaust duct. 105
Six kilogram of hearth layer (particle diameters = 10−15 mm, thickness = 40 mm) were placed inside 106
the sinter pot. During sintering, the designated ignition temperature in ignition hood was specified at 107
1150−1200 ºC for 1.5 minutes and then hold in another 1.5 minutes for keeping heat. During this period 108
(i.e., starting from the ignition to the removal of the ignition hood) the suction pressure inside the sinter 109
pot was controlled at 800 mmH2O by using an electromagnetic valve. After this, the suction pressure
110
was raised to 1200 mmH2O and then kept constant throughout the end of the sintering process. The total
111
sintering time was around 35 minutes depending on the experimental conditions. 112
The sintering raw mixture used in this study was directly obtained from the real-scale sinter plant. It 113
consisted of the iron ore (52.8 wt %), coke breeze (4.0 wt %), anthracite (1.84 wt %), serpentine (0.42 114
wt %), marble (1.98 wt %), slurry (0.56 wt %), and return fine (31.5 wt %; including return fine 115
obtained from sinter plant and blast furnace), and mini-pellet (1.50 wt %) with mean granular sizes 116
ranging from 1.0 to 6.3 mm. The sintering raw mixture was found with 5.81% FeO, 9.38% CaO, 1.44% 117
MgO, 1.66% Al2O3, 4.79% SiO2, and total-Fe accounting for 57.5% total weight..
118
Taguchi Experimental Design. The working steps for the Taguchi experimental design include: (1)
119
selection of operation parameters; (2) determination of the number of levels for each selected parameter; 120
(3) selection of the appropriate orthogonal array and arrangement of operation parameters to the 121
orthogonal array; (4) conducting experiments based on the arrangement of the orthogonal array; (5) 122
7 analysis of the experimental results using the S/N ratio and ANOVA analyses; (6) selection of the 123
optimal combination of levels for the selected operation parameter; and (7) verification of the above 124
optimal combination by conducting a confirmation experiment (25,26). 125
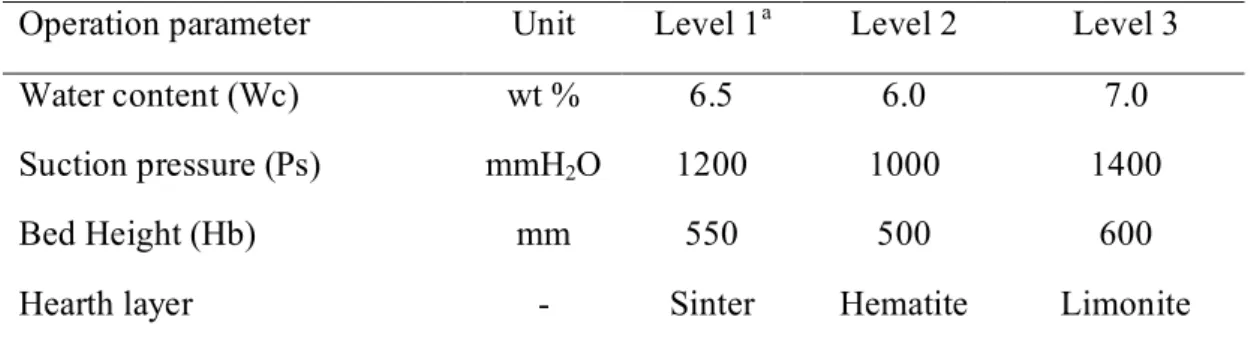
Selected Operation Parameters, levels and Orthogonal Array. Four operation parameters (and
126
their testing ranges), including water content (Wc; 6.07.0 wt %), suction pressure (Ps; 1000−1400 mm 127
H2O), bed height (Hb; 500600 mm), and types of hearth layer (including sinter (containing 70% Fe2O3
128
and 7% Fe3O4; Fe in total accounting for 58.1% of total weight), hematite (containing 88% Fe2O3 and
129
7% FeO·OH; Fe in total accounting for 64.1% of total weight), and limonite (containing 40% Fe2O3,
130
45% FeO·OH and 6% H2O; Fe in total accounting for 63.3% of total weight)) were selected in this
131
study. The selected ranges of the above four parameters were determined based on the past operation 132
experience of the selected sinter plant and the published references (11, 27-28). A specific combination 133
of the four selected operation parameters (i.e., Wc = 6.5 wt %, Ps = 1200 mmH2O, Hb = 550 mm, and
134
type of hearth layer = sinter) being currently used in the real-scale sinter plant was served as the 135
reference combination. Table 1 shows the selected three levels for each operation parameter based on its 136
designated range. An L9(34) orthogonal array (with four columns and nine rows) was used in this study 137
according to the Taguchi experimental design (Table 2) (25). Since the experimental design was 138
orthogonal, it was possible to discriminate the effect of each individual parameter at each designated 139
level. As shown in Table 2, nine combinations of the four selected operation parameters were chosen 140
for conducting experiments. Subjected to the cost associated with PCDD/Fs samplings and sample 141
analyses, each experiment were repeated twice (n=2) in this study. 142
PCDD/Fs sampling. For each experiment, the flue gas samples were collected from the duct located
143
at the downstream of the windbox of the pilot sinter pot (see Fig 1) by using a Graseby Anderson stack 144
isokinetic sampling system (compliance with US EPA Method 23). The sampling location was in 145
accordance with the stack sampling criteria (i.e., in 8 times distance of duct diameter (8D) away from 146
downstream of the curvature) and in 2 times distance of duct diameter (2D) away from upstream of the 147
curvature) for preventing uncertainty caused by flow turbulence. Because the instability of the airstream 148
8 occurred during the first five minutes of the sintering process (i.e., the time needed for adjusting the 149
suction pressure to reach the designated level), the flue gas of the first five minute was not collected. As 150
a result, the sampling time for each flue gas sample was ~30 minutes. 151
PCDD/Fs analysis. Analysis of PCDD/Fs for all collected samples followed the US EPA modified
152
Method 23 by an accredited lab in the Super Micro Mass Research and Technology Center of the 153
Cheng-Shiu University. Each collected sample was first spiked with a known amount of the internal 154
standard. Seventeen PCDD/F congeners in gas- and particle- phase were analyzed, respectively. For 155
each collected sample, it was first extracted for 24 h, then the extract was concentrated, treated with 156
concentrated sulfuric acid, and then followed by a series of sample cleanup and fractionation procedures. 157
The eluate was concentrated to 1 mL, then transferred to a vial, and then further concentrated to nearly 158
dryness by using a nitrogen stream. PCDD/Fs were analyzed by a high-resolution gas chromatography 159
(HP 6970) / high-resolution mass spectrometry (HRGC/HRMS) with a DB-5 capillary column (60 m × 160
0.25 mm i.d., 0.25 μm film thickness; J&W Scientific, CA, USA). Injections were made in splitless 161
mode with a column oven temperature program of 150 ºC, 30 ºC/min to 220 ºC (5 min), 1.5 ºC/min to 162
240 ºC (5 min), than 15 ºC /min to 310 ºC (20 min). Injector and detector temperature were 250 ºC and 163
310 ºC, respectively. Helium was used as carrier gas (1.2 mL/min). The HRMS (Micromass Autospec 164
Ultimate) was equipped with a positive electron impact (EI+) source as 35ev electron energy and 165
ionization temperature at 250 ºC. The analyzer mode of the selected ion monitoring (SIM) was used 166
with resolving power at 10,000. 167
Analysis of the serial dilution of PCDD/F standards showed that the method detection limits (MDL) 168
of HRGC/HRMS was 0.127-2.27 pg. PCDD/F recovery efficiencies were determined by processing a 169
solution containing with known PCDD/F concentrations through the same experimental procedure used 170
for the samples. The recovery efficiency of PCDD/Fs varied between 74.3 % and 96.1 % and averaged 171
84.8% in this study. The mean relative standard deviation (RSD) (%) of recovery efficiencies was 172
18.6% (range 15.122.8%). The blank tests for PCDD/Fs were accomplished by the same procedure as 173
9 the recovery-efficiency tests without adding the known standard solution before extraction. Analysis of 174
blanks showed no significant contamination. 175
Concentrations of PCDDs, PCDFs, gas- and particle-phase PCDD/Fs, and total PCDD/Fs of flue gas 176
samples obtained from the nine selected experimental combinations were calculated. Because the 177
purpose of the present study was aimed at reducing the environmental impact arising from PCDD/F 178
emissions, therefore the I-TEQ concentration (i.e., ng I-TEQ/Nm3) was used to characterize the above 179
concentrations. Considering the variations in flow rate, sintering time, and charging weight of feedstock 180
among different experimental combinations, the emission factor of PCDD/Fs (EFPCDD/Fs; ng
I-TEQ/kg-181
feedstock) were calculated for comparisons. 182
Evaluation of sinter productivity and sinter strength. The sinter productivity, expressed in tons
183
per square meter of grate area of sintering machine per day, was calculated from the sintering time, the 184
cross-sectional area of the pot grate, and the weight of sinter product recovered from the test (by 185
removing the loss of the weight of hearth layer). The sinter strength was measured by using a modified 186
ISO 3271 test method (29). 187
Data analysis. The S/N ratio based on the concept of the-lower-the-better was used to characterize
188
EFPCDD/Fs. The S/N ratio (η) was defined as (25):
189 (M.S.D.) log -10 (1) 190
Where, mean-square deviation (M.S.D.) was the calculated variance for the characteristic value y. 191
The S/N ratio in decibel (dB) units was used due to the value of ten times the common log of equation 192
(Eqs. 1) for comparison. The M.S.D. characterized the-lower-the-better was obtained as: 193
n i i y n 1 2 1 M.S.D. (2) 194Where, n was number of test, and yi was the value of EFPCDD/Fs obtained from the ith test. The
195
predicted S/N ratio (or EFPCDD/Fs) (β) for the optimal combination could be calculated as:
196
o i m i m 1 (3) 19710 Where, m was the total mean S/N ratio, i was the maximum S/N ratio (or the minimum EFPCDD/Fs)
198
obtained from the ith parameters in their three designated levels, and o was the number of our selected 199
parameters. 200
In addition, the analysis of variance (ANOVA) was used to investigate the effect of each individual 201
parameter on EFPCDD/Fs.
202 203
Results and Discussion
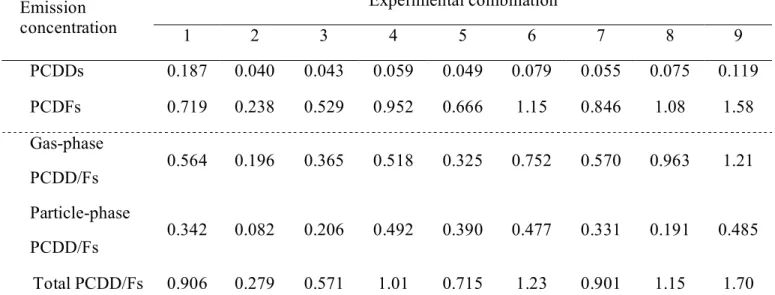
204Concentrations and characteristics of PCDD/Fs emitted from the sinter process. Table 3 shows
205
concentrations of PCDDs, PCDFs, gas- and particle-phase PCDD/Fs, and total PCDD/Fs of flue gas 206
samples obtained from the nine selected experimental combinations. The mean total PCDD/F 207
concentration was 0.940 ng I-TEQ/Nm3 (range = 0.2791.70 ng I-TEQ/Nm3), which was mostly 208
contributed by gas-phase PCDD/Fs (in average accounting for 63% of total PCDD/Fs). These levels 209
were similar to those reported by Wang et al. (30), and Anderson and Fisher (18). PCDFs had a higher 210
fraction (53.5−83.8 %) in total PCDD/Fs in all experimental combinations than that of PCDDs 211
(16.2−46.5 %). Considering intrinsic differences in flow rate, sintering time and charging weight among 212
the nine selected experimental combinations, Table 3 also shows the total PCDD/F emission factor 213
(total EFPCDD/Fs) for each combination. We found that the mean total EFPCDD/Fs for the nine selected
214
experimental combinations was 5.16 ng I-TEQ/kg-feedstock (range = 1.019.37 ng I-TEQ/kg-215
feedstock). However, it should be noted that the trend in magnitude of total EFPCDD/Fs was somewhat
216
different from that of total PCDD/F concentrations for the nine selected experimental combinations. 217
The above result clearly indicates the importance of using total EFPCDD/Fs to determine the optimal
218
combination for reducing PCDD/F emissions from the sintering process. 219
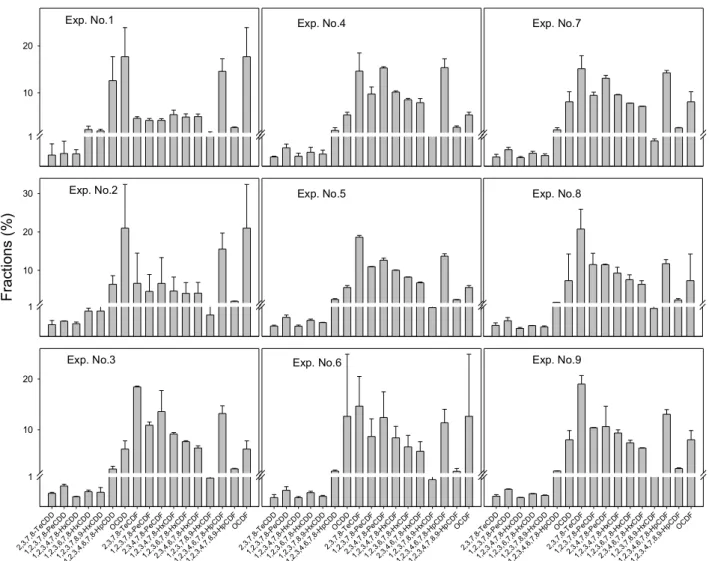
Figure 2 showed the congener profiles of the 2,3,7,8-substituted PCDD/Fs (mean and range) of the 220
nine selected experimental combinations. The most abundant congeners collected from the sinter pot, 221
11 presented in sequence, were 2,3,7,8-TeCDF, 2,3,4,7,8-PeCDF, 1,2,3,4,6,7,8-HxCDF, 1,2,3,7,8-PeCDF, 222
and OCDD. The above results were similar to those presented in other studies (18, 30). 223
S/N ratios and ANOVA analysis. In this study, the total EFPCDD/Fs obtained from the nine selected
224
experimental combinations were used to calculate S/N ratio. The S/N ratios of the four selected 225
parameters in three designated levels according to the orthogonal array experimental arrangement were 226
presented in Table 4. We found that the resultant S/N ratios fell to the range from -0.69 to -19.6 dB. 227
Table 5 shows mean S/N ratios of the four selected parameters in each of their three designated levels. 228
For each selected parameter, the difference between maximum S/N ratio and its corresponding 229
minimum S/N ratio (i.e., max-min) represents the effect of the given parameter on determining total 230
EFPCDD/Fs. Based on this, we found that the effects in sequence for the four selected parameters on total
231
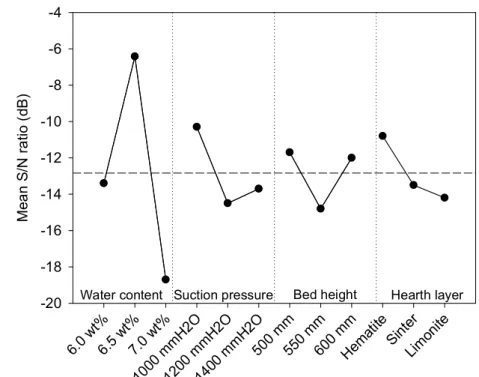
EFPCDD/Fs were: Wc (12.3 dB), Ps (4.15 dB), hearth layer (3.45 dB) and Hb (3.15 dB). Figure 3 shows
232
the trend of the resultant S/N ratios for each selected parameters at the three designated levels affecting 233
total EFPCDD/Fs. Both Ps and Hb shared the same trend in their resultant S/N ratios (i.e., first decreased
234
then increased). The above trend was different from that of Wc (i.e., first increased then decreased) and 235
hearth layer. The combination of Wc (=6.50 wt %), Ps (=1000 mmHg), Hb (=500 mm), and hearth 236
layer (=hematite) were found with the highest S/N ratio for each of the four selected parameters, and 237
hence was considered as the optimal operation condition for reducing PCDD/F emissions. 238
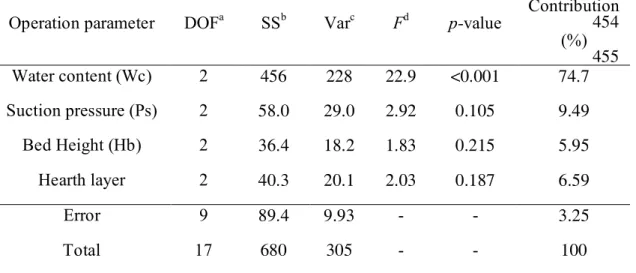
In this study, the ANOVA analysis was used to prioritize to effects of the four selected parameters on 239
determining total EFPCDD/Fs. Result shows that Wc (p<0.01) was the most significant parameter
240
accounting for 74.7% of the total contribution of the four selected parameters (Table 6). The above 241
result was consistent with that found inSuzuki et al. (4) and Li et al. (31). Here, it should be noted that 242
the optimal Wc was found at the middle level (i.e., 6.5 wt %) might be worth further discussion. Kasai 243
et al. (32) and Haga et al. (33) have indicated that the increase of Wc in sinter raw mixtures could 244
increase the permeability of sintering bed and combustion efficiency (due to the abundant coke breezes 245
and limestone fines coating on the surface of particles), and hence results in reducing PCDD/F 246
formation during sintering processes. On the other hand, two other studies have indicated that the 247
12 increase of Wc might lead to the increase of PCDD/F emissions because the adsorption of PCDD/Fs on 248
the surface area of sinter raw mixtures was partly replaced by the water molecules (4, 31). Based on 249
these, it is not so surprising to see that the lowest total EFPCDD/Fs was found at the middle level (i.e., 6.5
250
wt %) rather than at 6.0 wt % or 7.0 wt %. The optimal Ps and Hb were found at their corresponding 251
lowest levels (1000 mmH2O and 500 mm, respectively). The above results might because the lower Ps
252
and Hb might result in a wider combustion/melting zone in the sinter bed, leading to a more complete 253
coke combustion and less PCDD/F formation during the sintering process. For the type of hearth layer, 254
we found that the use of hematite could slightly decrease total EFPCDD/Fs in comparison with the use of
255
sinter as the hearth layer of the sinter pot, although the above effect was not significance (p=0.187). 256
Studies have reported that Fe2O3 did play an important role in catalytic oxidation of carbon monoxide
257
and polyethylene (34-35). The higher Fe2O3 content might result in the less PCDD/F formation. The
258
above inference is consistence with what we found in the three selected types of hearth layer in their 259
Fe2O3 contents (i.e., hematite (88%) > sinter (70%) > limonite (40%)). The insignificant effect
260
associated with the types of hearth layer used in this study deserves further discussion. It might mainly 261
because the depth of the hearth layer was too thin to have sufficient reaction time for the formation of 262
PCDD/Fs during sintering process. However, it should be noted that other physical parameters of hearth 263
layer, such as the particle size and porosity, could also be important factors affecting PCDD/F 264
formations. Considering the combined effect of all these physical factors on PCDD/F formations were 265
too complicated, which warrants the needs for further research in the future. 266
Comparison PCDD/F emissions between the reference and the optimal operation combination.
267
Table 7 shows total EFPCDD/Fs and S/N ratios obtained from the reference combination (i.e, Wc=6.5 wt
268
%, Ps=1200 mmH2O, Hb=550 mm, and hearth layer = sinter) and the resultant optimal combination
269
(i.e., Wc=6.50 w%, Ps=1000 mmHg, Hb=500 mm, and hearth layer=hematite). The total EFPCDD/Fs and
270
its corresponding S/N ratio for the reference combination were found as 3.09 ng I-TEQ/kg-feedstock 271
and -10.8 dB, respectively. For the optimal combination, its total EFPCDD/Fs and S/N ratio (predicted
272
based on Eqs. 3) were found as 1.01 ng I-TEQ/kg-feedstock and -0.694 dB, respectively. The difference 273
13 in the above two S/N ratios (= 10.1 dB) indicating that the use of the optimal combination would result 274
in a decrease in total EFPCDD/Fs up to 67.3% in comparison with the reference combination. For
275
confirmation purpose, experiments were conducted based on the specification of the resultant optimal 276
combination. The resultant total EFPCDD/Fs and its corresponding S/N ratio were found as 1.15 ng I-TEQ/
277
kg-feedstock and -1.21 dB, respectively. The increase in S/N ratio from the reference combination to 278
the optimal combination (confirmation experiment) was 9.59 dB, and the resultant decrease in total 279
EFPCDD/Fs was up to 62.8%. The above results further confirm the applicability of the obtained optimal
280
combination for reducing PCDD/F formations during the sintering process. 281
Sinter productivity and sinter strength of the reference and optimal operation combination.
282
Although the resultant optimal combination was able to reduce PCDD/F emissions, it is important to 283
examine its impact on the sinter productivity and sinter strength for practical reason. In this study, we 284
found that the sinter productivity and sinter strength for the reference combination were 29.9 t/m2/day 285
and 72.2%, respectively. The above values were slightly lower than that of the optimal combination 286
(30.3 t/m2/day and 72.4%, respectively). Therefore, it is concluded that the use of the optimal 287
combination for the sintering process could effectively reduce PCDD/F emissions without interfering 288
with both the quality and quantity of its sinter products. 289
Acknowledgements
290
We would like to thank the China Steel Corporation (CSC) in Taiwan for funding and providing 291
testing materials and facilities for this research project. 292
14
Literature Cited
293
(1). Milligan, M. S.; Altwicker, E. R. Chlorophenol Reactions on Fly Ash. 1. Adsorption/Desorption 294
Equilibria and Conversion to Polychlorinated Dibenzo-p-dioxins. Environ. Sci. Technol. 1996, 295
30, 225-229. 296
(2). Kasai, E.; Hosotani, Y.; Kawaguchi, T.; Nushiro, K.; Aono, T. Effect of additives on the dioxins 297
emissions in the iron ore sintering process. ISIJ Int. 2001, 41, 93-97. 298
(3). Harjanto, S.; Kasai, E.; Terui, T.; Nakamura, T. Behavior of dioxin during thermal remediation 299
in the zone combustion process. Chemosphere 2002, 47, 687-693. 300
(4). Suzuki, K.; Kasai, E.; Aono, T.; Yamazaki, H.; Kawamoto, K. De novo formation 301
characteristics of dioxins in the dry zone of an iron ore sintering bed. Chemosphere 2004, 54, 302
97-104. 303
(5). Kasai, E.; Harjanto, S.; Terui, T.; Nakamura, T.; Waseda, Y. Thermal remediation of PCDD/Fs 304
contaminated soil by zone combustion process. Chemosphere 2000, 41, 857-864. 305
(6). Buekens, A.; Stieglitz, L.; Hell, K.; Huang, H.; Segers, P. Dioxins from thermal and 306
metallurgical processes: recent studies for the iron and steel industry. Chemosphere 2001, 42, 307
729-735. 308
(7). Harjanto, S.; Kasai, E.; Terui, T.; Nakamura, T. Formation and transport of PCDD/Fs in the 309
packed bed of soil containing organic chloride during a thermal remediation process. 310
Chemosphere 2002, 49, 217-224. 311
(8). Tan, P.; Hurtado, I.; Neuschutz, D.; Eriksson, G. Thermodynamic Modeling of PCDD/Fs 312
Formation in Thermal Processes. Environ. Sci. Technol. 2001, 35, 1867-1874. 313
15 (9). Mitterlehner, J.; Loeffler, G.; Winter, F.; Hofbauer, H.; Schmid, H.; Zwittag, E.; Buergler, T. H.; 314
Pammer, O.; Stiasny, H. Modeling and simulation of heat front propagation in the iron ore 315
sintering process. ISIJ Int. 2004, 44, 11-20. 316
(10). Cieplik, M. K.; Carbonell, J. P.; Munoz, C.; Baker, S.; Kruger, S.; Liljelind, P.; Marklund, S.; 317
Louw, R. On Dioxin Formation in Iron Ore Sintering. Environ. Sci. Technol. 2003, 37, 3323-318
3331. 319
(11). Nath, N. K.; Mitra, K. Optimisation of suction pressure for iron ore sintering by genetic 320
algorithm. Ironmaking and Steelmaking 2004, 31, 199-206. 321
(12). Maeda, T.; Fukumoto, C.; Matsumura, T.; Nishioka, K.; Shimizu, M. Effect of adding moisture 322
and wettability on granulation of iron ore. ISIJ Int. 2005, 45, 477-484. 323
(13). Kawaguchi, T.; Kamijo, C.; Matsumura, M. The sintering behavior of raw material bed placing 324
large particles. Tetsu-to-Hagane 2006, 92, 779-787. 325
(14). Yang, W.; Choi, S.; Choi, E. S.; Ri, D. W.; Kim, S. Combustion characteristics in an iron ore 326
sintering bedevaluation of fuel substitution. Combustion and Flame 2006, 145, 447-463. 327
(15). Olie, K.; Vermeulen, P. L.; Hutzinger, O. Chlorodibenzo-p-dioxins and chlorodibenzofurans are 328
trace components of fly ash and flue gas of some municipal incinerators in The Netherlands. 329
Chemosphere 1977, 6, 455-459. 330
(16). Oh, J. E.; Choi, S. D.; Lee, S. J.; Chang, Y. S. Influence of a municipal solid waste incinerator 331
on ambient air and soil PCDD/Fs levels. Chemosphere 2006, 64, 579-587. 332
(17). Alcock, R. E.; Gemmill, R.; Jones, K. C. Improvements to the UK PCDD/F and PCB 333
atmospheric emission inventory following an emissions measurement programme. 334
Chemosphere 1999, 38, 759-770. 335
16 (18). Anderson, D. R.; Fisher, R. Sources of dioxins in the United Kingdom: the steel industry and 336
other sources. Chemosphere 2002, 46, 371-381. 337
(19). Aries, E.; Anderson, D. R.; Fisher, R.; Fray, T. A. T.; Hemfrey, D. PCDD/F and "Dioxin-like" 338
PCB emissions from iron ore sintering plants in the UK. Chemosphere 2006, 65, 1470-1480. 339
(20). Fisher, R. A. Statistical Methods for Research Workers, Oliver and Boyd, London, 1925. 340
(21). Bendell, A.; Disney, J.; Pridmore, W. A. Taguchi Methods: Applications in World Industry, IFS 341
Publications, UK, 1989. 342
(22). Raj, C. B. C.; Quen, H. L. Advanced oxidation processes forwastewater treatment: Optimization 343
of UV/H2O2 process through a statistical technique. Chemical Engineering Science 2005, 60, 344
5305 – 5311 345
(23). Chyang, C. S.; Wu, K. T.; Lin, C. S. Emission of nitrogen oxides in a vortexing fluidized bed 346
combustor. Fuel 2007, 86, 234–243. 347
(24). Yang, J.; Peng, J.; Guo, R.; Liu, K. C.; Jia, J. P,; Xu, D. L. Optimization and thermodynamic 348
assessment of ferrite (Fe3O4) synthesis in simulated wastewater. Journal of Hazardous 349
Materials 2007, 149, 106-114. 350
(25). Taguchi, G. Introduction to Quality Engineering, Asian Productivity Organization: Tokyo, 351
Japan, 1987; pp 121-132. 352
(26). Yang, W. H.; Tarng, Y. S. Design optimization of cutting parameters for turning operations 353
based on the Taguchi method. Journal of Materials Processing Technology 1998, 84, 122-129. 354
(27). Yang, W.; Ryu, C.; Choi, S.; Choi, E.; Lee, D.; Huh, W. Modeling of combustion and heat 355
transfer in an iron ore sintering bed with considerations of multiple solid phases. ISIJ 356
International 2004, 44, 492-499. 357
17 (28). Oyama, N.; Sato, H.; Takeda, K.; Ariyama, T.; Masumoto, S.; Jinno, T.; Fujii, N. Development 358
of coating granulation process at commercial sintering plant for improving productivity and 359
reducibility. ISIJ International 2005, 45, 817-826. 360
(29). International Organization for Standardization (ISO) 3271, Iron ores − Determination of tumble 361
strength. Third edition, 1995. 362
(30). Wang, L. C.; Lee, W. J.; Tsai, P. J.; Lee, W. S.; Chang-Chien, G. P. Emissions of 363
polychlorinated dibenzo-p-dioxins and dibenzofurans from stack flue gases of sinter plants. 364
Chemosphere 2003, 50, 1123-1129. 365
(31). Li, X. D.; Zhang, J.; Yan, J. H.; Chen, T.; Lu, S. Y.; Cen, K. F. Effect of water on catalyzed de 366
novo formation of polychlorinated dibenzo-p-dioxins and polychlorinated dibenzofurans. 367
Journal of Hazardous Materials 2006, 137, 57-61. 368
(32). Kasai, E.; Rankin, W. J.; Gannon, J. F. The Effect of Raw Mixture Properties on Bed 369
Permeability during Sintering. ISIJ Int. 1989, 29, 33-42. 370
(33). Haga, T.; Ohshio, A.; Nakamura, K.; Kozono, T. Control technique of the melting reaction in 371
sintering process by the fine part selective granulation of clayish iron ores. Tetsu-to-Hagane 372
1997, 83, 103-108.
373
(34). Imai, T.; Matsui, T.; Fujii, Y.; Nakai, T.; Tanaka, S. Oxidation catalyst of iron oxide 374
suppressing dioxin formation in polyethylene combustion. J Mater Cycles Waste Manag 2001, 375
3, 103–109. 376
(35). Hung, W. T.; Lin, C. F. Use of regenerated ferric oxide for CO destruction and suppressing 377
dioxin formation in flue gas in a pilot-scale incinerator. Chemosphere 2003, 53, 727-735. 378
18 List of Figures
380
FIGURE 1. The schematic of the pilot scale sinter pot 381
FIGURE 2. Congener profiles of seventeen PCDD/F congeners in the flue gases of sinter pot operated 382
under the nine experimental combinations 383
FIGURE 3. Mean S/N ratios of the four selected operation parameters at the three designated levels 384
19 385
386 387
388
FIGURE 1. The schematic of the pilot scale sinter pot 389 Hearth layer Raw mixture Pot body Windbox Suction air Ignition hood PCDD/Fs sampling hole
20 1 10 20 Exp. No.1 F ra c ti o n s ( % ) 1 10 20 30 Exp. No.2 2,3, 7, 8-TeC DD 1,2, 3,7, 8-Pe CDD 1,2, 3,4, 7, 8-HxCDD 1,2, 3,6, 7, 8-HxCDD 1,2, 3,7, 8, 9-HxCDD 1,2, 3,4, 6,7, 8-H pCD D OC DD 2,3, 7, 8-TeC DF 1,2, 3,7, 8-P eCD F 2,3, 4,7, 8-P eCD F 1,2, 3,4, 7, 8-HxCDF 1,2, 3,6, 7, 8-HxCDF 2,3, 4,6, 7, 8-HxCDF 1,2, 3,7, 8, 9-HxCDF 1,2, 3,4, 6,7, 8-H pCDF 1,2, 3,4, 7,8, 9-H pCD F OC DF 1 10 20 Exp. No.3 Exp. No.4 Exp. No.5 2,3, 7, 8-TeC DD 1,2, 3,7, 8-P eCD D 1,2, 3,4, 7, 8-HxCD D 1,2, 3,6, 7, 8-HxCDD 1,2, 3,7, 8, 9-HxCDD 1,2, 3,4, 6,7, 8-H pCDDOCDD 2,3, 7, 8-TeC DF 1,2, 3,7, 8-Pe CD F 2,3, 4,7, 8-Pe CD F 1,2, 3,4, 7, 8-HxC DF 1,2, 3,6, 7, 8-HxC DF 2,3, 4,6, 7, 8-HxCDF 1,2, 3,7, 8, 9-HxCDF 1,2, 3,4, 6,7, 8-Hp CDF 1,2, 3,4, 7,8, 9-HpCDFOC DF Exp. No.6 Exp. No.7 Exp. No.8 2,3, 7, 8-TeCDD 1,2, 3,7, 8-P eCD D 1,2, 3,4, 7, 8-HxC DD 1,2, 3,6, 7, 8-HxC DD 1,2, 3,7, 8, 9-HxC DD 1,2, 3,4, 6,7, 8-Hp CDD OCDD 2,3, 7, 8-TeCDF 1,2, 3,7, 8-P eCDF 2,3, 4,7, 8-P eCDF 1,2, 3,4, 7, 8-HxC DF 1,2, 3,6, 7, 8-HxC DF 2,3, 4,6, 7, 8-HxC DF 1,2, 3,7, 8, 9-HxC DF 1,2, 3,4, 6,7, 8-Hp CD F 1,2, 3,4, 7,8, 9-Hp CDFOCDF Exp. No.9 390 391 392 393 394 395 396 397 398 399 400 401 402 403 404 405 406
FIGURE 2. Congener profiles of seventeen PCDD/F congeners in the flue gases of sinter pot operated 407
under the nine experimental combinations 408
21 Bed height 6.0 wt% 6.5 wt% 7.0 wt% 1000 mm H2O 1200 mm H2O 1400 mm H2O 500 mm 550 mm 600 mm Hem atite Sint er Lim onite M e a n S /N r a ti o ( d B ) -20 -18 -16 -14 -12 -10 -8 -6 -4 Suction pressure
Water content Hearth layer
409 410 411 412 413 414 415 416 417 418
FIGURE 3. Mean S/N ratios of the four selected operation parameters at the three designated levels 419
22
List of Tables
420
TABLE 1. Operating parameters and their selected levels for the studied sintering process 421
TABLE 2. The nine designed experiment combinations of the four selected parameters for the Taguchi 422
L9 orthogonal array
423
TABLE 3.PCDDs, PCDFs, gas- and particle-phase PCDD/Fs, and total PCDD/Fs emission 424
concentrations (ng I-TEQ/Nm3) in the flue gas of the nine designed experimental 425
combinations and their corresponding emission factors of total PCDD/Fs (EFPCDD/Fs; ng
I-426
TEQ/kg-feedstock) 427
TABLE 4. The resultant S/N ratios for the nine experiment combinations of the Taguchi L9 orthogonal
428
array 429
TABLE 5. Mean S/N ratios for the four selected operation parameters in three designated levels 430
TABLE 6. Results of the analysis of variance for the four selected parameters 431
TABLE 7. The emitted total EFPCDD/Fs and its corresponding S/N ratio obtained from the reference
432
operation combination and optimal operation combination (including both predicted and 433
that obtained from the confirmation experiments) 434
23 435
436
Table 1. Operating parameters and their selected levels for the studied sintering
process
Operation parameter Unit Level 1a Level 2 Level 3
Water content (Wc) wt % 6.5 6.0 7.0
Suction pressure (Ps) mmH2O 1200 1000 1400
Bed Height (Hb) mm 550 500 600
Hearth layer - Sinter Hematite Limonite
a
: Reference combination
Table 2. The nine designed experiment combinations of the four selected
parameters for the Taguchi L9 orthogonal array Experiment
combination
Water content
Suction
pressure Bed Height
Hearth layer 1 1 1 1 1 2 1 2 2 2 3 1 3 3 3 4 2 1 2 3 5 2 2 3 1 6 2 3 1 2 7 3 1 3 2 8 3 2 1 3 9 3 3 2 1
24 437 438 439 440 441 442 443 444
Table 3. PCDDs, PCDFs, gas- and particle-phase PCDD/Fs, and total PCDD/Fs emission concentrations
(ng I-TEQ/Nm3) in the flue gas of the nine designed experimental combinations and their corresponding emission factors of total PCDD/Fs (EFPCDD/Fs; ng I-TEQ/kg-feedstock)
Experimental combination Emission concentration 1 2 3 4 5 6 7 8 9 PCDDs 0.187 0.040 0.043 0.059 0.049 0.079 0.055 0.075 0.119 PCDFs 0.719 0.238 0.529 0.952 0.666 1.15 0.846 1.08 1.58 Gas-phase PCDD/Fs 0.564 0.196 0.365 0.518 0.325 0.752 0.570 0.963 1.21 Particle-phase PCDD/Fs 0.342 0.082 0.206 0.492 0.390 0.477 0.331 0.191 0.485 Total PCDD/Fs 0.906 0.279 0.571 1.01 0.715 1.23 0.901 1.15 1.70 Emission factor Total EFPCDD/Fs 3.09 1.01 2.44 5.80 3.45 5.05 7.40 9.37 8.79
25
Table 4. The resultant S/N ratios for the nine experiment combinations of the Taguchi L9 orthogonal array
Experiment combination Water content (%) Suction pressure (mmH2O) Bed height (mm) Hearth layer S/N ratio (dB) 1 6.5 1200 550 sinter -10.8 2 6.5 1000 500 hematite -0.69 3 6.5 1400 600 limonite -7.77 4 6 1200 500 limonite -15.3 5 6 1000 600 sinter -10.7 6 6 1400 550 hematite -14.1 7 7 1200 600 hematite -17.4 8 7 1000 550 limonite -19.6 9 7 1400 500 sinter -19.1
26 445 446 447 448 449 450 451 452 453 454 455
Table 5. Mean S/N ratios for the four selected operation parameters in three
designated levels
Mean S/N ratio (dB) Operation parameter
Level 1 Level 2 Level 3 MaxMin Rank Water content (Wc) -6.42 -13.4 -18.7 12.3 1 Suction pressure (Ps) -14.5 -10.3 -13.7 4.15 2
Bed Height (Hb) -14.8 -11.7 -12.0 3.15 4
Hearth layer -13.5 -10.8 -14.2 3.45 3
Table 6. Results of the analysis of variance for the four selected parameters
Operation parameter DOFa SSb Varc Fd p-value
Contribution (%) Water content (Wc) 2 456 228 22.9 <0.001 74.7 Suction pressure (Ps) 2 58.0 29.0 2.92 0.105 9.49 Bed Height (Hb) 2 36.4 18.2 1.83 0.215 5.95 Hearth layer 2 40.3 20.1 2.03 0.187 6.59 Error 9 89.4 9.93 - - 3.25 Total 17 680 305 - - 100 a
Degree of freedom; bSum of squares; cMean square; dF-test
Table 7. The emitted total EFPCDD/Fs concentration and its corresponding S/N ratio
obtained from the reference operation combination and optimal operation combination (including both predicted and that obtained from the confirmation experiments).
Optimal operation combination Testing results Reference operation
combination Prediction Confirmation Total EFPCDD/Fs
( ng I-TEQ/kg-feedstock )
3.09 1.01 1.15