糖尿病鼠在缺氧和高二氧化碳下GABA 和NMDA受體對呼吸反應的調節; GABAergic and NMDA-mediated modulation of ventilatory response to hypoxia and hypercapnia in diabetes rats
53
0
0
全文
(2) 中文摘要 在糖尿病病人身上可以發現到,當處於在一個缺氧的環境下其呼吸反應會相較一般人 來的遲鈍,但是其中的機轉並未讓人所明白。在其他的研究指出,糖尿病病人體內的神經調 節物質會受到改變或損傷,而在呼吸反應調控方面會因抑制性或興奮性的神經傳導物質影響 而有所不同。本研究的目的是在於探討當神經傳導物質- gamma-aminobutyric acid A (GABAA) 和 N-methyl-D-aspartic acid (NMDA)的改變而使得糖尿病病人在急性缺氧時的呼吸反應改變。 實驗 1, 實驗為兩組老鼠,一組為正常另一組使用 streptozotocin(STZ, 65 mg/kg i.p.)誘發成胰島 素依賴型糖尿病,接給注射 DMSO 和 bicuculline (0.5 ml/kg s.q.),利用 BUXCO 系統給予一般 空氣(21%. O2)30分鐘和缺氧氣體(10%. O2)30分鐘接著再給一般空氣(21 %. O2) 10 分鐘和高二氧化碳氣體(8% CO2)20 分鐘並給予記錄。實驗 2, 同樣為兩組 8 周大的老 鼠,一組是正常狀態下而另一組是使用 streptozotocin (STZ, 65 mg/kg i.p.)誘導為胰島素依賴型糖 尿病模式,分別給予注射 saline 和dextromethorphan (DxM, 0.5 ml/kg s.q.), 同樣是利用 BUXCO 系統給予一般空氣(21%. O2)30分鐘和缺氧氣體(10%. O2)30分鐘接. 著再給一般空氣(21 %O2) 10 分鐘和高二氧化碳氣體(8% CO2)20 分鐘同樣給予記錄。實驗 1, 結果發現糖尿病組在急性缺氧時的呼吸反應明顯較正常組來的遲鈍。在糖尿病組中給予 bicuculline 的介入後其呼吸反應有顯著的恢復,而在正常組的老鼠給予 bicuculline 後沒有任何 的改變。此實驗結果顯示當GABAA接受器被阻斷後糖尿病病人在急性呼吸反應有恢復的現 象,顯示其呼吸反應遲鈍是因內因性GABA的作用特別是對GABAA接受器。GABA調 節的改變會損害糖尿病病人在面對睡眠呼吸中止症相關的代償反應。實驗 2,結果發現在糖尿 病組在急性缺氧時的呼吸反應明顯較正常組來的鈍。在糖尿病組中給予dextromethorphan的介 入後其呼吸反應並無顯著差異,在正常組的老鼠予dextromethorphan介入後沒有任何的改變。. I.
(3) ABSTRACT Diabetes mellitus (DM) patients exhibit blunted ventilatory responses to acute hypoxia whereas the underlying mechanism is unknown. The purpose of the study is to determine whether altered gamma-aminobutyric acid (GABA)ergic mechanisms acting in GABAA receptors contribute to the abnormal ventilatory response to hypoxia in diabetes mellitus. Ventilatory function ventilation (VE), tidal volume (VT), and breathing frequency (f) was assessed using in an unrestricted whole body plethysmograph (Buxco System) in eight non-DM Wistar rats and 8 streptozotocin(STZ)induced diabetic rats (65 mg/kg i.p., DM). Part 1, Ventilation (VE), tidal volume (VT), and breathing frequency (f) during room air breathing and in response to acute (<10 min) and sustained (10-30 min) hypoxic (10% O2) and hypercapnia (CO2) challenges were measured on two separate occasions following the randomized blinded administration of equal volumes of DMSO (vehicle), bicuculline (0.5 mg/kg, GABAA receptor antagonist). Part 2, Ventilation (VE), tidal volume (VT), and breathing frequency (f) during room air breathing and in response to acute (<10 min) and sustained (10-30 min) hypoxic (10% O2) and hypercapnia (8% CO2) challenges were measured on two separate occasions following the randomized blinded administration of equal volumes of saline (vehicle) and dextromethorphan (DxM, 0.5 mg/kg, NMDA receptor antagonist). Part 1, Ventilatory response to acute (not sustained) hypoxia in DM group was significantly (P<0.05) blunted compared to non-DM group. Bicuculline administration in non-DM Wistar rats had no effect on ventilation either during room air breathing, or acute and sustained exposure to hypoxia. In contrast, bicuculline administration in DM group significantly increased ventilatory response to acute hypoxia. However, bicuculline administration in DM Wistar rats had no effect on ventilation either during room air breathing or sustained hypoxia. Blunted ventilatory responses to acute hypoxia in diabetes mellitus appeared to be suppressed by endogenous GABA by acting specifically on GABAA receptors. Altered GABAergic modulation of acute ventilatory response in diabetes might potentially impact sleep apnea episode (acute hypoxia) related ventilatory compensation. Part 2, Ventilatory response to hypoxia in DM group was significantly blunted compared to non-DM group. Dextromethorphan administration in non-DM Wistar rats had no effect on ventilation either during room air breathing, or acute and sustained exposure to hypoxia. In contrast, dextromethorphan administration in DM Wistar rats had no effect on ventilation either during room air breathing or acute and sustained hypoxia. In hypercapnia, to compare vehicles and drugs it no effect on ventilation for either DM and non DM group.. II.
(4) 致謝 時光飛逝兩年的碩士生涯一下子就過去,在這不長不短的時間裡,一路上面對太多事 情,有太多的人助我在挫折中一一的面對難關,這些要感謝的人太多了,一時之間不知該如 何表明謝意。 首先能讓本篇論文順利的完成,要先感謝我的指導教授李信達老師,感謝他對於我的研 究所生涯不斷的給予鼓勵與指導,讓我能有許多不同的觀點面對問題去解決困難,並耐心的 教導我做報告及撰寫論文。感謝口試委員駱明潔老師、吳柏蒼老師對我所做的研究及論文提 出許多不同的見解並給予指導。 謝謝系所上吳柏蒼老師、陳郁文老師及謝悅齡老師,給予我許多學業上和生活鼓勵與幫 助,不論是儀器借用或使用都給我很多的協助,讓我實驗能順利進行。謝謝凡妮、憶帆教我 許多實驗的技術,也協助我的實驗能順利進行。也謝謝實驗室的學弟妹泳璁、凱玲、智超與 曉玲,有你們的加入使得研究所生活不再枯燥單調,讓生活更活潑。謝謝昆霖,能從大學有 緣到現在,協助處理研究所的大小事情,解決很多莫名的雜事。更特別感謝乃瑜,能在我身 邊一直給予我許多幫忙及很大的鼓勵,讓我能有走下去動力。 最後要感謝家人,在我研究所的過程中,一直給我莫大的鼓勵與支持;特別感謝我弟弟, 能給我許多正面的思考幫助我熬過難關。最後,感謝所有在我研究所給予我幫助的人,謝謝 您們讓我能不斷的成長與進步的動力。. III.
(5) Index 1. C h i n e s e abstract. Ⅰ. 2. E n g l i s h abstract. Ⅱ. 3. Acknowledgement. Ⅲ. 4. Index. Ⅳ. 5. Chapter 1 Background review. 1. 6. C h a p t e r 2 Aims of this study. 8. 7. C h a p t e r 3 Material and methods. 10. 8. C h a p t e r 4 Results. 16. 9. C h a p t e r 5 Discussion. 19. 10. Table and figur. 24. 10.1 Table 1. Non-DM and DM rats on hypoxia resting time. (Bicucullin). 25. 10.2 Table 2. Non-DM and DM rats on hypoxia 4 min. (Bicucullin). 26. 10.3 Table 3. Non-DM and DM rats on hypoxia 30 min.(Bicucullin). 27. 10.4 Table 4. Non-DM and DM rats on hypercapnic resting time. (Bicucullin). 28. 10.5 Table 5. Non-DM and DM rats on hypercapnic 15 min. (Bicucullin). 29. 10.6 Fig 1. DM and Non DM rats for hypoxia. 30. 10.7 Fig 2. Bicuculline and DMSO for hypoxia. 31. 10.8 Fig 3. DM and Non DM rats for hypercapnic. 32. 10.9 Fig 4. Bicuculline and DMSO for hypercapnic. 33. 10.10 Table 6. Non-DM and DM rats on hypoxia resting time. (DxM). 34. 10.11 Table 7. Non-DM and DM rats on hypoxia 4 min. (DxM). 35. IV.
(6) 11. 10.12 Table 8. Non-DM and DM rats on hypoxia 30 min.( DxM). 36. 10.13 Table 9. Non-DM and DM rats on hypercapnic resting time. ( DxM). 37. 10.14 Table 10. Non-DM and DM rats on hypercapnic 15 min. ( DxM). 38. 10.15 Fig 5. DM and Non DM rats for hypoxia. 39. 10.16 Fig 6. DxM and saline rats for hypoxia. 40. 10.17 Fig 7. DM and Non DM rats for hypercapnic. 41. 10.18 Fig 8. DxM and saline rats for hypercapnic. 42. C h a p t e r 6 Reference. 43. V.
(7) Chapter 1 Background review. 1.
(8) 1.1 Ventilatory responses to hypoxia In mature animals the peripheral arterial chemoreceptors in the carotid body are the first step in a closed-loop feedback control system that acts to normalize arterial oxygen and carbon dioxide levels by effecting changes in ventilation. This ventilatory control system is critically important in promoting arousal from sleep during hypoxia, altering ventilatory pattern due to changes in inspired oxygen, and in responding to decreases in arterial oxygen as may occur in numerous circumstances such as apnea and airway obstruction(18). The difference in ventilatory response to hypoxia between neonatal and adult subjects is well documented(54). The hypoxic ventilatory response is susceptible to developmental plasticity, and that a carotid chemoreceptor deficit is the primary cause(33). The ventilatory response to sustained hypoxia in humans and in some animals is characterized by an initial increase in ventilation (early phase), followed by a gradual decline in ventilation (late phase). Evaluation of breathing pattern revealed that during constant hypoxia there was little alteration in respiratory timing and that the changes in inspiratory minute ventilation were related to significant alterations in tidal volume and mean inspiratory flow (VT/Ti) (16). Hyperoxia might elicit this plasticity by inhibiting chemoreceptor activity during early life(3).. 1.2 Ventilatory responses to hypercapnia Elevated CO2 (hypercapnia) is a major stimulus for increased ventilation. Increases in blood CO2 are proposed to be monitored by specialized neurons known as central chemoreceptors, which are believed to be localized within several areas of the brainstem including the ventrolateral medulla (VLM), the nucleus of the solitary tract (NTS), the locus coeruleus (LC) and the medullary raphe(11, 12). Recent reports have shown that there are developmental changes in the ventilatory response to hypercapnia in the rat. These are characterized by an initial large response to carbon dioxide immediately after birth followed by a decline with a trough at one week of age, followed by a return in sensitivity(6). In the linear increase in minute. ventilation was observed with step-wise increases 2.
(9) of inspired CO2 from 0 to 10%. Other studies dealing with the ventilatory response to CO2 tend to make comparisons between a control (normocapnia) and a single hypercapnic stimulus rather than step-wise increases over a range of CO2 concentrations(50).. 1.3 Diabetes mellitus and ventilatory responses to hypoxia The insulin-dependent diabetes mellitus (IDDM) can lead to an overall depression in ventilatory control mechanisms. Rats with streptozotocin (STZ)-induced IDDM also exhibit decreased baseline ventilation, as well as attenuated hypercapnic and hypoxic ventilatory responses (42). In IDDM, the greater perception of dyspnea is associated with changes in inspiratory effort being out of proportion to changes in ventilation. The greater increase in dynamic elastance and the lower increase in ventilation may, account for the greater perception of breathlessness during hypoxia (47). Type 2 diabetic human subjects exhibit blunted ventilatory responses to acute hypoxia, suggesting that this group of diabetic subjects possesses a chemoreflex ill-equipped to respond homeostatically to hypoxic challenge (55).. 1.4 Diabetes mellitus and ventilatory responses to hypercapnia In the past study seven diabetics had an impaired response to hypercapnia. Loss of integrity of motor descending pathways to the respiratory muscles is a possible cause of a reduced ventilatory response to hypercapnia(56). In other study was conducted to elucidate the changes in ventilatory responses to hypercapnia and hypoxia and the effects of insulin in long-term DM rats. Acute ventilatory responses to progressive hypercapnia and hypoxia increased with age in the normal rats, whereas they were relatively constant at a lower level in the DM group. The significant reduction in the ventilatory response in the DM group appeared 16 w after STZ injection, and it was not recovered by insulin treatment(59). A decreased ventilatory response to hypercapnia may occur as a. 3.
(10) result of a reduction in the amount of afferent information arising from the carotid bodies(21).. 1.5 Neurotransmitter GABA and Glutamate in diabetes The other studies, insulin modulates synaptosomal GABA, thus having a neuroprotective role under oxidizing and/or diabetic conditions (15) . The in vivo basal striatal GABA levels of streptozotocin diabetic rats are similar to non-diabetic rats, suggest that diabetes may change GABA homeostasis and modify behavioral responses in an animal model of depression (20). In a other theme the gamma amino butyric acid (GABA) and its related enzymes have been demonstrated in pancreatic beta cells of normal rat. It was shown that the number of GABA-LIR cells is reduced significantly in diabetes. Moreover, GABA is a strong secretagogue of insulin from the pancreas of normal rat (1). The GABA transport might be implicated in the neuroprotective role of insulin (14). The lower susceptibility of synaptosomes isolated from diabetes rats to lipid peroxidation as compared with synaptosomes isolated from non-diabetes Wistar rats. The diabetes rat synaptosomes, that state affected the uptake of the neurotransmitters GABA (13). Insulin administration to neurons regulates the cell surface localization, or activity, of a variety of neurotransmitter receptors. Insulin modulates glutamate receptors and GABAA(29, 35) . These effects on NMDA receptors can potentially explain some of the known CNS effects of diabetes(4). The modulation of the surface localization of the NMDA subtype of glutamate receptor could explain various central defects indiabetic animals and diabetic patients, including the impairment of learning and memory (independent of altered glucose levels), impaired synaptic plasticity(5, 41, 52, 60), reduced central sensory responses(2), dendritic shortening in the hippocampus (36) and altered hypothalamic function (61). In prior studies find that there can be amarked inter-animal and intra-animal variability in the NMDA receptor response to diabetes; this may also account for the disparity between prior studies and correspond to the variability in sensory impairments(4). 4.
(11) Insulin insufficiency has multiple actions on the CNS. These effects on NMDA receptors can potentially explain some of the known CNS effects of diabetes.(4) Previous studies have indicated an association between diabetes mellitus and impairments in synaptic plasticity in the hippocampus. The results showed that glutamate levels were significantly decreased in diabetes group compared to the control group. The diabetes affects the concentration of glutamate in extracellular space in the DG. That is a possibility for involvement of pre-synaptic component in synaptic plasticity defect in the hippocampus under diabetic conditions(46).. 1.6 Neurotransmitter GABA and ventilatory response to hypoxia Gamma-aminobutyric acid (GABA) is the major inhibitory neurotransmitter in the mammalian central nervous system (CNS) and acts at approximately 25-40% of the synapses within the CNS (7). GABA-A receptors have been shown to be involved in the generation and the modulation of respiration (23, 28). During hypoxic challenges, brain GABA levels increase and exert an inhibitory modulation during the sustained hypoxic ventilatory response (37, 57). During hypoxia, the respiratory drive is determined by a balance between the stimulation of peripheral chemoreceptors and the central depression of hypoxia on respiration(49). It has been postulated that the ventilatory response to hypoxia is modulated by a variety of neurotransmitters, including GABA (28, 49). Brain GABA content is elevated during hypoxic (57).. 1.7 Neurotransmitter NMDA and ventilatory response to hypoxia Ventilation in response to hypoxic exposure is closely related to the release of excitatory neurotransmitters, in particular glutamate, acting specifically on N-methyl-D-aspartate (NMDA) receptors(31).The N-methyl-D-aspartate (NMDA) receptor has many functions throughout the central nervous system (CNS) including its role within the centers controlling respiration(53). The. 5.
(12) increase in ventilationduring hypoxia is closely related to the release of excitatory neurotransmitters, in particular glutamate, acting on Nmethyl- D-aspartate (NMDA) receptors located in brainstem respiratory motor neurons (32). Chronic hypoxia altered the effect of MK-801 on the acute HVR, primarily because of increased effects on tidal volume. This indicates that changes in NMDA receptor-mediated neurotransmission may be involved in ventilatory acclimatization to hypoxia(45). An attempt has been made to test the hypothesis that, in the caudal part of nucleus tractus solitarii (NTS) where carotid sinus nerve (CSN) afferents project, L-glutamate (Glut) modulates the hypoxic ventilatory response. Pretreatment with MK-801 or kynurenate reduced the hypoxic ventilatory response. This reduction in ventilation was mainly due to the decrease in tidal volume. (38).. 1.8 Neurotransmitter and ventilatory response to hypercapnia Hypercapnia stimulates ventilation in general, but it seems to elicit little or no metabolic response that might modify the demand for ventilation. Although the ventilatory response to CO2 may lack a metabolic component and is generally stable during the short duration exposure periods that have been studied, the ventilatory response to CO2 is not stable over the period of development. The developmental changes of the responsiveness of individual chemosensitive neurons to hypercapnia or to a developmental change in the number of chemosensitive neurons (43). The particular patterns of activity present in the central nervous system seem to prune the dendritic arbor and decrease the number of synapses, so that certain synapses are strengthened and others are removed. Glutamate, acting through NMDA receptors, seemed to be particularly important in the process of stabilizing favored synaptic pathways while eliminating others (51). Neurons from two of the three brainstem chemosensitive regions studied, the locus coeruleus and nucleus of solitary tract, seemed to have a fully developed response to hypercapnia at birth that showed no detectable change with development. The development of chemosensitivity of neurons did not appear to play a critical. 6.
(13) role in the triphasic developmental pattern of the ventilatory response to hypercapnia seen in intact neonatal rats(50).. 1.9 Neurotransmitter and diabetes for ventilatory response In the present research, the releance between diabetes respiratory reaction and the neurotransmitter is currently unknown. In the hypoxia and hypercapnia situations, it can affect respiratory reaction of most people, but the effects on bodies of diabetes people are also currently unknown.. 7.
(14) Chapter 2. Aims of this study. 8.
(15) 2.1 Aims of this study Whether the altered ventilatory response to hypoxia and hypercapnic observed in DM Wistar rats is associated with altered GABAA receptors and glutamatergic NMDA function has not been previously studied, and formed the basis of our study. Part 1: Since STZ-induced DM rats are known to possess altered brain GABAergic mechanisms, we hypothesized that ventilatory response to hypoxia and hypercapnic in DM Wistar rats would also be modulated by GABAergic mechanism. We hypothesized that the altered ventilatory response to hypoxia in diabetes rats is mediated in part via altered GABAA receptors function. We used bicuculline, GABAA receptors antagonist to investigate whether endogenous GABA modulates ventilation at rest and ventilation during hypoxic and hypercapnic exposure in diabetes rats. The agents were given in a blinded-randomized design with 72-hour recovery between successive ventilatory tests. A parallel study design was used, with non-DM Wistar rats serving as controls. The role of GABA in mediating breathing control during hypoxic exposure in diabetes has to our knowledge, not been previously investigated. Part 2: Since STZ-induced DM rats are known to possess altered brain glutamate NMDAergic mechanisms, we hypothesized that ventilatory response to hypoxia and hypercapnic in diabetes rats would also be modulated by NMDA-mediated mechanism. We hypothesized that the altered ventilatory response to hypoxia in diabetes rats is mediated in part via altered NMDA receptors and glutamatergic NMDA function. We used dextromethorphan (DxM), a noncompetitive NMDA receptor antagonist to investigate whether endogenous glutamate modulates ventilation via NMDA. 9.
(16) at rest and ventilation during hypoxic and hypercapnic exposure in diabetes rats. The agents were given in a blinded-randomized design with 72-hour recovery between successive ventilatory tests. A parallel study design was used, with non-DM Wistar rats serving as controls. The role of glutamate NMDA receptors in mediating breathing control during hypoxic exposure in diabetes has to our knowledge, not been previously investigated.. Chapter 3. Material and methods. 10.
(17) 3.2 Material and methods 3.2.1 Animals Part 1: The studies were performed on 8 non-DM Wistar rats and 8 induce DM Wistar rats (streptozotocin, 65 mg/kg i.p., Sigma Chemical, Co., Louis, MO, USA) age-matched male Wistar rats. Animals were purchased from BioLASCO Taiwan Co., Ltd at 4 weeks of age. One non-DM and one DM rat were housed per cage. Ambient temperature was maintained at 21C and an artificial 12-h light-dark cycle was set. The light period began at 7:00 AM. Rats were provided with standard laboratory chow (LabDiet® Dealers, St. Louis, MO) and water ad libitum.. All protocols were approved by the. Institutional Animal Care and Use Committee of the China Medical University at Taiwan. Animals underwent testing at 8 weeks of age. Part 2: The studies were performed on 14 non-DM Wistar rats and 14 induce DM Wistar rats (streptozotocin, 65 mg/kg i.p., Sigma Chemical, Co., Louis, MO, USA) age-matched male Wistar rats. Animals were purchased from BioLASCO Taiwan Co., Ltd at 4 weeks of age. One non-DM and one DM rat were housed per cage. Ambient temperature was maintained at 21C and an artificial 12-h light-dark cycle was set. The light period began at 7:00 AM. Rats were provided with standard laboratory chow (LabDiet® Dealers, St. Louis, MO) and water ad libitum.. All protocols were approved by the. Institutional Animal Care and Use Committee of the China Medical University at Taiwan. Animals underwent testing at 6 weeks of age.. 11.
(18) 3.2.3 Blood glucose Part 1: We use the streptozotocin (STZ)-induced diabetic rats. STZ (65 mg/kg) was dissolved in sodium citrate (50 mM) buffered saline. All injections were given intraperitoneally (i.p.). Rats were randomly divided into two groups. Rats were denoted as having diabetes if blood glucose level measured ≥220 mg/dl by 2 days post-STZ injection. Accu-ChekAdvantage technology uses two components: electronic meter and disposable biosensor. The inserts a biosensor into the meter and applies a small drop of blood from rats tail. Part 2: We use the streptozotocin (STZ)-induced diabetic rats. STZ (65 mg/kg) was dissolved in sodium citrate (50 mM) buffered saline. All injections were given intraperitoneally (i.p.). Rats were randomly divided into two groups. Rats were denoted as having diabetes if blood glucose level measured ≥220 mg/dl by 2 days post-STZ injection. Accu-ChekAdvantage technology uses two components: electronic meter and disposable biosensor. The inserts a biosensor into the meter and applies a small drop of blood from rats tail.. 3.2.3 Pulmonary ventilation Part 1: Breathing pattern was recorded by the whole body plethysmography. Subjects can move freely in the chambers for minimum stress and study under the most natural conditions. The unrestrained whole body plethysmography application involves measuring a "box flow" which is the net (or sum) of nasal and thoracic flows. Actual flows are calculated in the software, taking into account temperature, humidity, and pressure. (Buxco research systems©, Wilmington, North Carolina USA). To measure minute volume (VE), tidal volume (VT), breathing frequency (f ) , inspiratory time (Ti ), expiratory time (Te), peak inspiratory flow (PIF), peak expiratory flow (PEF). The rat was placed into the chamber and exposed to room air (21% O2, balance N2) for 30 minutes, hypoxia (10 % O2, balance N2) for 30 minutes, room air for 15 minutes and hypercapnic (8% CO2). Ventilatory patterns were recorded at the end of 30 min room. air, at 30 min during the hypoxic exposure, and at 12.
(19) the end of the room air 10min. At hypercapnic situation were recorded at the end of 15 min. Part 2: Breathing pattern was recorded by the whole body plethysmography. Subjects can move freely in the chambers for minimum stress and study under the most natural conditions. The unrestrained whole body plethysmography application involves measuring a "box flow" which is the net (or sum) of nasal and thoracic flows. Actual flows are calculated in the software, taking into account temperature, humidity, and pressure. (Buxco research systems©, Wilmington, North Carolina USA). To measure minute volume (VE), tidal volume (VT),. breathing frequency (f ) ,. inspiratory time (Ti ), expiratory time (Te), peak inspiratory flow (P IF), peak expiratory flow (PEF). The rat was placed into the chamber and exposed to room air (21% O2, balance N2) for 30 minutes, hypoxia (10 % O2, balance N2) for 30 minutes, room air for 15 minutes and hypercapnic (8% CO2). Ventilatory patterns were recorded at the end of 30 min room air, at 30 min during the hypoxic exposure, and at the end of the room air 15 min. At hypercapnic situation were recorded at the end of 15 min.. 3.2.4 Experimental protocol Part 1: Animals were tested 30 min following a sub-cutaneous (S.Q.) injection of equal volumes (0.5ml/kg) of DMSO (vehicle) or bicuculline (0.5mg/kg) (Sigma Chemical, Co., Louis, MO, USA). Bicuculline effects are noted within 10 minutes of injection and lasts for more than 2 hours in rodents (58). The current studies were carried out 5 min after injection. The agents were given in a blinded randomized design, with 72 hours elapsing between successive tests. The solutions were prepared daily and placed in vials labeled as solutions A or B. The agents were given in a blinded design and randomized order. To reduce the stress level during the study, 3 days before the first ventilation all animals were habituated to an experimental protocol for 60 minutes. To minimize any potential differences related to circadian rhythms, each rat was injected and tested at the same approximate time of day. Part 2: Animals were tested 30 min following a sub-cutaneous (S.Q.) injection of equal 13.
(20) volumes (0.5ml/kg) of saline (vehicle) or dextromethorphan (0.5mg/kg) (Sigma Chemical, Co., Louis, MO, USA). Effects are noted within 10 minutes of injection and lasts for more than 2 hours in rodents (37, 58). The current studies were carried out 5 min after injection. The agents were given in a blinded randomized design, with 72 hours elapsing between successive tests. The solutions were prepared daily and placed in vials labeled as solutions A or B. The agents were given in a blinded design and randomized order. To reduce the stress level during the study, 3 days before the first ventilation all animals were habituated to an experimental protocol for 60 minutes. To minimize any potential differences related to circadian rhythms, each rat was injected and tested at the same approximate time of day.. 3.2.5 Statistical analysis Part 1: Due to interactions among the three factors, the effects of bicuculline on minute volume (VE), tidal volume (VT),. breathing frequency (f ) , mean inspiratory flow (VT / Ti), inspiratory time (Ti ),. expiratory time (Te), peak inspiratory flow (P IF), peak expiratory flow (PEF), were subsequently tested as a single group repeated measure with contrast transformation during room air, during hypoxic exposure in non-DM and DM rats, separately. Minute volume (VE) was also calculated (VE = VT × f ) and neural respiratory drive was assessed as the mean inspiratory flow (VT / Ti). The contrast transformation is a useful approach when one level of the repeated measures is a control (i.e. DMSO) against which the others (i.e. bicuculline) are compared. In all cases, use the paired t-test measures and has a difference at P<0.05 was considered statistically significant. All data presented in the text and tables represent means SD, and for figures represent means SDE Part 2: Due to interactions among the three factors, the effects of dextromethorphan on minute volume (VE), tidal volume (VT),. breathing frequency (f ) , mean inspiratory flow (VT / Ti), inspiratory. time (Ti ), expiratory time (Te), peak inspiratory flow (PIF), peak expiratory flow (PEF),. were. subsequently tested as a single group repeated measure with contrast transformation during room 14.
(21) air, during hypoxic exposure in non-DM and DM rats, separately. Minute volume (VE) was also calculated (VE= VT × f ) and neural respiratory drive was assessed as the mean inspiratory flow (VT / Ti). The contrast transformation is a useful approach when one level of the repeated measures is a control (i.e. saline) against which the others (i.e. dextromethorphan) are compared. In all cases, use the paired ttest measures and has a difference at P<0.05 was considered statistically significant. All data presented in the text and tables represent means SD, and for figures represent means SDE.. 15.
(22) ‘. Chapter 4 Results. 16.
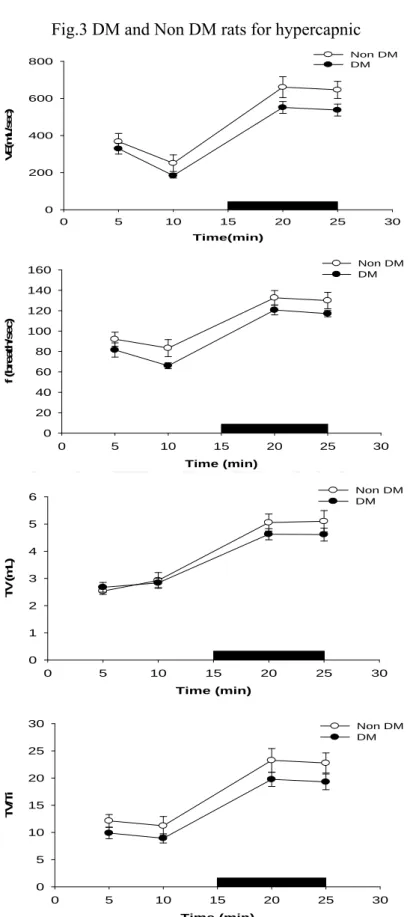
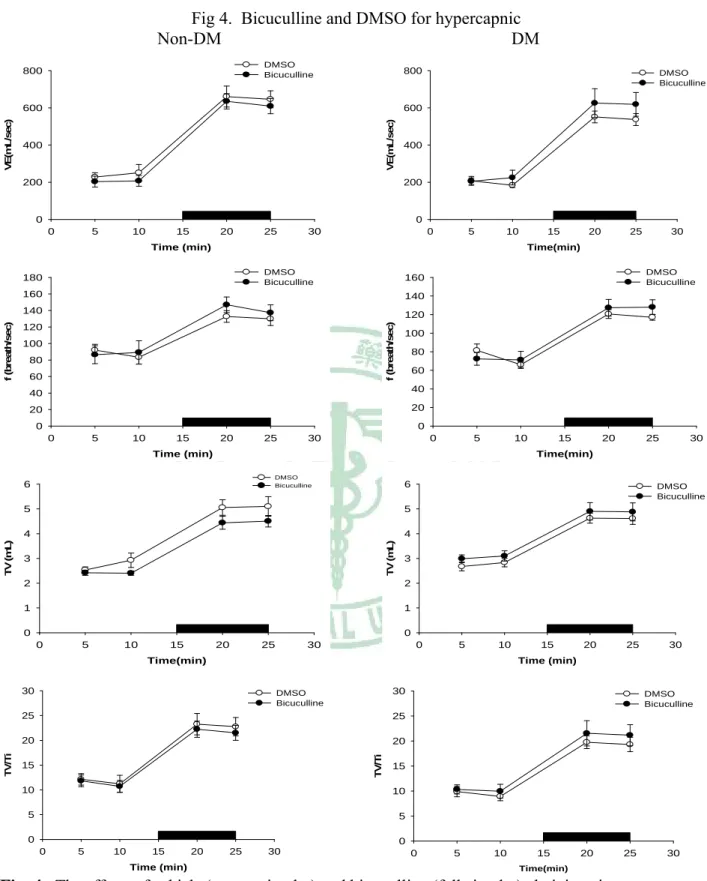
(23) 4.3 RESULTS 4.3.1 DM vs non-DM During room air breathing, VE in DM rats was similar to that in non-DM rats (Table 1, Fig 1). During hypoxic exposure in the acute phase (after 4 min), VE response and VT / Ti, in DM rats has significantly decreased than non-DM rats (P<0.05) (Table 2, Fig 1). During hypoxic exposed late phase, VE in DM rats was not significantly different from that in non- DM rats (Table 3, Fig 1). The breathing frequency (f) and tidal volume (VT) were similar between DM and non-DM rats (Table 3, Fig 1). During hypercapnia exposure in the acute phase (after 4 min) and late phase (10 min), breathing frequence (f) and VE, in DM rats has significantly decreased than non-DM rats (P<0.05) (Table 5, Table 6, Fig 3, Fig7).. 4.4.2 GABAergic Modulation During the acute and late phase of the ventilatory response to hypoxia, non-DM rats injected with either control values or bicuculline had no change in any of the various parameters (f, VT , VE, Ti, Te, VT / Ti, PIF, PEF and EF50 ) (Table 2, Table 3, Fig 2). In contrast, during room air breathing, DM rats injected with either control values or bicuculline had no change in any of the various parameters (f, VT , VE, Ti, Te, VT / Ti, PIF, PEF and EF50 ) (Table 1, Fig 2). In contrast, DM rats exhibited an increased ventilation (VE), frequence (f) and mean inspiratory flow (VT / Ti) following bicuculline administration in acute hypoxic exposure(Table 2, Fig 2). During the late phase of the ventilatory response to hypoxia, DM rats injected with either control values or bicuculline had no change in any of the various parameters (f, VT , VE, Ti, Te, VT / Ti, PIF, PEF and EF50 ) (Table 3, Fig 2). GABAergic modulation in hypercapnia, DM and non-DM rats injected with either control values or bicuculline had no change in any of the various parameters (f, VT , VE, Ti, Te, VT / Ti, PIF, PEF and EF50 ) (Table 4, Table 5, Table 6, Fig 4). 17.
(24) 4.4.3 NMDA Modulation During the acute and late phase of the ventilatory response to hypoxia, non-DM rats injected with either control values or dextromethorphan had no change in any of the various parameters (f, VT and VE) (Table 8, Table 9, Fig 6). In contrast, during room air breathing, DM rats injected with either control values or dextromethorphan had no change in any of the various parameters (f, VT , VE, Ti, Te, VT / Ti, PIF, PEF and EF50 ) (Table 8, Table 9, Fig 8). In contrast, during acute hypoxic breathing, DM rats injected with either control values or bicuculline had no change in any of the various parameters (f, VT , VE, Ti, Te, VT / Ti, PIF, PEF and EF50 ). During the late phase of the ventilatory response to hypoxia, DM rats injected with either control values or dextromethorphan had no change in any of the various parameters (f, VT , VE, Ti, Te, VT / Ti, PIF, PEF and EF50 ) (Table8, Table9, Fig 6). NMDA modulation in hypercapnia DM and non-DM R rats injected with either control values or bicuculline had no change in any of the various parameters (f, VT , VE, Ti, Te, VT / Ti, PIF, PEF and EF50 ) (Fig 6, Table 2).. 18.
(25) Chapter 5 Discussion. 19.
(26) 5.5 DISCUSSION Our major findings: Our major findings can be summarized as follows: Part 1: 1) Antagonism of GABAA receptors does not change ventilation at rest or during ventilatory challenges in non-DM Wistar rats; 2) Breathing at rest in DM Wistar rats is modulated by endogenous GABA acting on GABAA receptors; 3) Ventilation during hypoxic, exposure is modulated by endogenous GABA acting on GABAA receptors in DM Wistar rats. Part 2, 1) Dextromethorphan administration does not alter resting ventilation in Non-DM or DM rats; 2) During the early phase of hypoxic exposure, ventilation appears to does not modulated by NMDA receptors in Non-DM or DM rats; 3) Ventilation during late phase hypoxic, it is not exposure for modulated by NMDA receptor antagonism in DM Wistar rats.. GABA modulation of Ventilation in DM GABA is the major inhibitory neurotransmitter in the mammalian central nervous system (CNS) and acts at approximately 25-40% of the synapses within the CNS (7). GABA can exert its effect via either ionotropic (GABAA and GABAC) receptors to produce fast synaptic inhibition, or metabotropic (GABAB) receptors to produce slow, prolonged inhibitory signals(8) . GABA may be involved as a neurotransmitter in the generation, the transmission, and the modulation of respiratory related neural activities (22-24, 28, 30). In the present study, bicuculline, a selective antagonist of GABAA receptors, was chosen because previous studies have shown that GABA inhibits respiratory activity mainly via GABAA receptors(22). In GABAergic neurons, GABAA receptors facilitate Cl- flux into neurons, resulting in hyperpolization, whereas antagonism of GABAA receptors by bicuculline will decrease Cl- flux, resulting in depolarization and increased excitation (8, 28). Thus, any effect noted in the present study is restricted to a modulatory role exerted by endogenous GABA acting specifically on GABAA receptors. GABAA receptors are located throughout the neural axis and modulate 20.
(27) numerous systems. In the present study, bicuculline was injected systemically, which consequently produced a widespread antagonistic action. Thus, any effect noted herein cannot be localized to any specific system or brain region. The goal of the present study, however, was to determine whether GABAergic mechanisms regulate ventilationv at acute hypoxia in DM Wistar rats. Clearly, additional experiments using a reductionist approach will be required in order to specifically identify those brain areas that are directly responsible. In non-DM rats, bicuculline administration did not alter resting ventilation, ventilation during hypoxic exposure. Indeed, in normal human subjects, increasing brain GABA concentration by vigabatrin administration, an agent which prevents the breakdown of GABA, had no effects on resting ventilation or on chemical ventilatory drive (17). Thus, consistent with the human literature, GABA does not exert a significant effect on the control of respiration in normal rats. In contrast, bicuculline administration elevated resting ventilation, ventilation during hypoxic exposure in age-matched DM Wistar rats. Following 8 weeks of chronic artificial respiratory loading in rats, brain GABA levels are increased and responsible for depressing ventilation (44). Thus, the increased chest wall loading or the airway narrowing that is present in diabetes (15) may represent a possible stimulus responsible for the altered GABAergic mechanisms. In the present study, bicuculline administration significantly increased resting ventilation in DM rats, which was attributed to an increase in tidal volume and not breathing frequency. The selective effect on tidal volume is consistent with previous reports indicating that direct exogenous central administration of GABA or GABAA receptor agonist produces a dose-dependent depression in respiratory amplitude with only minor effects noted on respiratory frequency (26, 30). During hypoxia, the respiratory drive is determined by a balance between the stimulation of peripheral chemoreceptors and the central depression of hypoxia on respiration (49). It has been postulated that the late phase of the ventilatory response to hypoxia is modulated by a variety of neurotransmitters, including GABA (28, 49). Brain GABA content is elevated during hypoxic(57) and hypercapnic exposures (25, 30). The rise in 21.
(28) ventilation following treatment with bicuculline during hypoxia is consistent with previous studies in either anesthetized cats (37), in sedated newborn piglets (26), or in anesthetized rats (49).. NMDA modulation of Ventilation in DM Glutamate, an excitatory neurotransmitter, has an important role in the central mechanisms of respiratory control(28).The NMDA receptor family has been extensively studied due to their pivotal roles in regulating synaptic plasticity, learning, psychosis and cell death in various neuropathological conditions(10, 34, 39). NMDA receptors are ligand-gated ion channels, or ionotropic receptors, that allow the transmembrane flux of Na+, K+ and Ca++ ions after the binding of glutamate and glycine to their respective binding sites on the NMDA receptor complex. NMDA receptors exist as heteromeric tetramers and are thought to be most commonly composed of two NR1 subunits and two NR2 subunits(40). In previous experiments, insulin was shown to significantly increase native NMDA receptor activity in rat hippocampus and recombinant receptors expressed in Xenopus oocytes (9, 35). This increase in activity is due to a rapid insulin-induced increase in the surface expression of NMDA receptors from intracellular pools (48). These observations suggest that in diabetes there may be a reduced cell surface expression of NMDA receptors. Such a reduced expression could underlie some of the adverse effects of diabetes in the CNS. Presently, using rats made diabetic by streptozotocin (STZ) administration, reduction of [3H]-AMPA binding varied in different brain structures, being more pronounced in the striatum, cerebral cortex, and hippocampus and almost absent in the cerebellum. It has reported that there is no effect on brain NMDA receptor levels when measured in horizontal sections of ventral brain by NMDA sensitive L-[3H]glutamate binding site autoradiography. The effect of STZ-induced diabetes appeared to be specific to the AMPA subtype of glutamate receptors, as the same treatment did not modify L-[3H]glutamate binding to NMDA receptors(19). 22.
(29) The primary purpose of the current study, however, was to assess the role of NMDA receptors in modulating ventilation. The non DM and DM rats were used as their own control such that weight differences between both phenotypes cannot account for our finding in NMDA receptormediated modulation. Dextromethorphan administration had no effects at rest in both non DM and DM rats. No finding in NMDA modualtion of ventilatory response to hypoxia and hypercapnia. In under the hypoxia and hypercapnia environment, as if is comes from regarding the ventilatory response influence is the elsewhere function no by the NMDA modualtion means. Possibly is change NMDA receptors which causes of diabetes. But was about the reason not to be still clear.. Significance: When stay on acute hypoxia situation in general person have promptly responses to modulate avoid to dsmage. In the diabetes mellitus, they cannot promptly to modulated for hypoxia. That was to deepen on sleep apnea episode damage for apparatus. In the present study, humans and animals have demonstrated that intermittent hypoxia and reduced sleep duration due to sleep fragmentation, as occur in obstructive sleep apnea, exert adverse effects on glucose metabolism(27). Blunted ventilatory responses to acute hypoxia in diabetes mellitus appeared to be suppressed by endogenous GABA by acting specifically on GABAA receptors. Altered GABAergic modulation of acute ventilatory response in diabetes might potentially impact sleep apnea episode (acute hypoxia) related ventilatory compensation.. 23.
(30) Table and Figure. Table 1. Ventilatory parameters in non-DM and DM rats treated with vehicle or bicuculline on hypoxia resting time. 24.
(31) Hypoxia Body Weight, g BG mg/dl. Non-DM rats. DM rats. 476.3969.23. 387.6375.89. 777.19. 433.6990.30. Resting. Vehicle. Bicucuclline. Vehicle. Bicuculline. f, breaths/min. 93.75±6.27. 90.25±6.09. 75.98±3.84. 97.01±4.49. VT, ml. 2.71±0.04. 2.64±0.22. 2.93±0.09. 2.93±0.10. VE, ml/min. 245.95±11.09. 235.31±6.29. 216.90±15.95. 245.02±14.48. Ti, sec. 0.25±0.01. 0.23±0.00. 0.32±0.00. 0.28±0.00. Te, sec. 0.46±0.03. 0.50±0.03. 0.52±0.02. 0.49±0.00. PIF, ml/sec. 18.13±0.81. 18.23±1.07. 14.62±0.57. 17.88±1.16. PEF, ml/sec. 13.43±0.22. 12.83±0.42. 12.71±1.60. 16.81±0.74. EF50, ml/sec. 0.73±0.07. 0.64±0.02. 0.67±0.14. 0.76±0.05. VT /Ti. 11.05±0.47. 11.26±0.83. 9.19±0.28. 10.44±0.21. Non-DM rats = non- diabetes mellitus rats, DM rats = diabetes mellitus rats, BG = blood glucose, f = Frequency, TV =Tidal Volume, VE=Minute Volume, Ti = Inspiratory Time, Te = Expiratory Time, PIF = Peak Inspiratory Flow, PEF = Peak Expiratory Flow, EF50 = The flow at the point 50% of TV is expired, VT /Ti = mean inspiratory flow. Values are means SD (n=8). *P<0.05 DM with Non DM vehicle to compare have a significant difference. #P<0.05Non DM vehicle and bicuculline to compare have a significant difference. +P<0.05 DM vehicle and bicuculline to compare have a significant difference.. 25.
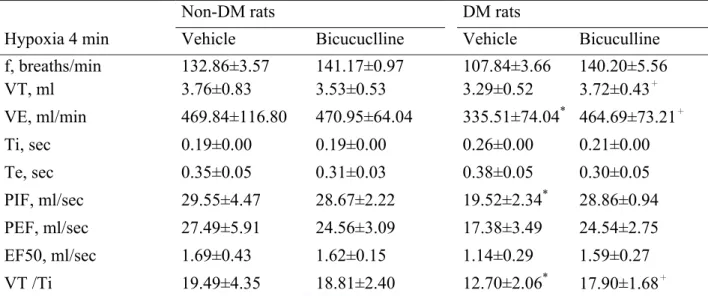
(32) Table 2. Ventilatory parameters in non-DM and DM rats treated with vehicle or bicuculline on hypoxia 4 min. Non-DM rats DM rats Hypoxia 4 min. Vehicle. Bicucuclline. Vehicle. Bicuculline. f, breaths/min VT, ml. 132.86±3.57 3.76±0.83. 141.17±0.97 3.53±0.53. 107.84±3.66 3.29±0.52. 140.20±5.56 3.72±0.43+. VE, ml/min. 469.84±116.80. 470.95±64.04. 335.51±74.04* 464.69±73.21+. Ti, sec. 0.19±0.00. 0.19±0.00. 0.26±0.00. 0.21±0.00. Te, sec. 0.35±0.05. 0.31±0.03. 0.38±0.05. 0.30±0.05. PIF, ml/sec. 29.55±4.47. 28.67±2.22. 19.52±2.34*. 28.86±0.94. PEF, ml/sec. 27.49±5.91. 24.56±3.09. 17.38±3.49. 24.54±2.75. EF50, ml/sec. 1.69±0.43. 1.62±0.15. 1.14±0.29. VT /Ti. 19.49±4.35. 18.81±2.40. 12.70±2.06. 1.59±0.27 *. 17.90±1.68+. Non-DM rats = non- diabetes mellitus rats, DM rats = diabetes mellitus rats, f = Frequency, TV =Tidal Volume, VE=Minute Volume, Ti = Inspiratory Time, Te = Expiratory Time, PIF = Peak Inspiratory Flow, PEF = Peak Expiratory Flow, EF50 = The flow at the point 50% of TV is expired, VT /Ti = mean inspiratory flow. Values are means SD (n=8). *P<0.05 DM with Non DM vehicle to compare have a significant difference. #P<0.05Non DM vehicle and bicuculline to compare have a significant difference. +P<0.05 DM vehicle and bicuculline to compare have a significant difference.. 26.
(33) Table 3. Ventilatory parameters in non-DM and DM rats treated with vehicle or bicuculline on. hypoxia 30 min Non-DM rats. DM rats. Hypoxia 30 min. Vehicle. Bicucuclline. Vehicle. Bicuculline. f, breaths/min VT, ml. 140.75±3.12 3.00±0.03. 154.13±3.10 2.71±0.04. 126.59±2.87 2.91±0.04. 116.62±1.65 3.21±0.04. VE, ml/min. 402.17±0.68. 397.64±3.19. 357.78±5.37. 363.10±1.91. Ti, sec. 0.19±0.00. 0.17±0.00. 0.21±0.00. 0.21±0.00. Te, sec. 0.27±0.01. 0.25±0.01. 0.30±0.01. 0.33±0.01. PIF, ml/sec. 22.51±0.34. 22.00±0.12. 19.43±0.06. 20.80±0.11. PEF, ml/sec. 20.41±0.18. 21.36±0.06. 16.83±0.14. 17.79±0.55. EF50, ml/sec. 1.31±0.02. 1.26±0.03. 1.15±0.04. 1.09±0.02. VT /Ti. 15.92±0.02. 15.89±0.07. 13.94±0.00. 14.97±0.07. Non-DM rats = non- diabetes mellitus rats, DM rats = diabetes mellitus rats, f = Frequency, TV =Tidal Volume, VE=Minute Volume, Ti = Inspiratory Time, Te = Expiratory Time, PIF = Peak Inspiratory Flow, PEF = Peak Expiratory Flow, EF50 = The flow at the point 50% of TV is expired, VT /Ti = mean inspiratory flow. Values are means SD (n=8). *P<0.05 DM with Non DM vehicle to compare have a significant difference. #P<0.05Non DM vehicle and bicuculline to compare have a significant difference. +P<0.05 DM vehicle and bicuculline to compare have a significant difference.. 27.
(34) Table 4. Ventilatory parameters in non-DM and DM rats treated with vehicle or bicuculline on hypercapnic resting time. Hypercapnic Non-DM rats DM rats Resting. Vehicle. Bicucuclline. Vehicle. Bicuculline. f, breaths/min. 83.36±5.40. 89.24±1.45. 66.05±2.31. 71.28±11.09. VT, ml. 2.93±0.20. 2.41±0.04. 2.84±0.01. 3.10±0.02. VE, ml/min. 251.00±46.50. 205.74±1.92. 183.65±5.38. 225.07±42.63. Ti, sec. 0.28±0.00. 0.24±0.00. 0.32±0.01. 0.33±0.01. Te, sec. 0.52±0.04. 0.56±0.00. 0.62±0.02. 0.61±0.06. PIF, ml/sec. 16.74±1.75. 16.29±0.05. 13.58±0.29. 15.21±1.44. PEF, ml/sec. 14.38±1.59. 12.11±0.18. 11.52±0.03. 13.08±2.10. EF50, ml/sec. 0.77±0.15. 0.54±0.02. 0.51±0.03. 0.69±0.24. VT /Ti. 10.41±0.77. 9.99±0.04. 9.99±0.04. 9.45±0.42. Non-DM rats = non- diabetes mellitus rats, DM rats = diabetes mellitus rats, f = Frequency, TV =Tidal Volume, VE=Minute Volume, Ti = Inspiratory Time, Te = Expiratory Time, PIF = Peak Inspiratory Flow, PEF = Peak Expiratory Flow, EF50 = The flow at the point 50% of TV is expired, VT /Ti = mean inspiratory flow. Values are means SD (n=8). *P<0.05 DM with Non DM vehicle to compare have a significant difference. #P<0.05Non DM vehicle and bicuculline to compare have a significant difference. +P<0.05 DM vehicle and bicuculline to compare have a significant difference.. 28.
(35) Table 5. Ventilatory parameters in non-DM and DM rats treated with vehicle or bicuculline on hypercapnic 15 min. Non-DM rats DM rats Hypercapnic 15 min. Vehicle. Bicucuclline. Vehicle. Bicuculline. f, breaths/min. 132.74±2.58. 146.95±3.00. 120.69±0.40. 127.42±0.48. VT, ml. 5.06±0.05. 4.44±0.10. 4.63±0.08. 4.90±0.05. VE, ml/min. 660.84±14.53. 637.29±1.16. 551.48±8.19. 625.97±4.87. Ti, sec. 0.22±0.00. 0.20±0.00. 0.24±0.00. 0.23±0.00. Te, sec. 0.25±0.01. 0.22±0.00. 0.27±0.00. 0.25±0.00. PIF, ml/sec. 30.82±0.76. 29.82±0.62. 25.69±0.45. 28.87±0.36. PEF, ml/sec. 42.73±1.10. 41.65±0.99. 35.78±0.22. 39.75±0.06. EF50, ml/sec. 2.49±0.13. 2.52±0.03. 2.25±0.01. 2.55±0.03. VT /Ti. 22.65±0.59. 21.69±0.05. 21.69±0.05. 20.90±0.09. Non-DM rats = non- diabetes mellitus rats, DM rats = diabetes mellitus rats, f = Frequency, TV =Tidal Volume, VE=Minute Volume, Ti = Inspiratory Time, Te = Expiratory Time, PIF = Peak Inspiratory Flow, PEF = Peak Expiratory Flow, EF50 = The flow at the point 50% of TV is expired, VT /Ti = mean inspiratory flow. Values are means SD (n=8). *P<0.05 DM with Non DM vehicle to compare have a significant difference. #P<0.05Non DM vechicle and bicuculline to compare have a significant difference. +P<0.05 DM vechicle and bicuculline to compare have a significant difference.. Fig 1. DM and Non DM rats for hypoxia. 29.
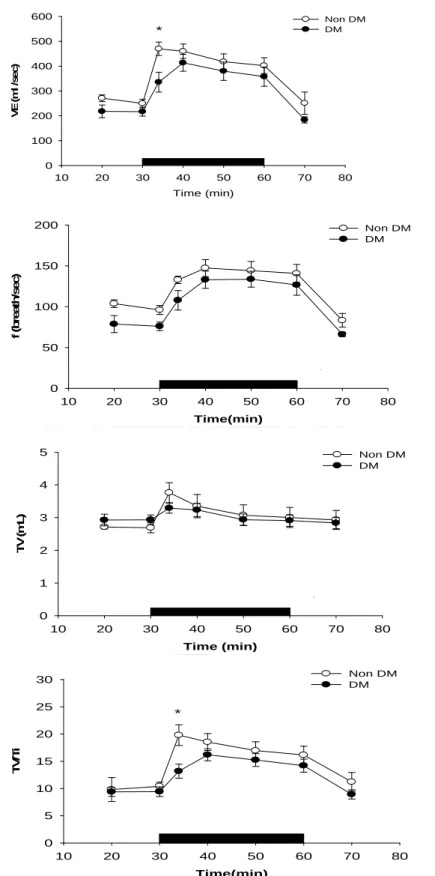
(36) 600. Non DM DM. * VE(ml /sec). 500 400 300 200 100 0 10. 20. 30. 40. 50. 60. 70. 80. Time (min). 200. Non DM DM. f (breath/sec). 150. 100. 50. 0 10. 20. 30. 40. 50. 60. 70. 80. Time(min). 5. Non DM DM. TV(mL). 4 3 2 1 0 10. 20. 30. 40. 50. 60. 70. 80. Time (min) Non DM DM. 30 25. *. TV/Ti. 20 15 10 5 0 10. 20. 30. 40. 50. 60. 70. 80. Time(min). Fig. 1. The ventilation(VE), tidal volume(TV), breathing frequency(f) and TV/Ti of non-DM (vacant circular) and DM (full circular) rats during room air and during 10% O2 hypoxic exposure(black bar). *p <0.05 indicates a significant difference from the value of vehicle at the same time-point. Values represent mean ± SDE. 30.
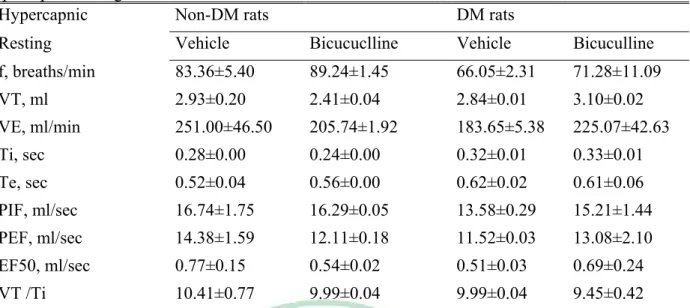
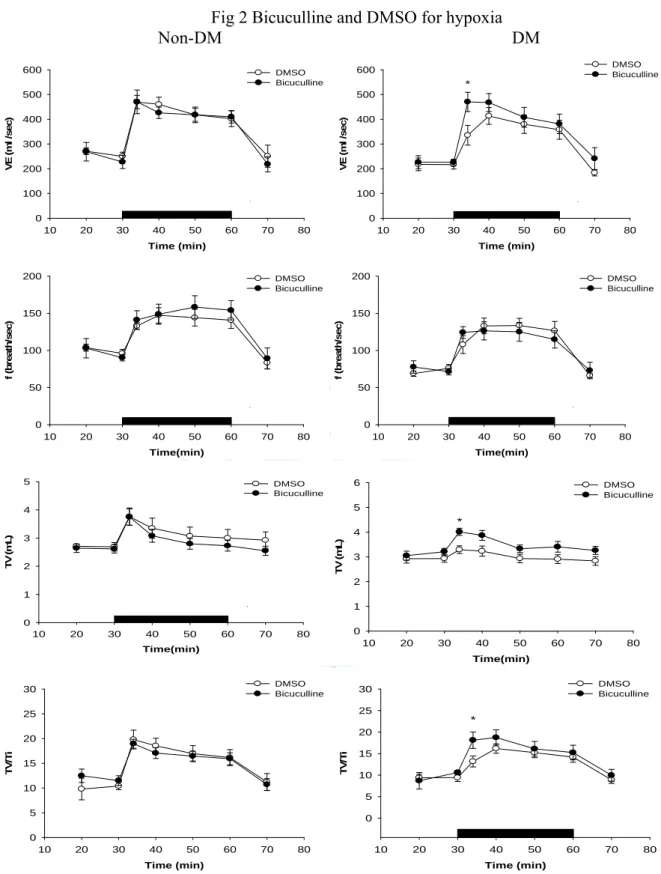
(37) Fig 2 Bicuculline and DMSO for hypoxia Non-DM DM *. 500. 500. 400. 400. 300 200. DMSO Bicuculline. 600. DMSO Bicuculline. VE (ml /sec). VE (ml /sec). 600. 300 200. 100. 100. 0. 0 10. 20. 30. 40. 50. 60. 70. 80. 10. 20. 30. 40. Time (min) 200. 60. 70. 200. DMSO Bicuculline. 80. DMSO Bicuculline. 150 f (breath/sec). 150 f (breath/sec). 50. Time (min). 100. 100. 50. 50. 0. 0 10. 20. 30. 40. 50. 60. 70. 80. 10. 20. 30. 40. Time(min). 50. 60. 70. 80. Time(min). 5. 6. DMSO Bicuculline. DMSO Bicuculline. 5. 4. TV (mL). TV (mL). * 4. 3 2. 3 2. 1. 1 0 10. 20. 30. 40. 50. 60. 70. 0. 80. 10. Time(min). 20. 30. 40. 50. 60. 70. 80. Time(min) DMSO Bicuculline. 30. 25. 25. * 20 TV/Ti. 20 TV/Ti. DMSO Bicuculline. 30. 15. 15 10. 10. 5. 5. 0. 0 10. 20. 30. 40. 50. 60. 70. 80. 10. Time (min). 20. 30. 40. 50. 60. 70. 80. Time (min). Fig. 2. The effects of vehicle (vacant circular) and bicuculline (full circular)administration on ventilation(VE), tidal volume(TV), breathing frequency(f) and TV/Ti of non-DM and DM rats during room air and during 10% O2 hypoxic exposure(black bar). *p<0.05 indicates a significant difference from the value of vehicle, bicuculline, at the same time-point. Values represent mean ± SDE.. 31.
(38) Fig.3 DM and Non DM rats for hypercapnic Non DM DM. 800. VE(m L/sec). 600. 400. 200. 0 0. 5. 10. 15. 20. 25. 30. Time(min) Non DM DM. 160 140 f (breath/sec). 120 100 80 60 40 20 0 0. 5. 10. 15. 20. 25. 30. Time (min) Non DM DM. 6 5. TV(mL). 4 3 2 1 0 0. 5. 10. 15. 20. 25. 30. Time (min) 30. Non DM DM. 25. TV/Ti. 20 15 10 5 0 0. 5. 10. 15. 20. 25. 30. Time (min). Fig. 3. The ventilation(VE), tidal volume(TV), breathing frequency(f) and TV/Ti of non-DM (vacant circular) and DM (full circular) rats during room air and during 8% CO2 hypercapnic exposure(black bar). *p <0.05 indicates a significant difference from the value of vehicle, at the same time-point. Values represent mean ± SDE. 32.
(39) Fig 4. Bicuculline and DMSO for hypercapnic Non-DM DM DMSO Bicuculline. 800. 800. 600 VE(mL/sec). VE(mL/sec). 600. DMSO Bicuculline. 400. 200. 400. 200. 0. 0 0. 5. 10. 15. 20. 25. 30. 0. 5. 10. Time (min) DMSO Bicuculline. 140. 140. 120. 120 100. 25. 30. DMSO Bicuculline. 80 60. 100 80 60. 40. 40. 20. 20. 0. 0 0. 5. 10. 15. 20. 25. 30. 0. 5. 10. Time (min). 15. 20. 25. 30. Time(min) DMSO Bicuculline. 6. 6. 5. 5. 4. 4 TV (mL). TV (mL). 20. 160. 160 f (breath/sec). f (breath/sec). 180. 3. DMSO Bicuculline. 3. 2. 2. 1. 1. 0. 0 0. 5. 10. 15. 20. 25. 30. 0. 5. 10. Time(min). 15. 20. 25. 30. Time (min). 30. 30. DMSO Bicuculline. 25. 25. 20. 20 TV/Ti. TV/Ti. 15 Time(min). 15. 15. 10. 10. 5. 5. 0. DMSO Bicuculline. 0 0. 5. 10. 15. 20. 25. 30. 0. Time (min). 5. 10. 15. 20. 25. 30. Time(min). Fig. 4. The effects of vehicle (vacant circular) and bicuculline (full circular)administration on ventilation(VE), tidal volume(TV), breathing frequency(f) and TV/Ti of non-DM and DM rats during room air and during 8% CO2 hypercapnic exposure(black bar). *p<0.05 indicates a significant difference from the value of vehicle, bicuculline, at the same time-point. Values represent mean ± SDE.. 33.
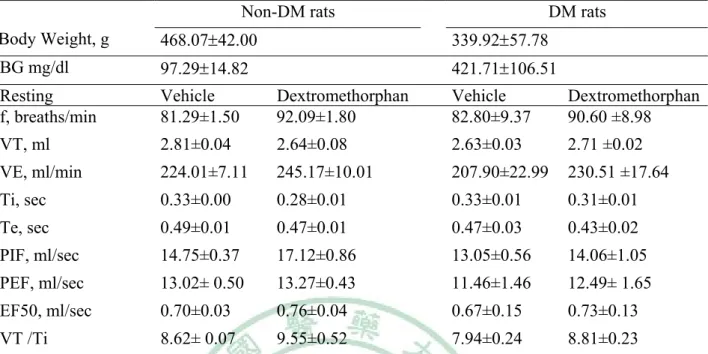
(40) Table 6. Ventilatory parameters in non-DM and DM rats treated with vehicle or dextromethorphan on hypoxia resting time. Non-DM rats DM rats Body Weight, g. 468.0742.00. 339.9257.78. BG mg/dl. 97.2914.82. 421.71106.51. Resting f, breaths/min. Vehicle 81.29±1.50. Dextromethorphan 92.09±1.80. Vehicle 82.80±9.37. Dextromethorphan 90.60 ±8.98. VT, ml. 2.81±0.04. 2.64±0.08. 2.63±0.03. 2.71 ±0.02. VE, ml/min. 224.01±7.11. 245.17±10.01. 207.90±22.99. 230.51 ±17.64. Ti, sec. 0.33±0.00. 0.28±0.01. 0.33±0.01. 0.31±0.01. Te, sec. 0.49±0.01. 0.47±0.01. 0.47±0.03. 0.43±0.02. PIF, ml/sec. 14.75±0.37. 17.12±0.86. 13.05±0.56. 14.06±1.05. PEF, ml/sec. 13.02± 0.50. 13.27±0.43. 11.46±1.46. 12.49± 1.65. EF50, ml/sec. 0.70±0.03. 0.76±0.04. 0.67±0.15. 0.73±0.13. VT /Ti. 8.62± 0.07. 9.55±0.52. 7.94±0.24. 8.81±0.23. Non-DM rats = non- diabetes mellitus rats, DM rats = diabetes mellitus rats, BG = blood glucose, f = Frequency, TV =Tidal Volume, VE=Minute Volume, Ti = Inspiratory Time, Te = Expiratory Time, PIF = Peak Inspiratory Flow, PEF = Peak Expiratory Flow, EF50 = The flow at the point 50% of TV is expired, VT /Ti = mean inspiratory flow. Values are means SD (n=14). *P<0.05 DM with Non DM vehicle to compare have a significant difference. #P<0.05Non DM Saline and dextromethorphan to compare have a significant difference. +P<0.05 DM Saline and dextromethorphan to compare have a significant difference. 34.
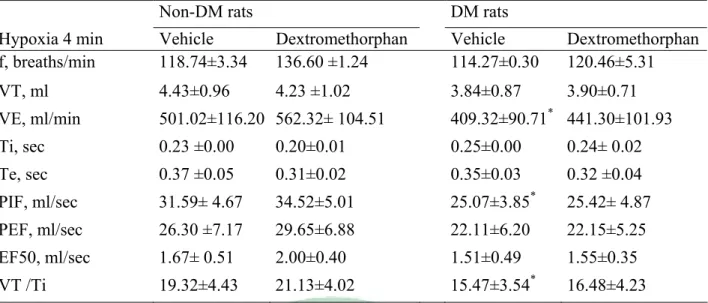
(41) Table 7. Ventilatory parameters in non-DM and DM rats treated with vehicle or dextromethorphan on hypoxia 4 min. Non-DM rats DM rats Hypoxia 4 min f, breaths/min. Vehicle 118.74±3.34. Dextromethorphan 136.60 ±1.24. Vehicle 114.27±0.30. VT, ml. 4.43±0.96. 4.23 ±1.02. 3.84±0.87. Dextromethorphan 120.46±5.31 3.90±0.71. VE, ml/min. 501.02±116.20 562.32± 104.51. 409.32±90.71. Ti, sec. 0.23 ±0.00. 0.20±0.01. 0.25±0.00. Te, sec. 0.37 ±0.05. 0.31±0.02. 0.35±0.03. *. 441.30±101.93 0.24± 0.02 0.32 ±0.04. *. PIF, ml/sec. 31.59± 4.67. 34.52±5.01. 25.07±3.85. PEF, ml/sec. 26.30 ±7.17. 29.65±6.88. 22.11±6.20. 22.15±5.25. EF50, ml/sec. 1.67± 0.51. 2.00±0.40. 1.51±0.49. 1.55±0.35. VT /Ti. 19.32±4.43. 21.13±4.02. 15.47±3.54*. 16.48±4.23. 25.42± 4.87. Non-DM rats = non- diabetes mellitus rats, DM rats = diabetes mellitus rats, f = Frequency, TV =Tidal Volume, VE=Minute Volume, Ti = Inspiratory Time, Te = Expiratory Time, PIF = Peak Inspiratory Flow, PEF = Peak Expiratory Flow, EF50 = The flow at the point 50% of TV is expired, VT /Ti = mean inspiratory flow. Values are means SD (n=14). *P<0.05 DM with Non DM vehicle to compare have a significant difference. #P<0.05Non DM Saline and dextromethorphan to compare have a significant difference. +P<0.05 DM Saline and dextromethorphan to compare have a significant difference.. 35.
(42) Table 8. Ventilatory parameters in non-DM and DM rats treated with vehicle or dextromethorphan on hypoxia 30 min. Non-DM rats DM rats Hypoxia 30 min. Vehicle. Dextromethorphan. Vehicle. Dextromethorphan. f, breaths/min. 138.71± 3.70. 123.20 ±1.18. 120.92±2.16. 129.17±0.27. VT, ml. 3.01±0.08. 3.30 ±0.09. 2.91±0.01. 3.15± 0.05. VE, ml/min. 399.82 ±5.21. 395.20± 5.57. 340.50±4.63. 379.70± 4.87. Ti, sec. 0.19±0.01. 0.20 ±0.00. 0.22±0.00. 0.21± 0.00. Te, sec. 0.27±0.01. 0.32 ±0.01. 0.30±0.01. 0.28 ±0.00. PIF, ml/sec. 22.42± 0.11. 23.38 ±0.43. 18.41±0.12. 20.25± 0.24. PEF, ml/sec. 18.90±0.15. 19.12± 0.21. 16.08±0.49. 16.94 ±0.31. EF50, ml/sec. 1.38 ±0.03. 1.14± 0.00. 1.16±0.04. 1.25 ±0.01. VT /Ti. 15.79± 0.05. 16.81± 0.45. 13.01±0.00. 14.78±0.14. Non-DM rats = non- diabetes mellitus rats, DM rats = diabetes mellitus rats, f = Frequency, TV =Tidal Volume, VE=Minute Volume, Ti = Inspiratory Time, Te = Expiratory Time, PIF = Peak Inspiratory Flow, PEF = Peak Expiratory Flow, EF50 = The flow at the point 50% of TV is expired, VT /Ti = mean inspiratory flow. Values are means SD (n=14). *P<0.05 DM with Non DM vehicle to compare have a significant difference. #P<0.05 Non DM Saline and dextromethorphan to compare have a significant difference. +P<0.05 DM Saline and dextromethorphan to compare have a significant difference.. 36.
(43) Table 9. Ventilatory parameters in non-DM and DM rats treated with vehicle or dextromethorphan on hypercapnic resting time. Hypercapnic Non-DM rats DM rats Resting. Vehicle. Dextromethorphan. Vehicle. Dextromethorphan. f, breaths/min. 66.19±2.64. 82.94±0.42. 68.49± 2.30. 76.70± 2.81. VT, ml. 2.79± 0.01. 2.72 ±0.03. 2.60±0.07. 2.75±0.02. VE, ml/min. 183.53±8.88. 226.94±6.17. 174.08± 1.33. 201.43±6.28. Ti, sec. 0.35 ±0.01. 0.28±0.00. 0.36± 0.01. 0.34 ±0.00. Te, sec. 0.59±0.02. 0.52± 0.01. 0.56 ±0.02. 0.49±0.03. PIF, ml/sec. 12.80± 0.69. 16.85± 0.37. 11.33 ±0.13. 12.46± 0.18. PEF, ml/sec. 11.12±0.58. 12.93 ±0.54. 9.76± 0.06. 11.22± 0.19. EF50, ml/sec. 0.53±0.06. 0.63± 0.03. 0.50±0.00. 0.61±0.04. VT /Ti. 7.96 0.21. 9.61 ±0.07. 7.26 ±0.05. 8.18±0.11. Non-DM rats = non- diabetes mellitus rats, DM rats = diabetes mellitus rats, f = Frequency, TV =Tidal Volume, VE=Minute Volume, Ti = Inspiratory Time, Te = Expiratory Time, PIF = Peak Inspiratory Flow, PEF = Peak Expiratory Flow, EF50 = The flow at the point 50% of TV is expired, VT /Ti = mean inspiratory flow. Values are means SD (n=14). *P<0.05 DM with Non DM vehicle to compare have a significant difference. #P<0.05 Non DM Saline and dextromethorphan to compare have a significant difference. +P<0.05 DM Saline and dextromethorphan to compare have a significant difference.. 37.
(44) Table 10. Ventilatory parameters in non-DM and DM rats treated with vehicle or dextromethorphan on hypercapnic 15 min. Non-DM rats DM rats Hypercapnic 15 min. Vehicle. Dextromethorphan. Vehicle. Dextromethorphan. f, breaths/min. 137.71± 2.31. 144.29± 0.83. 121.93± 1.41. 127.53±4.20. VT, ml. 5.51 ±0.12. 5.69± 0.02. 5.03± 0.03. 5.42±0.07. VE, ml/min. 744.96±1.09. 812.32±7.38. 600.16±3.62. 678.18±14.02. Ti, sec. 0.24±0.00. 0.22± 0.01. 0.25±0.00. 0.24 ±0.01. Te, sec. 0.22± 0.00. 0.21 ±0.00. 0.26± 0.01. 0.24±0.01. PIF, ml/sec. 32.52± 0.21. 36.24± 0.33. 26.56± 0.25. 29.89±0.36+. PEF, ml/sec. 51.80 ±0.28. 50.84± 0.01. 36.25±0.54. 41.46± 0.83+. EF50, ml/sec. 3.55± 0.02. 3.59± 0.11. 2.48± 0.08. 2.80±0.14. VT /Ti. 23.43±0.03. 26.28±0.56. 19.92± 0.06. 22.80±0.19+. Non-DM rats = non- diabetes mellitus rats, DM rats = diabetes mellitus rats, f = Frequency, TV =Tidal Volume, VE=Minute Volume, Ti = Inspiratory Time, Te = Expiratory Time, PIF = Peak Inspiratory Flow, PEF = Peak Expiratory Flow, EF50 = The flow at the point 50% of TV is expired, VT /Ti = mean inspiratory flow. Values are means SD (n=14). *P<0.05 DM with Non DM vehicle to compare have a significant difference. #P<0.05 Non DM Saline and dextromethorphan to compare have a significant difference. +P<0.05 DM Saline and dextromethorphan to compare have a significant differenc. Fig 5. DM and Non DM rats for hypoxia. 38.
(45) Non DM DM. VE(ml /sec). 600. *. 400. 200. 0 10. 20. 30. 40. 50. 60. 70. 80. Time (min) 180. Non DM DM. 160 f (breath/sec). 140 120 100 80 60 40 20 0 10. 20. 30. 40. 50. 60. 70. 80. Time (min). 6. Non DM DM. 5. TV(mL). 4 3 2 1 0 10. 20. 30. 40. 50. 60. 70. 80. Time (min) 25. Non DM DM. *. TV/Ti. 20 15 10 5 0 10. 20. 30. 40. 50. 60. 70. 80. Time(min). Fig. 5. The ventilation(VE), tidal volume(TV), breathing frequency(f) and TV/Ti of non-DM (vacant circular) and DM (full circular) rats during room air and during 10% O2 hypoxic exposure (black bar). *p <0.05 indicates a significant difference from the value of vehicle at the same time-point. Values represent mean ± SDE. Fig 6. DxM and saline for hypoxia 39.
(46) Non-DM. DM. 700. 600. Saline DxM. Saline DxM. 500. 500. VE (ml /sec). VE (ml /sec). 600. 400 300 200. 400 300 200 100. 100. 0. 0 10. 20. 30. 40. 50. 60. 70. 10. 80. 20. 30. 180. *. *. 70. 80. Saline DxM. 140 f (breath/sec). f (breath/sec). 60. 160. 140 120 100 80 60. 120 100 80 60. 40. 40. 20. 20. 0. 0 10. 20. 30. 40. 50. 60. 70. 80. 10. 20. 30. Time (min). 40. 50. 60. 70. 80. Time (min). 6. 6. Saline DxM. 5. 5. 4. 4 TV (mL). TV (mL). 50. 180. Saline DxM. 160. 40. Time (min). Time (min). 3. 3. 2. 2. 1. 1. 0. Saline DxM. 0 10. 20. 30. 40. 50. 60. 70. 80. 10. 20. 30. Time (min). 40. 50. 60. 70. 80. Time (min). 25. 30. Saline DxM. Saline DxM. 25. 20. TV/Ti. TV/Ti. 20 15 10. 15 10. 5. 5. 0. 0 10. 20. 30. 40. 50. 60. 70. 80. 10. Time (min). 20. 30. 40. 50. 60. 70. 80. Time (min). Fig. 6. The effects of vehicle (vacant circular) and dextromethorphan (full circular)administration on ventilation(VE), tidal volume(TV), breathing frequency(f) and TV/Ti of non-DM and DM rats during room air and during 10% O2 hypoxic exposure (black bar). *p<0.05 indicates a significant difference from the value of vehicle at the same time-point. Values represent mean ± SD 40.
(47) Fig. 7 DM and Non DM rats for hypercapnic Non DM DM. 1000. VE(ml /sec). 800 600 400 200 0 0. 5. 10. 15. 20. 25. 30. Time (min). Non DM DM. 1000. VE(ml /sec). 800 600 400 200 0 0. 5. 10. 15. 20. 25. 30. Time (min). Non DM DM. 6 5. TV(m L). 4 3 2 1 0 0. 5. 10. 15. 20. 25. 30. Time (min). Non DM DM. 30. 25. TV/Ti. 20. 15. 10. 5. 0 0. 5. 10. 15. 20. 25. 30. Time (min). Fig. 7. The ventilation(VE), tidal volume(TV), breathing frequency(f) and TV/Ti of non-DM (vacant circular) and DM (full circular) rats during room air and during 10% O2 hypoxic exposure (black bar). *p <0.05 indicates a significant difference from the value of vehicle, saline, at the same time-point. Values represent mean ± SD. 41.
(48) Fig 8. Dextromethorphan and saline for hypercapnic Non-DM DM Saline DxM. Saline DxM. 800. 800. VE (ml /sec). VE (ml /sec). 600 600. 400. 400. 200. 200. 0. 0 0. 5. 10. 15. 20. 25. 30. 0. 5. 10. Time (min). 180. 20. 25. 30. 180. Saline DxM. 160. Saline DxM. 160. 140. 140 f (breath/sec). f (breath/sec). 15 Time (min). 120 100 80 60. 120 100 80 60. 40. 40. 20. 20. 0. 0. 0. 5. 10. 15. 20. 25. 30. 0. 5. 10. Time (min). 15. 20. 25. Saline. Saline DxM. DxM 6. TV (mL). VE (ml /sec). 6. 4. 4. 2. 2. 0. 0. 0. 5. 10. 15. 20. 25. 30. 0. 5. 10. Time (min). 15. 20. 25. 30. Time (min). Saline DxM. 30 25. 25. 20. 20. 15. Saline DxM. 30. TV/Ti. TV/Ti. 30. Time (min). 15. 10. 10. 5. 5 0. 0 0. 5. 10. 15 Time (min). 20. 25. 30. 0. 5. 10. 15. 20. 25. 30. Time (min). Fig. 8. The effects of vehicle (vacant circular) and dextromethorphan (full circular)administration on ventilation(VE), tidal volume(TV), breathing frequency(f) and TV/Ti of non-DM and DM rats during room air and during 8% CO2 hypercapnic exposure (black bar). *p<0.05 indicates a significant difference from the value of vehicle, saline, at the same time-point. Values represent mean ± SD. 42.
(49) Chapter 6. Reference. 43.
(50) Reference 1. Adeghate E, and Ponery AS. GABA in the endocrine pancreas: cellular localization and function in normal and diabetic rats. Tissue Cell 34: 1-6, 2002. 2. Baba M, and Ozaki I. Electrophysiological changes in diabetic neuropathy: from subclinical alterations to disabling abnormalities. Arch Physiol Biochem 109: 234-240, 2001. 3. Bavis RW, Russell KE, Simons JC, and Otis JP. Hypoxic ventilatory responses in rats after hypercapnic hyperoxia and intermittent hyperoxia. Respir Physiol Neurobiol 155: 193-202, 2007. 4. Bean L, Zheng H, Patel KP, and Monaghan DT. Regional variations in NMDA receptor downregulation in streptozotocin-diabetic rat brain. Brain Res 1115: 217-222, 2006. 5. Biessels GJ, Bravenboer B, and Gispen WH. Glucose, insulin and the brain: modulation of cognition and synaptic plasticity in health and disease: a preface. Eur J Pharmacol 490: 1-4, 2004. 6. Bissonnette JM, and Knopp SJ. Hypercapnic ventilatory response in mice lacking the 65 kDa isoform of Glutamic Acid Decarboxylase (GAD65). Respir Res 5: 3, 2004. 7. Bloom FE, and Iversen LL. Localizing 3H-GABA in nerve terminals of rat cerebral cortex by electron microscopic autoradiography. Nature 229: 628-630, 1971. 8. Chebib M, and Johnston GA. The 'ABC' of GABA receptors: a brief review. Clin Exp Pharmacol Physiol 26: 937-940, 1999. 9. Chen C, and Leonard JP. Protein tyrosine kinase-mediated potentiation of currents from cloned NMDA receptors. J Neurochem 67: 194-200, 1996. 10. Choi DW. Excitotoxic cell death. J Neurobiol 23: 1261-1276, 1992. 11. Coates EL, Li A, and Nattie EE. Widespread sites of brain stem ventilatory chemoreceptors. J Appl Physiol 75: 5-14, 1993. 12. Dean JB, Bayliss DA, Erickson JT, Lawing WL, and Millhorn DE. Depolarization and stimulation of neurons in nucleus tractus solitarii by carbon dioxide does not require chemical synaptic input. Neuroscience 36: 207-216, 1990. 13. Duarte A, Santos M, Seica R, and Resende de Oliveira C. Effect of oxidative stress on the uptake of GABA and glutamate in synaptosomes isolated from diabetic rat brain. Neuroendocrinology 72: 179-186, 2000. 14. Duarte AI, Santos MS, Seica R, and de Oliveira CR. Insulin affects synaptosomal GABA and glutamate transport under oxidative stress conditions. Brain Res 977: 23-30, 2003. 15. Duarte AI, Santos MS, Seica R, and Oliveira CR. Oxidative stress affects synaptosomal gamma-aminobutyric acid and glutamate transport in diabetic rats: the role of insulin. Diabetes 53: 2110-2116, 2004. 16. Easton PA, Slykerman LJ, and Anthonisen NR. Ventilatory response to sustained hypoxia in normal adults. J Appl Physiol 61: 906-911, 1986. 17. Fennerty AG, Rimmer EM, Boulton J, and Richens A. Effect of gamma aminobutyric acid on the carbon dioxide rebreathing response of normal subjects: a study using vigabatrin. Thorax 45: 42-44, 1990. 18. Fewell JE, Taylor BJ, Kondo CS, Dascalu V, and Filyk SC. Influence of carotid denervation on the arousal and cardiopulmonary responses to upper airway obstruction in lambs. Pediatr Res 28: 374-378, 1990. 19. Gagne J, Milot M, Gelinas S, Lahsaini A, Trudeau F, Martinoli MG, and Massicotte G. Binding properties of glutamate receptors in streptozotocin-induced diabetes in rats. Diabetes 46: 841-846, 1997. 20. Gomez R, Vargas CR, Wajner M, and Barros HM. Lower in vivo brain extracellular GABA concentration in diabetic rats during forced swimming. Brain Res 968: 281-284, 2003. 21. Guz A, Noble MI, Widdicombe JG,44Trenchard D, and Mushin WW. The effect of.
(51) bilateral block of vagus and glossopharyngeal nerves on the ventilatory response to CO2 of conscious man. Respir Physiol 1: 206-210, 1966. 22. Hayashi F, and Lipski J. The role of inhibitory amino acids in control of respiratory motor output in an arterially perfused rat. Respir Physiol 89: 47-63, 1992. 23. Hedner J, Hedner T, Wessberg P, and Jonason J. An analysis of the mechanism by which gamma-aminobutyric acid depresses ventilation in the rat. J Appl Physiol 56: 849-856, 1984. 24. Holtman JR, Jr., and King KA. Regulation of respiratory motor outflow to the larynx and diaphragm by GABA receptors. Eur J Pharmacol 156: 181-187, 1988. 25. Hoop B, Shih VE, and Kazemi H. Relationship between central nervous system hydrogen ion regulation and amino acid metabolism in hypercapnia, II. Am Rev Respir Dis 132: 248-253, 1985. 26. Huang J, Suguihara C, Hehre D, Lin J, and Bancalari E. Effects of GABA receptor blockage on the respiratory response to hypoxia in sedated newborn piglets. J Appl Physiol 77: 10061010, 1994. 27. Idris I, Hall AP, O'Reilly J, Barnett A, Allen M, Andrews R, Grunstein P, Lewis K, Goenka N, and Wilding JP. Obstructive sleep apnoea in patients with type 2 diabetes: aetiology and implications for clinical care. Diabetes Obes Metab 11: 733-741, 2009. 28. Kazemi H, and Hoop B. Glutamic acid and gamma-aminobutyric acid neurotransmitters in central control of breathing. J Appl Physiol 70: 1-7, 1991. 29. Kneussel M. Dynamic regulation of GABA(A) receptors at synaptic sites. Brain Res Brain Res Rev 39: 74-83, 2002. 30. Kneussl MP, Pappagianopoulos P, Hoop B, and Kazemi H. Reversible depression of ventilation and cardiovascular function by ventriculocisternal perfusion with gamma-aminobutyric acid in dogs. Am Rev Respir Dis 133: 1024-1028, 1986. 31. Lee SD, Nakano H, and Farkas GA. NMDA receptor-mediated modulation of ventilation in obese Zucker rats. Int J Obes Relat Metab Disord 25: 997-1004, 2001. 32. Lin J, Suguihara C, Huang J, Hehre D, Devia C, and Bancalari E. Effect of N-methyl-Daspartate-receptor blockade on hypoxic ventilatory response in unanesthetized piglets. J Appl Physiol 80: 1759-1763, 1996. 33. Ling L, Olson EB, Jr., Vidruk EH, and Mitchell GS. Developmental plasticity of the hypoxic ventilatory response. Respir Physiol 110: 261-268, 1997. 34. Lipton SA, and Rosenberg PA. Excitatory amino acids as a final common pathway for neurologic disorders. N Engl J Med 330: 613-622, 1994. 35. Liu L, Brown JC, 3rd, Webster WW, Morrisett RA, and Monaghan DT. Insulin potentiates N-methyl-D-aspartate receptor activity in Xenopus oocytes and rat hippocampus. Neurosci Lett 192: 5-8, 1995. 36. Magarinos AM, Jain K, Blount ED, Reagan L, Smith BH, and McEwen BS. Peritoneal implantation of macroencapsulated porcine pancreatic islets in diabetic rats ameliorates severe hyperglycemia and prevents retraction and simplification of hippocampal dendrites. Brain Res 902: 282-287, 2001. 37. Melton JE, Neubauer JA, and Edelman NH. GABA antagonism reverses hypoxic respiratory depression in the cat. J Appl Physiol 69: 1296-1301, 1990. 38. Mizusawa A, Ogawa H, Kikuchi Y, Hida W, Kurosawa H, Okabe S, Takishima T, and Shirato K. In vivo release of glutamate in nucleus tractus solitarii of the rat during hypoxia. J Physiol 478 ( Pt 1): 55-66, 1994. 39. Monaghan DT, Bridges RJ, and Cotman CW. The excitatory amino acid receptors: their classes, pharmacology, and distinct properties in the function of the central nervous system. Annu Rev Pharmacol Toxicol 29: 365-402, 1989. 40. Mori H, and Mishina M. Structure and function of the NMDA receptor channel. Neuropharmacology 34: 1219-1237, 1995. 45.
(52) 41. Park CR. Cognitive effects of insulin in the central nervous system. Neurosci Biobehav Rev 25: 311-323, 2001. 42. Polotsky VY, Wilson JA, Haines AS, Scharf MT, Soutiere SE, Tankersley CG, Smith PL, Schwartz AR, and O'Donnell CP. The impact of insulin-dependent diabetes on ventilatory control in the mouse. Am J Respir Crit Care Med 163: 624-632, 2001. 43. Putnam RW, Conrad SC, Gdovin MJ, Erlichman JS, and Leiter JC. Neonatal maturation of the hypercapnic ventilatory response and central neural CO2 chemosensitivity. Respir Physiol Neurobiol 149: 165-179, 2005. 44. Rao RS, Greenberg HE, Sica AL, and Scharf SM. gamma-Aminobutyric acid contributes to modulation of cardiorespiratory control after chronic ventilatory loading. Respir Physiol 108: 3544, 1997. 45. Reid SG, and Powell FL. Effects of chronic hypoxia on MK-801-induced changes in the acute hypoxic ventilatory response. J Appl Physiol 99: 2108-2114, 2005. 46. Reisi P, Alaei H, Babri S, Sharifi MR, Mohaddes G, and Soleimannejad E. Determination of the extracellular basal levels of glutamate and GABA at dentate gyrus of streptozotocin-induced diabetic rats. Pathophysiology 16: 63-66, 2009. 47. Scano G, Filippelli M, Romagnoli I, Mancini M, Misuri G, Duranti R, and Rosi E. Hypoxic and hypercapnic breathlessness in patients with type I diabetes mellitus. Chest 117: 960-967, 2000. 48. Skeberdis VA, Lan J, Zheng X, Zukin RS, and Bennett MV. Insulin promotes rapid delivery of N-methyl-D- aspartate receptors to the cell surface by exocytosis. Proc Natl Acad Sci U S A 98: 3561-3566, 2001. 49. Soto-Arape I, Burton MD, and Kazemi H. Central amino acid neurotransmitters and the hypoxic ventilatory response. Am J Respir Crit Care Med 151: 1113-1120, 1995. 50. Stunden CE, Filosa JA, Garcia AJ, Dean JB, and Putnam RW. Development of in vivo ventilatory and single chemosensitive neuron responses to hypercapnia in rats. Respir Physiol 127: 135-155, 2001. 51. Vincent A, Kessler JP, Baude A, Dipasquale E, and Tell F. N-methyl-d-aspartate receptor activation exerts a dual control on postnatal development of nucleus tractus solitarii neurons in vivo. Neuroscience 126: 185-194, 2004. 52. Wada A, Yokoo H, Yanagita T, and Kobayashi H. New twist on neuronal insulin receptor signaling in health, disease, and therapeutics. J Pharmacol Sci 99: 128-143, 2005. 53. Waters KA, and Machaalani R. Role of NMDA receptors in development of respiratory control. Respir Physiol Neurobiol 149: 123-130, 2005. 54. Weil JV, Byrne-Quinn E, Sodal IE, Friesen WO, Underhill B, Filley GF, and Grover RF. Hypoxic ventilatory drive in normal man. J Clin Invest 49: 1061-1072, 1970. 55. Weisbrod CJ, Eastwood PR, O'Driscoll G, and Green DJ. Abnormal ventilatory responses to hypoxia in Type 2 diabetes. Diabet Med 22: 563-568, 2005. 56. Williams JG, Morris AI, Hayter RC, and Ogilvie CM. Respiratory responses of diabetics to hypoxia, hypercapnia, and exercise. Thorax 39: 529-534, 1984. 57. Wood JD, Watson WJ, and Ducker AJ. The effect of hypoxia on brain gammaaminobutyric acid levels. J Neurochem 15: 603-608, 1968. 58. Yajima Y, Narita M, Takahashi-Nakano Y, Misawa M, Nagase H, Mizoguchi H, Tseng LF, and Suzuki T. Effects of differential modulation of mu-, delta- and kappa-opioid systems on bicuculline-induced convulsions in the mouse. Brain Res 862: 120-126, 2000. 59. Yamazaki H, Okazaki M, Takeda R, and Haji A. Hypercapnic and hypoxic ventilatory responses in long-term streptozotocin-diabetic rats during conscious and pentobarbital-induced anesthetic states. Life Sci 72: 79-89, 2002. 60. Zhao WQ, Chen H, Quon MJ, and Alkon DL. Insulin and the insulin receptor in experimental models of learning and memory.46Eur J Pharmacol 490: 71-81, 2004..
(53) 61. Zheng H, Li YF, Weiss M, Mayhan WG, and Patel KP. Neuronal expression of fos protein in the forebrain of diabetic rats. Brain Res 956: 268-275, 2002.. 47.
(54)
數據


+7
Outline
相關文件
①尼古丁 ②焦油 ③一氧化碳
CF12203A#2 許惠恒 在亞洲國家多中心隨機研究比較 Joint Asia Diabetes Evaluation (JADE) 的結構照護計劃與 Diabetes Monitoring Database (DIAMOND)
有人說「血液中之二氧化碳含量應該維持一定」 ,你認為這樣
Take a time step on current grid to update cell averages of volume fractions at next time step (b) Interface reconstruction. Find new interface location based on volume
探討燃燒所得的碳簇、活性碳及二氧化錳對 雙氧水分解的影響。將 3個100 mL量筒中各加 入 5 mL雙氧水和1 mL的清潔劑水溶液,分別 加入 0 .2 g碳黑、0.2
二氧化碳外,另外還 有一種葉輪專門捕捉 葡萄糖,再以類似呼 吸作用的反應提供
酸性氣體(二氧化硫、二氧化氮)可以飄浮到離源頭很遠的地
A discussion of the Dapagli flozin and Prevention of Adverse Outcomes in Chronic Kidney Disease (DAPA-CKD) trial, the Effect of Sotagli flozin on Car- diovascular Events in Patients
![HPSH [ 氧化數平衡反應式係數 ]](data:image/gif;base64,R0lGODlhAQABAIAAAP///wAAACH5BAEAAAAALAAAAAABAAEAAAICRAEAOw==)