doi:10.1016/j.ultrasmedbio.2005.05.009
●
Original Contribution
EFFECTS OF AGING ON THE PLANTAR SOFT TISSUE PROPERTIES
UNDER THE METATARSAL HEADS AT DIFFERENT
IMPACT VELOCITIES
CHIH-CHIN
HSU,* WEN-CHUNG
TSAI,* CARL
PAI-CHU
CHEN,* YIO-WHA
SHAU,
†CHUNG-LI
WANG,
‡MAX
JIN-LUNG
CHEN,* and KING-JEN
CHANG
§*Department of Physical Medicine and Rehabilitation, Chang Gung Memorial Hospital, Taipei, Taiwan;†Institute of
Applied Mechanics,‡Departments of Orthopedic Surgery and§General Surgery, Angiogenesis Research Center,
National Taiwan University, Taipei, Taiwan
(Received 19 October 2004, revised 16 May 2005, in final form 26 May 2005)
Abstract—The plantar soft tissue properties under the metatarsal heads at different impact velocities in different age groups were measured. Each metatarsus of the left foot in healthy young adults (nⴝ 9, 19 to 35 years old) and in healthy older persons (n ⴝ 10, 42 to 72 years old) was examined in vivo using a self-constructed loading-unloading device at low, medium and high impact status; the impact velocities of the device were about 2.5, 5 and 10 cm/s, respectively. The device comprised a 5- to 12-MHz linear-array ultrasound transducer, a miniature load cell and a fixation frame. From low to high impact status, the elastic modulus (E) in young adults significantly increased from about 300 kPa to about 500 kPa. However, the E in the older group did not show this trend. From low to high impact status, the energy dissipation ratio (EDR) of the metatarsus significantly increased from about 30% to about 60% in the young group and significantly increased from about 40% to about 70% in the older group. Most of the metatarsus in the older subjects had significantly greater E and EDR than those in the younger persons. (E-mail: chungli@ha.mc.ntu.edu.tw) © 2005 World Federation for Ultrasound in Medicine & Biology.
Key Words: Metatarsus, Biomechanics, Aging, Ultrasonography, Impact velocity.
INTRODUCTION
In an active and healthy society, foot problems are be-coming more prevalent in the aging population (Whitney 2003). Metatarsalgia, a well-recognized but loosely de-fined pathologic entity, is caused by excessive sports activities (Quirk 1996) and is frequently associated with the aging process (Edelstein 1988). Abnormal foot bio-mechanics caused by tissue changes under the metatarsal heads has been proposed to be a key risk factor for this lesion (Whitney 2003). Therefore, it is important to iden-tify the plantar soft tissue properties under the metatarsal heads, because they can provide basic information about the material itself or indicate the presence of a disease (Brink 1995).
Features of viscoelasticity, including creep, stress relaxation and hysteresis can be seen in all biologic tissues (Fung 1993). The plantar soft tissues under the
metatarsal heads, comprising a complex framework of the connective tissue and closely packed fat cells, are optimized for load-bearing during ambulation ( Bojsen-Møller and Flagstad 1976). Healthy persons may volun-tarily modify their walking velocity and the plantar soft tissues have to tolerate the ground reaction force at different impact velocities. It would be interesting to examine the plantar soft tissue behaviors at different impact velocities.
The plantar soft tissue thickness under each meta-tarsal head has been evaluated ultrasonographically (Gooding et al. 1986; Cavanagh 1999; Zheng et al. 2000) and roentgenographically (Dreeben et al. 1987). The elastic modulus of the metatarsus and of the soft tissues between the metatarsal heads is measured either by an ultrasonic indentation probe (Zheng et al. 2000) or by the method of integrating the contact pressure measurement technique into a magnetic resonance imaging system (Gefen et al. 2001), respectively. Klaesner et al. (2002)
developed a 3-D indentor system to measure the tissue stiffness of the metatarsus; others used a durometer (Brink 1995). The hysteresis of the plantar soft tissue
Address correspondence to: Dr. Chung-Li Wang, M.D., Ph.D., Prof., Department of Orthopedic Surgery, National Taiwan University Hospital, No. 7, Chungshan South Rd., Taipei 100 Taiwan. E-mail: chungli@ha.mc.ntu.edu.tw
Printed in the USA. All rights reserved 0301-5629/05/$–see front matter
under each metatarsus in healthy young subjects has been measured by an ultrasound (US)-based loading-unloading device (Wang et al. 1999). However, how the soft tissue properties under the metatarsal heads react to different impact velocities has not been investigated.
Ultrasonography can provide dynamic information on the soft tissue structures in their physiological range of motion and is ideal for continuous monitoring of the plantar soft tissue thickness during a loading-unloading cycle. The present study developed an US-load-cell sys-tem to investigate the effects of aging on the plantar soft tissue properties under metatarsal heads at different im-pact velocities in vivo.
MATERIALS AND METHODS
A total of 19 healthy volunteers were recruited and were further divided into the young and the older groups. There were 4 women and 5 men in the younger group and 5 women and 5 men in the older group. The mean age and body mass index (BMI) were 24.0⫾ 1.8 years (range: 19 to 35 years) and 23.0⫾ 1.4 kg/m2, respec-tively, in the young group. The mean age and BMI were 54.6⫾ 3.3 years (range: 42 to 72 years) and 26.0 ⫾ 1.5 kg/m2, respectively, in the older group. These subjects did not have any foot problems within the recent 6 months. The above and subsequently presented data were all mean⫾ standard error of mean.
A 5- to 12-MHz linear-array US transducer (HDI5000, Advanced Technology Laboratory, Bothell, WA, USA) with the area of 4.73 cm2was incorporated into an indenter that was equipped with a miniature load cell (LM-10KA, Kyowa Electronic Instruments Corp., Kyowa, Japan). They were then mounted on a device comprising a plastic fixation cover, stainless steel frame and a guiding linear bearing (Fig. 1). The hand-held indenter moved the transducer to and fro, to load and unload the metatarsus. Each subject was placed in the supine position with the ankle in neutral and the knee in straight positions. All of the subjects were examined by an experienced operator.
The skin was pretreated with alcohol, to facilitate US penetration into the plantar soft tissues. Then, the transducer was put along each toe ray and contacted the ball of the foot via a water bag. With the US transducer slightly detached from the skin and with the US couplant filled in between, the unloaded plantar soft tissue thick-ness under the metatarsal head (UPTM) was measured from the skin surface to the nearest metatarsal head cortex on the sonogram. Thereafter, the probe loaded the metatarsus rhythmically with low, medium and high impact status, according to the frequency of a metronome (quartz metronome SQ-77, Seiko S-Yard Co. Ltd., To-kyo, Japan) at 0.5 Hz, 1 Hz and 2 Hz, respectively. A beep sound was generated as soon as the compression
force reached 98 N and then the applied force was relieved immediately. The averaged pressure, calculated from the total force divided by the area of the US transducer, was used to analyze the stress-strain relation-ship in the study. With a contact area of 4.73 cm2, the maximum stress on the tested metatarsus applied by the US transducer was equivalent to 207 kPa. The water bag was open to the atmosphere. The tested metatarsus was about 5 cm below the water level and the water level in the bag was raised slightly (typically less than 0.5 cm) during the loading process. The pressure acting on the tested metatarsus by the water bag was about 500 to 550 Pa, which was about 0.25% of the maximum loading pressure applied by the US transducer. Therefore, it is considered that the pressure on the tested metatarsus applied by the water bag could be neglected during the examination.
The impact velocity was defined as the rate of deformation of the water bag at the instant that the transducer contacted the skin. After the transducer touched the metatarsus, the plantar soft tissue started to deform in responding to the loading force of the trans-ducer. The average loading rate was calculated by using the maximum deformation of the plantar soft tissue di-vided by the loading time interval (Wang et al. 1999). Moreover, the average force/time slope was given by the maximum compression force divided by the loading time interval (Klaesner et al. 2002).
The mean impact velocity corresponding to low, medium and high impacts of the young subjects was
Fig. 1. Experimental design of this study. The tested left foot was placed in a plastic rim (A) of a stainless-steel frame (B) that allowed repeated loading-unloading examination. US transducer (C) contacted with the examined region through a water bag (E). The transducer was further connected with a load cell (F) via an adapter (D). A hand-held steel rod (G) could move the transducer freely in a bearing (H) at different maxi-mum impact velocities. M-mode morphologies and piezoelec-tric signals were transmitted to the high-resolution US system
2.36 ⫾ 0.09 cm/s (range: 1.46 to 3.62 cm/s), 5.47 ⫾ 0.14 cm/s (range: 4.02 to 6.64 cm/s) and 10.5⫾ 0.3 cm/s (range: 6.76 to 12.6 cm/s), respectively. The mean im-pact velocity corresponding to low, medium and high impacts of the older subjects was 2.42 ⫾ 0.10 cm/s (range: 1.34 to 3.8 cm/s), 5.26⫾ 0.13 cm/s (range: 3.27 to 6.71 cm/s) and 9.92⫾ 0.22 cm/s (range: 7.06 to 13.1 cm/s), respectively. The average loading rate corre-sponding to low, medium and high impacts of the young subjects was 1.09⫾ 0.05 cm/s (range: 0.71 to 1.68 cm/s), 1.87⫾ 0.05 cm/s (range: 1.26 to 2.45 cm/s) and 2.88 ⫾ 0.08 cm/s (range: 2.12 to 3.74 cm/s), respectively. The average loading rate corresponding to the low, medium and high impacts of the older subjects was 0.98⫾ 0.04 cm/s (range: 0.47 to 1.42 cm/s), 1.75⫾ 0.06 cm/s (range: 1.21 to 2.58 cm/s) and 2.89⫾ 0.12 cm/s (range: 2.03 to 4.78 cm/s), respectively. The force/time slope at the low, medium and high impacts of the young subjects was 227 ⫾ 13 N/s (range: 118 to 490 N/s), 357 ⫾ 12 N/s (range: 265 to 490 N/s) and 566⫾ 21 N/s (range: 392 to 817 N/s), respectively. The force/time slope at the low, me-dium and high impacts of the older subjects was 206⫾ 9.6 N/s (range: 111 to 338 N/s), 351⫾ 15 N/s (range: 181 to 649 N/s) and 550⫾ 20 N/s (range: 329 to 817 N/s), respectively.
Each metatarsus of the left foot in every subject was monitored continuously during loading-unloading tests by motion-mode (M-mode) at a sampling rate of 100 Hz (Fig. 2). We examined the metatarsus with a slower impact velocity first and then increased the velocity sequentially. Each metatarsus had a 10-min interval free-of-loading between each measurement (Fung 1993). The load cell signals were magnified by an amplifier (INA128/UAF42, Texas Instruments, Austin, TX, USA), in which frequency above 10 Hz was filtered. The signals were digitized by an analog-to-digital converter card (PCI-9118 DG, AD Link Technology Inc., Taipei, Tai-wan) and were then transmitted to an IBM-compatible personal computer. A pulse generator was used to syn-chronize the load cell and the tissue thickness informa-tion. By carefully calibrating the system with an impul-sive motion, the time lag between the load cell signals and the ultrasonic M-mode was found to be about 20 ms (Shau et al. 1999).
The elastic modulus (E) of the plantar soft tissue under the metatarsal head was defined as:
E⫽ Pmax
冉
UPTM⫺ PTMmaxUPTM
冊
, (1)
where Pmaxand PTMmaxrepresented the maximum stress and plantar soft tissue thickness measured at maximum stress, respectively. The denominator of the above for-mula represented the maximum strain.
In terms of stress-strain relationship, the metatarsus showed a nonlinear looping curve (Fig. 3). The upper loading curve and the lower unloading curve formed a closed area that represented the dissipated energy. Thus, the energy dissipation ratio (EDR), indicating the shock absorbency of plantar soft tissues under the metatarsal heads, was given as:
EDR⫽ (bounded area ⁄ area under the loading curve) ⫻ 100% (2) The area was estimated by the numerical integra-tion-based trapezoid rule using Microsoft Excel (Mi-crosoft Corp., Redmond, WA, USA).
Reliability was determined by a test-retest proce-dure. We repeated the measurement with the three
dif-Fig. 2. B- and M-mode images of the plantar soft tissue under left third metatarsus (top) in a 57-year-old healthy man. The vertical line of the upper panel represented the US scanning line of the M-mode (bottom). The two sinusoid lines in the lower panel are the skin and cortex of the metatarsal head at different times in loading-unloading cycles. UPTM was mea-sured from the skin to the nearest cortex. Plantar soft tissue thickness under the metatarsal head (PTM) during a loading-unloading cycle could be easily measured from M-mode. Time marks produced by a pulse generator were used to synchronize load cell signals (lower panel) in the IBM-compatible personal
ferent impact statuses on the plantar soft tissue under the second metatarsal head of the left foot in five healthy individuals at intervals of 10 min, 2 h and 1 week after the first measurement. The coefficient of variation (CV) was then calculated from the 20 measurements at each impact status and ranged from 1 to 3% for the UPTM and E. The CV for the EDR ranged from 2.56 % to 8.45 %. Mann– Whitney U test was used to compare the age, BMI, UPTM, E, EDR, maximum strain, impact velocities, loading rates and force/time slopes between the two groups. The relationship between the BMI, UPTM and the mechanical properties was analyzed by the Pearson correlation. Repeated measurements were conducted to compare differences of E and EDR of the plantar soft tissues under the metatarsal heads among different im-pact statuses. Fisher’s exact test was used to evaluate the gender distribution between the two groups. A p value of less than 0.05 was regarded as statistically significant.
RESULTS
Gender distribution and BMI were not significantly different between the two groups. Significant difference (p⬍ 0.001) of the age distribution was observed between the two groups. The mean UPTM had a decrease trend from the first to the fifth metatarsus in both groups, with values of 1.36⫾ 0.05, 1.23 ⫾ 0.06, 1.13 ⫾ 0.05, 1.09 ⫾ 0.06 and 0.89⫾ 0.03 cm in the younger group and 1.40 ⫾ 0.05, 1.31⫾ 0.06, 1.21 ⫾ 0.05, 1.16 ⫾ 0.03 and 1.07 ⫾ 0.06 cm in the older group. There was no significant difference of the thickness between the two groups. The impact velocities, loading rates and force/time slopes were not significantly different between the two groups, either.
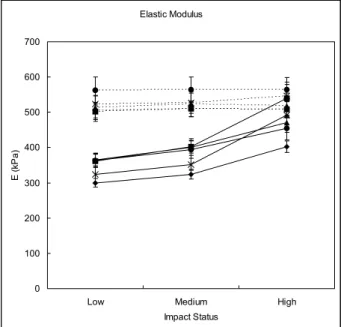
The E in most of the metatarsus in the young persons had a significant increase trend from low to high impact status. However, the E of the metatarsus in the older individuals measured at different impact statuses did not share the same tendency (Fig. 4). The second to fifth metatarsus in the older persons were stiffer than those in the younger persons at low and medium impact status. The first metatarsus in the older subjects had greater tissue stiffness than that in the younger subjects at the three different impact conditions (Table 1).
The maximum strain in the young subjects had a significant decrease trend from low to high impact status. The maximum strain in the older subjects measured at different impact status did not show the same trend. Almost all the plantar soft tissues under the metatarsal heads in the older persons deformed less than those in the young subjects at the three impact statuses (Table 2).
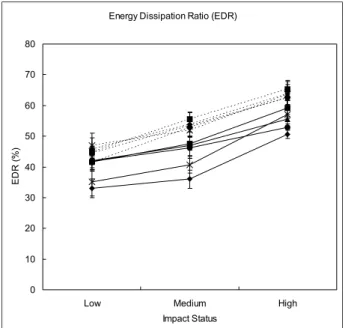
The EDR in almost all the metatarsus increased significantly from low to high impact status (Fig. 5). Under the same impact status, the older subjects had significantly greater EDRs than the young subjects in a majority of the metatarsus. At the low impact status, there was no significant difference of the EDR in the second to fourth metatarsus between the two groups. The EDR of the fifth metatarsus measured at the high impact status was not significantly different between the two groups. The detail information is listed inTable 3.
Fig. 4. E of the young and older groups at different impact status. The E of the five metatarsals (⽧ ⫽ the first metatarsus; ⫽ the second metatarsus; ‘ ⫽ the third metatarsus; ● ⫽ the fourth metatarsus; ⫻ ⫽ the fifth metatarsus) in the young subjects (—) increased with increasing impact velocity. How-ever, stiffness of the older group (. . .) lost the rate sensitivity. The metatarsus in the older group had greater tissue stiffness than those in the young group, except at high-impact status. Data are presented as mean⫾ one standard error of the mean. Fig. 3. An example of the stress-strain curve of plantar soft
tissue under the fourth metatarsus in a 20-year-old healthy woman. The x-axis and y-axis represented the strain and stress, respectively. The upper loading curve (m) and the lower un-loading curve (,) formed a closed area. EDR is defined as the ratio of this closed area to the area formed by the loading curve,
The UPTM of the fourth metatarsus (r⫽ 0.584, p ⫽ 0.018) and its EDR measured at the medium impact status (r⫽ 0.578, p ⫽ 0.03) had fair correlation with the
BMI. The E of all the metatarsals did not correlate with the BMI. Fair correlation could be seen between the UPTM of the second metatarsus and its E measured at low impact status (r⫽ 0.527, p ⫽ 0.002). Fair correla-tion was also observed between the UPTM of the third metatarsus and its EDR measured at low impact status (r ⫽ 0.456, p ⫽ 0.05).
DISCUSSION
Cavanagh (1999)has used ultrasonography to study the deformation of the soft tissue underneath the second metatarsal head during walking in five healthy subjects with the average age of 36.6 years. The maximum strain measured at the maximum force of around 160 N was 45.7%. In-shoe peak plantar pressure at the metatarsal heads of young persons, evaluated at a walking speed of 1.66 m/s with capacitance-based pressure-measuring in-soles, ranged from 185 kPa to 198 kPa (Rozema et al. 1996). In this study, the maximum strain of the second metatarsus in the young group was 58.4⫾ 3.1%, 52.2 ⫾ 2.3% and 40.8⫾ 3.5% at low, medium and high impact status, respectively. The maximum tissue deformation was close to that in the previous report. The maximum stress on each metatarsus was 207 kPa in each test, which was similar to the above in-shoe peak plantar walking pressure. Thus, the experimental design in the study can simulate the physiological walking condition.
Table 1. Elastic modulus of the plantar soft tissues under the metatarsal heads at different impact status in the two groups
Impact status Young Older p value* MT1 (kPa) Low 300⫾ 12 509⫾ 21 0.003 Medium 324⫾ 14 505⫾ 20 0.003 High 402⫾ 16 511⫾ 32 0.042 p value† 0.021 0.992 – MT2 (kPa) Low 362⫾ 19 500⫾ 26 0.001 Medium 402⫾ 18 502⫾ 28 0.021 High 539⫾ 46 494⫾ 22 0.720 p value† 0.003 0.803 – MT3 (kPa) Low 365⫾ 20 517⫾ 34 0.003 Medium 401⫾ 24 527⫾ 37 0.012 High 471⫾ 19 547⫾ 32 0.063 p value† 0.010 0.462 – MT4 (kPa) Low 363⫾ 20 564⫾ 35 ⬍0.001 Medium 394⫾ 24 568⫾ 36 0.001 High 455⫾ 33 545⫾ 37 0.114 p value† 0.032 0.826 – MT5 (kPa) Low 324⫾ 24 528⫾ 29 0.004 Medium 352⫾ 17 530⫾ 33 0.006 High 492⫾ 48 557⫾ 31 0.376 p value† 0.536 0.694 –
Data are presented as mean⫾ standard error of mean. MT1–5 ⫽ the plantar soft tissue under the first to the fifth metatarsus. * Mann-Whitney U-test for estimation of differences between the two groups;†repeated measurement test for estimation of differences within subjects.
Table 2. The maximum strain of the plantar soft tissues under the metatarsal heads at different impact status
in the two groups
Impact status Young Older p value* MT1 (%) Low 69.2⫾ 2.6 41.4⫾ 1.6 0.003 Medium 64.2⫾ 2.8 41.1⫾ 1.6 0.003 High 51.8⫾ 2.0 41.2⫾ 1.8 0.008 p value† 0.006 0.829 – MT2 (%) Low 58.4⫾ 3.1 47.7⫾ 6.9 0.011 Medium 52.2⫾ 2.3 42.6⫾ 2.4 0.021 High 40.8⫾ 3.5 42.1⫾ 2.4 0.661 p value† ⬍ 0.001 0.287 – MT3 (%) Low 58.0⫾ 3.0 41.7⫾ 2.4 0.003 Medium 53.0⫾ 3.3 40.9⫾ 2.4 0.012 High 44.4⫾ 1.6 41.4⫾ 2.6 0.549 p value† 0.001 0.308 – MT4 (%) Low 58.1⫾ 3.0 38.0⫾ 2.2 ⬍ 0.001 Medium 53.7⫾ 3.4 37.7⫾ 2.0 0.001 High 47.2⫾ 3.5 37.7⫾ 2.0 0.036 p value† ⬍ 0.001 0.803 – MT5 (%) Low 65.0⫾ 4.5 40.0⫾ 1.8 0.004 Medium 59.2⫾ 2.8 40.1⫾ 2.0 0.004 High 43.0⫾ 4.6 38.8⫾ 2.2 0.497 p value† 0.114 0.593 –
Data are presented as mean⫾ standard error of mean. MT1–5 the plantar soft tissue under the first to the fifth metatarsus. * Mann– Whitney U-test for estimation of differences between groups; † re-peated measurement test for estimation of differences within subject.
Fig. 5. EDR of the young and older groups at different impact status. The EDRs of the five metatarsals (⽧ ⫽ the first meta-tarsus; ⫽ the second metatarsus; ‘ ⫽ the third metatarsus; ● ⫽ the fourth metatarsus; ⫻ ⫽ the fifth metatarsus) in the young subjects (—) and the older subjects (. . .) increased with increasing impact velocity. The older group had greater EDRs than those in the young group. Data are presented as mean⫾
In agreement with the previous reports concerning the UPTM in the young persons (Wang et al. 1999) and the effects of aging on the heel-pad stiffness (Hsu et al. 1998), the UPTM decreased progressively from the first to the fifth metatarsus in both groups and the plantar soft tissues in the older persons stiffened. Although the UPTM and the BMI were not significantly different between the two groups, yet there is a trend for a thicker UPTM and a greater BMI in the older subjects. An increase of body fat distribution in the plantar soft tissues may cause the increase of the UPTM in the older persons. The increased fatty content in the sole of the foot may lead to increased pressure in the sealed fibrous compart-ment and, finally, result in the harder plantar soft tissues in the older persons (Prichasuk et al. 1994).
A simple linear elasticity model (Fung 1993) de-scribes the elastic modulus of a material as:
(t) ⫽ E共t) (3)
Both the stress, (t), and strain, ⑀(t), are functions of time. Typically, as the stress rate increases, the strain for the soft tissue decreases. This results in an increase of the elastic modulus E with the increase of the stress rate. It has been reported that the elastic modulus in the meta-tarsus of healthy persons about 22-years-old measured with an US indentation system ranged from 40 to 50 kPa at a loading rate of 0.1 to 0.2 cm/s (Zheng et al. 2000). In that study, the stiffness increased significantly from about 300 kPa to 500 kPa in the young adults as the
loading rate increased from 1 cm/s to 3 cm/s. It is obvious that the young metatarsus stiffens as the loading rate increases, indicating its rate-dependency.
Klaesner et al. (2002)measured the tissue stiffness of the metatarsus in healthy persons about 56 years old and the elastic modulus ranged from 81 to 228 kPa. Their force/time slopes ranged from 20 to 30 N/s, using a device that consisted of a load cell mounted on a cylin-drical stylus. In the present study, the plantar soft tissue stiffness measured at higher force/time slopes (range: 111 N/s to 817 N/s) ranged from 500 to 568 kPa, which was greater than those in the above report. It is noted that the E increased as the force/time slope increased from 20 N/s to 111 N/s. Nevertheless, the plantar soft tissue stiffness did not increase with further increase in force/ time slope in the older persons.
Findings concerning the dissipated energy in the human heel pad, measured from 0.06 cm/s to 1.0 m/s, ranged from 23.7% to 95% (Bennett and Ker 1990; Hsu et al. 1998; Kinoshita et al. 1996).Wang et al. (1999)had measured the EDR of the metatarsus in healthy subjects about 30 years old at the loading rate of 0.06 cm/s and the value was about 30%. The EDR in plantar soft tissues under the metatarsal heads also increased as the impact velocity increased in all our subjects, indicating its rate-dependent characteristics. The plantar soft tissue deforms less in high-impact velocity, resulting in a steeper load-ing curve, and finally leads to the increased EDR in higher-impact velocity. Unlike the elastic modulus, sim-ply determined from the beginning and the end-loaded condition, the EDR records the loading-unloading pro-cess and can reflect the nonlinear tissue properties. This advantage may describe effects of aging on the metatar-sus more clearly than the tissue stiffness.
Under the same impact status, all the metatarsals in the older group had greater EDRs than those in the younger group. This observation was similar to that in the senescent heel pad (Hsu et al. 1998). The aging metatarsus becomes stiffened at each instantaneous point during the loading process. Slow tissue recovery may also occur during the unloading process of the aging metatarsus. The increase of EDR in the older persons may be caused by a steeper loading curve and a poor rebound unloading curve. It has been reported that a decrease of the water component plays a role in senes-cent foot tissue properties (Kuhns 1949). A gradual change of collagen and a decrease in the elastic fibers may also contribute to the aging of tissues (Haut and Haut 1997).
The E and EDR in most of the metatarsals did not correlate with the BMI in the study. The findings were similar to those in the study for the measurement of the heel-pad mechanical properties in elderly subjects and diabetic patients (Hsu et al. 2000) but were contrary to those in the study for plantar soft tissues properties in
Table 3. Energy dissipation ratio of the plantar soft tissues under the metatarsal heads at different impact status
in the two groups
Impact status Young Older p value* MT1 (%) Low 33.0⫾ 3.0 51.6⫾ 3.4 0.020 Medium 36.0⫾ 2.9 61.8⫾ 2.5 0.003 High 50.6⫾ 1.3 70.4⫾ 4.3 0.004 p value† 0.018 0.003 – MT2 (%) Low 41.6⫾ 3.1 48.1⫾ 2.4 0.113 Medium 47.6⫾ 2.2 61.8⫾ 2.7 0.001 High 59.2⫾ 3.5 70.7⫾ 3.5 0.043 p value† 0.001 ⬍ 0.001 – MT3 (%) Low 42.1⫾ 3.0 46.6⫾ 2.7 0.447 Medium 46.9⫾ 3.2 58.8⫾ 1.8 0.016 High 55.6⫾ 1.5 68.6⫾ 2.4 ⬍0.001 p value† 0.015 ⬍ 0.001 – MT4 (%) Low 41.8⫾ 3.0 41.7⫾ 3.7 0.743 Medium 46.2⫾ 3.4 57.9⫾ 3.5 0.055 High 52.8⫾ 3.5 71.4⫾ 2.0 ⬍ 0.001 p value† 0.022 ⬍ 0.001 – MT5 (%) Low 35.1⫾ 4.6 52.9⫾ 3.6 0.016 Medium 40.6⫾ 2.7 57.7⫾ 3.9 0.048 High 57.0⫾ 4.7 67.9⫾ 3.8 0.194 p value† 0.491 0.014 –
Data are presented as mean⫾ standard error of mean. MT1–5 ⫽ the plantar soft tissue under the first to the fifth metatarsus. * Mann– Whitney U-test for estimation of differences between groups; † re-peated measurement test for estimation of differences within subject.
young persons (Wang et al. 1999). More investigation for the plantar soft tissue mechanical properties may be necessary to reach a conclusion about the relationship between the plantar soft tissue biomechanics and the BMI. The E and EDR had been normalized with the initial thickness and, therefore, no correlation between them and the UPTM could be expected.
In this study, we used the averaged pressure, calcu-lated from the total force divided by the contact area of the US transducer, to analyze the stress-strain relation-ship of the metatarsus. The pressure distribution may be different from site to site and may be changed during the compression process, because of the underlying bones. The calculated E may be affected by the boundary con-ditions and further study is warranted.
The present study demonstrates that individuals in different age groups may have different plantar soft tissue responses to varied impact velocities. The tissue properties are also different between the different age groups. Effects of aging on plantar soft tissues under metatarsal heads are stiffened soft tissue, loss of tissue response to different impact velocities and high dissipated energy. These changes may impair the tissue reaction to a sudden or repetitive stress and eventually lead to the development of metatar-salgia in the aging people. Therefore, adequate footwear is suggested for aging persons. Because US is widely avail-able, the facility in this study can be easily built to measure the plantar soft tissue properties. This noninvasive tech-nique can be an adjunct in examining the forefoot biome-chanics and bridge the gap between podiatric science and the proper design of foot orthotics. A prospective study for evaluating the relationship between the altered tissue prop-erties and the development of forefoot problems can be done in the future, after measurement of the healthy fore-foot mechanical properties.
Acknowledgements—The authors thank Dr. Hung-Tu Lin of the Guan Chin rehabilitation clinic, Taipei Hsien, Taiwan, for providing the illustration.
REFERENCES
Bennett MB, Ker RF. The mechanical properties of the human subcal-caneal fat pad in compression. J Anat 1990;171:131–138.
Bojsen-Møller F, Flagstad KE. Plantar aponeurosis and internal archi-tecture of the ball of the foot. J Anat 1976;121:599 – 611. Brink T. Induration of the diabetic foot pad: Another risk factor for
recurrent neuropathic plantar ulcers. Biomed Tech 1995;40:205–209. Cavanagh PR. Plantar soft tissue thickness during ground contact in
walking. J Biomech 1999;32:623– 628.
Dreeben S, Thomas PBM, Noble PC, Tullos HS. A new method for radiography of weight-bearing metatarsal heads. Clin Orthop 1987; 224:260 –267.
Edelstein JE. Foot care for the aging. Phys Ther 1988;68:1882–1886. Fung YC. Biomechanics: Mechanical properties of living tissues. 2nd
ed. New York: Springer-Verlag, 1993.
Gefen A, Megido-Ravid M, Azariah M, Itzchak Y, Arcan M. Integra-tion of plantar soft tissue stiffness measurements in routine MRI of the diabetic foot. Clin Biomech 2001;16:921–925.
Gooding GAW, Stess RM, Graf PM, et al. Sonography of the sole of the foot: Evidence for loss of foot pad thickness in diabetes and its relationship to ulceration of the foot. Invest Radiol 1986;21:45– 48. Haut TL, Haut RC. The state of tissue hydration determines the strain-rate-sensitive stiffness of human patellar tendon. J Biomech 1997;30:79 – 81.
Hsu TC, Wang CL, Shau YW, et al. Altered heel-pad mechanical properties in patients with type 2 diabetes mellitus. Diabet Med 2000;17:854 – 859.
Hsu TC, Wang CL, Tsai WC, Kuo JK, Tang FT. Comparison of the mechanical properties of the heel pad between young and elderly adults. Arch Phys Med Rehab 1998;79:1101–1104.
Kinoshita H, Francis PR, Murase T, Kawai S, Ogawa T. The mechan-ical properties of the heel pad in elderly adults. Eur J Appl Physiol 1996;43:404 – 409.
Klaesner JW, Hastings MK, Zou D, Lewis C, Mueller MJ. Plantar tissue stiffness in patients with diabetes mellitus and peripheral neuropathy. Arch Phys Med Rehab 2002;83:1796 –1801. Kuhns JG. Changes in elastic adipose tissue. J Bone Joint Surg 1949;
31-A:542–547.
Prichasuk S, Mulpruek P, Siriwongpairat P. The heel-pad compress-ibility. Clin Orthop Rel Res 1994;300:197–200.
Quirk R. Metatarsalgia. Aust Fam Physician 1996;25:867– 869. Rozema A, Ulbrecht JS, Pammer SE, Cavanagh PR. In-shoe plantar
pressures during activities of daily living: Implications for thera-peutic footwear design. Foot Ankle Int 1996;17:352–359. Shau YW, Wang CL, Shieh JY, Hsu TC. Non-invasive assessment of
the viscoelasticity of peripheral arteries. Ultrasound Med Biol 1999;25:1377–1388.
Wang CL, Hsu TC, Shau YW, Shieh JY, Hsu KH. Ultrasonographic measurement of the mechanical properties of the sole under the metatarsal heads. J Orthop Res 1999;17:709 –713.
Whitney KA. Foot deformities, biomechanical and pathomechanical changes associated with aging including orthotic consideration, Part II. Clin Podiatr Med Surg 2003;20:511–526.
Zheng YP, Choi YKC, Wong K, Chan S, Mak AFT. Biomechanical assessment of plantar foot tissue in diabetic patients using an ultra-sound indentation system. Ultraultra-sound Med Biol 2000;26:451– 456.