國 立 交 通 大 學
生 物 資 訊 研 究 所
碩 士 論 文
大腸桿菌在無氧環境下利用甘油生產酒精
的模擬與分析
Modeling and Analysis of Glycerol Anaerobic
Utilization by Escherichia coli
研 究 生:張恆毅
指導教授:黃憲達 博士
大腸桿菌在無氧環境下利用甘油生產酒精的模擬與分析
Modeling and Analysis of Glycerol Anaerobic Utilization by
Escherichia coli
研 究 生:張恆毅 Student:Heng-Yi Chang
指導教授:黃憲達 Advisor:Hsien-Da Huang
國 立 交 通 大 學
生物資訊研究所
碩 士 論 文
A ThesisSubmitted to Institute of Bioinformatics Science College of Biological Science and Technology
National Chiao Tung University in partial Fulfillment of the Requirements
for the Degree of Master
In
Bioinformatics Science
June 2009
Hsinchu, Taiwan, Republic of China
大腸桿菌在無氧環境下利用甘油生產酒精的模擬與分析
學生: 張恆毅 指導教授 : 黃憲達 教授 國立交通大學生物資訊研究所碩士班中文摘要
世界能源危機的意識,使得利用微生物生產生質燃料如生質酒精、生質柴油 等,已被廣泛的研究。雖然過去的研究主要探討以微生物分解纖維素的議題,纖維素降 解程序仍然困難且繁鎖。相對地,甘油的化學結構簡單且能夠直接利用,而生質柴油生 產的過程會產生大量的甘油。因此甘油成為生產生質燃料的理想材料。也因此,甘油厭 氧利用的機制對於有效生成生質燃料與生物質有一定的重要性。 數學模擬應用於生物系統已有顯著的進展,這些模擬系統包含決定代謝反應的流 量、預測基因調節作用以及對於細胞行為的解讀。雙相(two-phase)研究運用基礎流量模 式(Elementary Flux Modes, EFMs)與非線性程式(nonlinear programming)分析並模擬大腸 桿菌內甘油代謝之厭氧路徑。我們的分析能夠解釋並提供細菌於甘油厭氧代謝時,其生 長問題的解決之道。此外,結合酵素動力準則與基礎流量模式能夠預測流量分布與代謝 濃度,甚至作為基因剔除之參考。 這些資訊有助於代謝工程在基因層次之修飾並藉以 提高目標物產量。Modeling and Analysis of Glycerol Anaerobic
Utilization by Escherichia coli
Student: Heng-Yi Chang Advisor: Hsien-Da Huang,
Institute of Bioinformatics, National Chiao Tung University
Abstract
Using microbes as the machine to produce biofuel such as bioethanol and biodiesel have
been widely investigated due to global energy crisis. While considerable attention has been
paid in the past on issues related to decompose the cellulose by microbes, the procedure of
cellulose degradation remains heavy and complicate. In contrast, the chemical structure of
glycerol is simpler and can be used directly. Thus glycerol became an ideal substrate for
biofuel generation because a mass of glycerol produced from biodiesel factory. Therefore,
mechanism of glycerol anaerobic utilization is important for efficiently biofuel synthesis and
biomass growth. Mathematical modeling for biology systems have progressed tremendously,
including determination of metabolic fluxes, prediction of gene regulations, and interpretation
of cell behaviors. A two-phase study was designed to utilizing elementary flux modes (EFMs)
and nonlinear programming for analysis and modeling glycerol metabolic anaerobic pathway
in Escherichia coli. Our analysis explains and provides solution for the growth problem of
bacteria during glycerol anaerobic metabolism. Besides, the model combining enzyme kinetic
principle and elementary flux modes (EFMs) could predict the flux distribution and
concentration of metabolites even gene deletion, which helps metabolic engineering to modify
致謝
首先要感謝我的指導教授黃憲達老師,在我碩士班時,對於研究的啟蒙
以及技術的指導,更在平常的相處中學到的不少做人處事的道理,也在我
怠惰懶散時給了我很大的動力完成學業最後的口試以及論文,另外也很感
謝隔壁應用微生物與生物工程實驗室的曾慶平老師以及實驗室的學生,在
我缺乏生物上的知識以及見解時,給了我很多的意見和指教。
當然也要感覺實驗室的學長姐,不僅是在一開始帶領著我踏上研究的軌
道,也在遇到困難時在旁幫助,並且督促著我的研究進度,而與整個實驗
室的同仁們的相處也非常融洽,興趣也十分相投,包括棒球,籃球,出去
玩,吃東西等等,給了我碩士班生活很多的樂趣。
最後,要感謝家人的支持,因為住在家裡,所以許多大小事都麻煩家人,
卻又常常不回家,或是夜晚騎車回家,都帶給了家人一些擔心及關心,而
如期完成了碩士的學業,也是因為家人讓我無後顧之憂的專心在學校的研
究上,而完成碩士班的學業,都是因為大家的幫助,才有今天的我,謝謝
大家。
張恆毅 于 交通大學 2009
Table of contents
中文摘要 ...i
Abstract ...ii
致謝 ...iii
Table of contents ...iv
List of Figures ...vi
List of Tables ...ix
Chapter 1 Introduction ... 1
1.1 Biological background... 1
1.1.1 World energy crisis ... 1
1.1.2 Glycerol for biofuels generation... 3
1.1.3 Microbes utilize glycerol ... 5
1.2 Motivation ... 6
1.3 Research goals ... 7
1.3.1 Mechanism of glycerol anaerobic utilizing in Escherichia coli ... 8
1.3.2 Computational prediction of glycerol anaerobic utilization ... 8
1.3.3 Verification of simulation derived from constructed model... 9
Chapter 2 Pathway investigation of glycerol anaerobic utilization by Escherichia coli 10 2.1 Introduction ... 10
2.1.1 Glycerol related reaction in Escherichia coli... 10
2.1.2 Elementary flux modes... 11
2.1.3 Different bacterium glycerol utilize pathway ... 13
2.1.4 Large- scale metabolic network... 14
2.2 Related work... 15
2.3 Motivation and the Specific aim... 16
2.4 Materials and methods... 16
2.5 Results ... 17
2.5.1 Numbers of elementary flux modes ... 18
2.5.2 Relationship between yields of biomass and ethanol ... 20
Chapter 3 Modeling and simulation of glycerol anaerobic utilization behavior in
Escherichia coli ... 26
3.1 Introduction ... 26
3.1.1 Modeling for metabolic engineering ... 26
3.1.2 Simulation of biological systems... 27
3.2 Related work... 27
3.2.1 Flux balance analysis (FBA) ... 27
3.2.2 Enzyme kinetic ... 28
3.3 Motivation and the Specific aim... 28
3.4 Materials and methods... 28
3.4.1 Experimental data source ... 29
3.4.2 Method of hybrid model ... 29
3.5 Results ... 32
3.6 Summery... 36
Chapter 4 Model verification and validation ... 37
4.1 Introduction ... 37
4.1.1 Parameter sensitivity analysis... 37
4.1.2 Correlation of flux and parameters... 37
4.2 Results ... 38
4.2.1 Parameters analysis and correlation coefficient between EFMs ... 38
4.2.2 Case study... 51
4.3 Summery... 53
Chapter 5 Discussions... 54
5.1 Glycerol anaerobic utilization ... 54
5.2 Elementary flux mode ... 54
5.3 Modeling... 54
5.4 Compound influence cell growth and metabolite distributions... 55
5.5 Future work ... 55
Chapter 6 Conclusion ... 56
Reference ... 57
List of Figures
Figure 1.1 World primary energy demand in the reference scenario. (International Energy
Agency, 2007)... 2
Figure 1.2 Assumed ratio of natural gas and implied relation of coal prices to oil prices to oil prices in the reference scenario. ... 2
Figure 1.3 Ratio of renewable energy from different sources. ... 2
Figure 1.4 Biodiesel production and its byproduct glycerol. ... 3
Figure 1.5 US biodiesel production and its impact on crude glycerol prices [2] ... 4
Figure 1.6 Comparison of ethanol production from corn-derived sugars[2]... 4
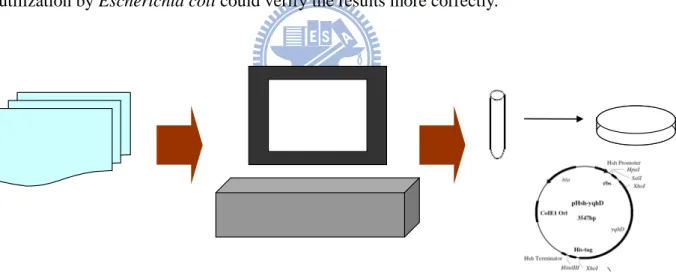
Figure 1.7 systems flow of Modeling and Analysis of Glycerol Anaerobic Utilization by Escherichia coli ... 7
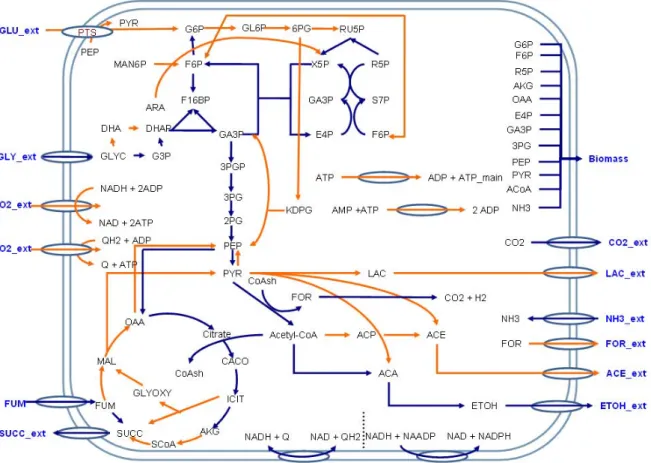
Figure 2.1 Subset of glycerol anaerobic utilization pathway in Escherichia coli... 11
Figure 2.2 Simple example of a biochemical network of elementary flux modes (O.Palsson ,systems biology :properties of reconstructed networks)... 13
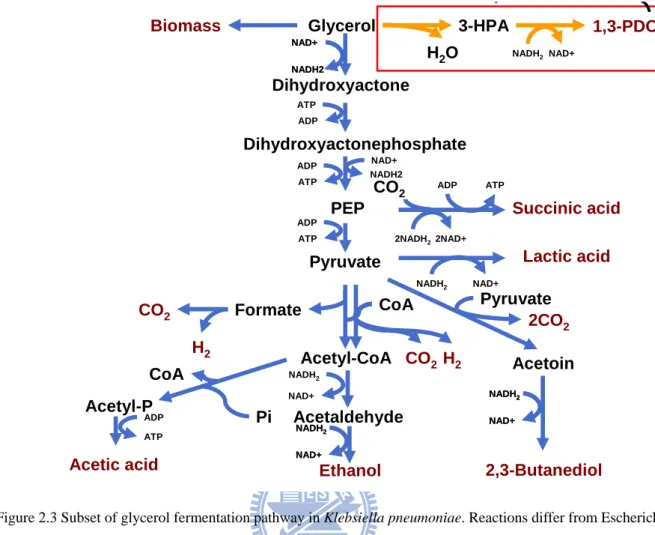
Figure 2.3 Subset of glycerol fermentation pathway in Klebsiella pneumoniae. Reactions differ from Escherichia coli with red frame. ... 14
Figure 2.4 Metabolic map of E. coli central metabolic network. [13] ... 15
Figure 2.5 Yields of biomass and ethanol (A) Modes of glycerol anaerobic utilization in medium plus fumarate which relate only glycerol (B) Modes of glycerol anaerobic utilization in medium plus fumarate which relate fumarate and glycerol (C) Modes of glycerol fermentation in medium plus tryptone which relate only glycerol (D) Modes of glycerol fermentation in medium plus tryptone which relate glycerol and tryptone (E) Modes of glycerol fermentation in recombinant E.coli... 20
Figure 2.6 The mode of most high yields of ethanol in glycerol anaerobic utilization in medium plus fumarate. ... 21
Figure 2.7 The mode of most high yields of biomass in glycerol anaerobic utilization in medium plus fumarate. ... 22
Figure 2.8 The mode of average yields in glycerol anaerobic utilization in medium plus fumarate. ... 22
Figure 2.9 The mode of which most high yields of ethanol is in glycerol fermentation express foreign genes. ... 23
Figure 2.10 The mode of which most high yields of biomass is in glycerol fermentation express foreign genes. ... 23
Figure 2.11 The mode of which most high yields of ethanol is in glycerol fermentation in medium plus tryptone. ... 24 Figure 2.12 The mode of which most high yields of biomass is in glycerol fermentation in
medium plus tryptone. ... 24
Figure 3.1 Proceed of hybrid model simulated reactions rates... 30
Figure 3.2 Schema of parameters identification... 31
Figure 3.3 Anaerobic utizilation of glycerol by E. coli supplemented with fumarate... 32
Figure 3.4 Contrast of experimental data in anaerobic utilization of glycerol by E. coli supplemented with fumarate (dark blue diamond) and simulation data (pick square) (A) formate (B) lactate (C)succinate(D)glycerol(E)fumarate consume(F)acetate(G)ethanol ... 33
Figure 3.5 Fermentation of glycerol by E. coli supplemented with tryptone... 34
Figure 3.6 Contrast of experimental data in fermentation of glycerol by E. coli supplemented with tryptone (dark blue diamond) and simulation data (pick square) (A) glycerol consume (B) ethanol (C) succinate (D) acetate. ... 34
Figure 3.7 Fermentation of glycerol by E. coli expressed foreign gene dhaB from Klebsiella pneumoniae... 35
Figure 3.8 Contrast of experimental data in fermentation of glycerol by E. coli expressed foreign gene dhaB from Klebsiella pneumoniae (dark blue diamond) and simulation data (pick square) (A) glyceorl (B) 1,3-PDO (C) succinate (D) formate (E) ethanol (F) acetate (G) lactate. ... 35
Figure 4.1 Coefficient of parameters and metabolites concentration: glycerol fermentation plus tryptone (A) tryptone (B) Ethanol (C) Succinate (D) Glycerol (E) NH3 (F) Formate (G) Biomass (H) Lactate (I) CO2... 40
Figure 4.2 Parameters distribution : glycerol fermentation plus tryptone ... 41
Figure 4.3 EFMs Correlation coefficient: glycerol fermentation plus tryptone. ... 41
Figure 4.4 The mode No.81 in glycerol fermentation in medium plus tryptone... 44
Figure 4.5 The mode No.18 in glycerol fermentation in medium plus tryptone. ... 44
Figure 4.6 The mode No.100 in glycerol fermentation in medium plus tryptone... 45
Figure 4.7 The mode No.220 in glycerol fermentation in medium plus tryptone... 45
Figure 4.8 Coefficient of parameters and metabolites concentration: glycerol fermentation plus furmarate ... 46
Figure 4.9 Parameters distribution: glycerol anaerobic utilization plus fumarate... 47
Figure 4.10 EFMs Correlation coefficient: glycerol anaerobic utilization plus fumarate... 47
Figure 4.11 The mode No.320 in glycerol fermentation in medium plus fumarate ... 48
Figure 4.12 Coefficient of parameters and metabolites concentration: glycerol fermentation plus furmarate ... 49
Figure 4.13 Parameters distribution: glycerol fermentation express foreign gene... 50
Figure 4.14 EFMs Correlation coefficient: glycerol fermentation express foreign gene. ... 50
Figure 4.15 The mode No236 in glycerol fermentation expressed foreign gene dhaB... 51
Figure 4.16 Main fermentative pathways involved in the anaerobic fermentation of glycerol in E. coli [33] ... 52
Figure 4.17 Left is performance of strains gay bar represent FHL knock and white bar represent not. Center is Cell growth (close)and glycerol utilization(open), triangle represent FHL knock and square represent not [33]. Right is biomass simulation of FHL deletion :pink represent FHL knock ,dark blue represent not. ... 53
List of Tables
Table 1.1 Capability of glycerol fermentation and distribution of glyDH and 1,3PD-DH in
enterbacterial species... 5
Table 1.2 Glycerol utilization pathway reactions. ... 6
Table 1.3 Microbial pathogenicity and applications which can ferment glycerol... 6
Table 2.1 Enzymes related glycerol utilization in Escherichia coli ... 11
Table 2.2 Coordination of glycerol anaerobic utilized literatures. ... 16
Table 2.3 Example of METATOOL input file‘s reactions. ... 17
Table 2.4 Pathway data about glycerol anaerobic utilization . ... 17
Table 2.5 Numbers of elementary flux modes in different carbon source and conditions. .... 19
Table 2.6 Overall reaction of glycerol fermentation... 19
Table 2.7 Numbers of elementary flux modes in different strategy for E.coli no growth problem... 19
Table 3.1 Experimental data source... 29
Table 4.1 Reaction frequency of EFMs for glycerol fermentation plus tryptone: 33~133... 39
Table 4.2 Reaction frequency of EFMs for glycerol fermentation plus tryptone: 1~32... 42
Table 4.3 Reaction frequency of EFMs for glycerol fermentation plus tryptone: 33~133... 43
Chapter 1 Introduction
1.1 Biological background
1.1.1 World energy crisis
When we concern about the problem in our life, we’ll find that the most important source
will be exhausted and unable to regenerate in a few years. Because the resources are versatile,
it is used as primary energy source.
World energy dependence is mainly depends on limited resource such as coal, oil or
natural gas. With the economic progression, the energy demands are increasing in developed
country and under-development country. According to the report from International Energy
Agency in 2007, the demands are drastically increasing in recent ten years and will keep
surging in the following ten to twenty years, see Figure1.1 (World Energy Outlook, 2007).
Owing to mass demands and the finite resource, the supply of energy falls short of demands.
Figure 1.2 shows the different fuel prices divided by oil prices in relation to the time scale,
which implied that oil price is increasing with time in every way (World Energy Outlook,
2007). It is evident that shortage of this limited natural resource results in energy crisis in the
world. Fortunately, there are renewable energy generated from nuclear, hydro and biomass.
Figure 1.3 shows the renewable energy constitutes about 80% of bio-energy, which was
energy derived from biomass (World Energy Outlook, 2003). Thus the bio-energy may
Figure 1.1 World primary energy demand in the reference scenario. (International Energy Agency, 2007)
Figure 1.2 Assumed ratio of natural gas and implied relation of coal prices to oil prices to oil prices in the reference scenario.
1.1.2 Glycerol for biofuels generation
Biofuels like biodiesel and bioethanol become a biological solution for generating
renewable energy, which convert animal or vegetable oil to useful chemical compound
biodiesel. The chemical structure and the procedure of biodiesel synthesis are shown at Figure
1.4. During the biodiesel production, byproduct glycerol also produced. The glycerol
produced from biodiesel production became competitive compared with those generated from
general glycerol factory.
Glycerol is commonly called glycerine or glycerin which was used as materials for
flexible foams, serves as humectants, and as a thickening agent in liqueurs. Since 2004, the
price of glycerol was cut down dramatically for biodiesel expand vigorously that shown in
Figure 1.5. Overproduction of glycerol changed the strategy of glycerol factory such as P&G,
Uniqema, Dow Chemical and Cognis. Therefore, glycerol was developed for additional role
like sources of hydrogen gas [1] or convert to ethanol [2] for saving the energy crisis.
Previous study showed a lot of research works have been done in application of cellulose
as carbon source to biofuels. But only a few recent efforts have focus on glycerol as microbial
carbon source. Compare with cellulose, glycerol economizes is not only the work of
degradation into small molecular but also cost of operation that shown in Figure 1.6. [3]
Because of its availability, low prices, and high degree of reduction[2], glycerol become
a good resource from biodiesel waste. The biofuels second generation aims to improve the
efficiency of renewable energy production.
Figure 1.5 US biodiesel production and its impact on crude glycerol prices [2]
1.1.3 Microbes utilize glycerol
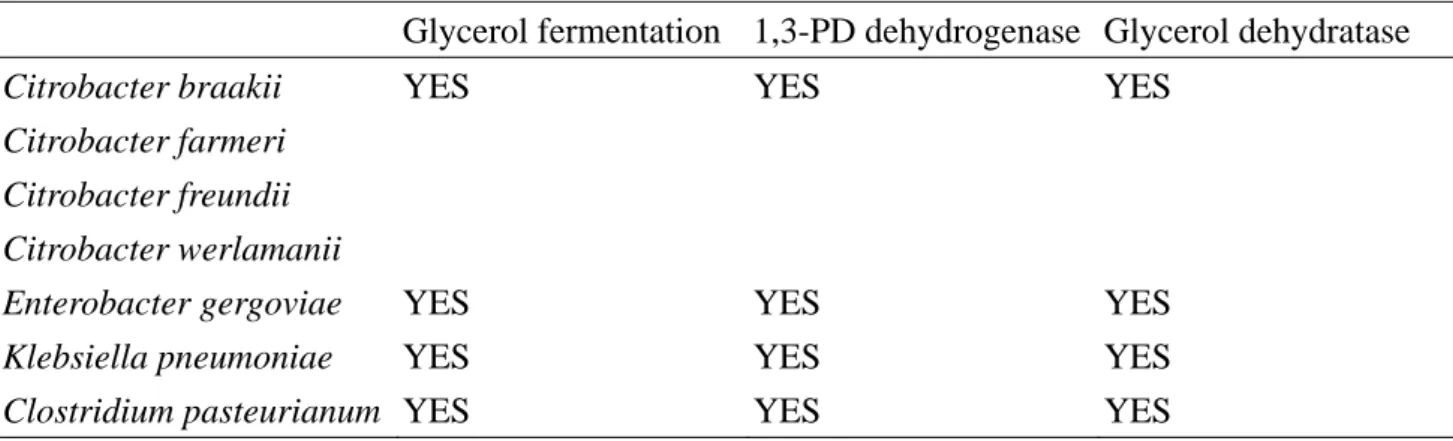
The microbes which using glycerol as carbon source in anaerobic condition have some
characteristics in gene coding enzymes that utilizing glycerol[4]. That showed the capability
of glycerol fermentation are related with 1,3-propanediol dehydrogenase and glycerol
dehydratase. But the pathway of glycerol utilize not only use there two reaction that shown in
Table 1.1, but also have two path that convert glycerol to glycolysis intermediates for growth
biomass and produce fermentation product that shown in Table1.2.they can convert glycerol
to 1,3-propanediol, but the yield of 1,3-propanediol from glycerol is not 100%.becuase of
NADH and NAD concentration spend affected the reactions are reduction or oxidation .
Therefore, glycerol passed through different reactions to achieve chemical and redox potential
balance.
Contrast of their pathogenicity and application shown in Table 1.3, Klebsiella
pneumoniae, Clostridium butyricum, Citrobacter freundii and Enterobacter gergoviae possess intense pathogenicity, Lactobacillus reuteri is better for producing the antibiotic. Because of
them, the safely and more feasible for gene modify microbe, Escherichia coli, that can
ferment glycerol in special condition is suitable to be a biofuels synthesizer and recombinant
host.
Table 1.1 Capability of glycerol fermentation and distribution of glyDH and 1,3PD-DH in enterbacterial species.
Glycerol fermentation 1,3-PD dehydrogenase Glycerol dehydratase Citrobacter braakii
Citrobacter farmeri Citrobacter freundii Citrobacter werlamanii
YES YES YES
Enterobacter gergoviae YES YES YES
Klebsiella pneumoniae YES YES YES
Table 1.2 Glycerol utilization pathway reactions.
Glycerol utilization pathway reactions Aerobic Anaerobic(have
electron acceptor)
Fermentation
glycerol→sn-glycerol-3-p→DHAP→glycolytic intermediates
YES YES NO
glycerol→DHA→DHAP→glycolytic intermediates NO NO YES
glycerol→3-HPA→DHAP→,3-propanediol YES YES YES
Table 1.3 Microbial pathogenicity and applications which can ferment glycerol.
Species Pathogenicity Applications
Klebsiella pneumoniae Pulmonary disease, enteric pathogenicity, nasal mucosa atrophy, and rhinoscleroma
Lactose fermenting, facultative anaerobic
Clostridium butyricum Botulism, tetanus and gas gangrene Toxic chemicals and detergents
Lactobacillus reuteri Anti-microbial agent
Citrobacter freundii In clinical specimens as an opportunistic or secondary pathogen
Ability to convert tryptophan to indole, ferment lactose, and utilize malonate
Enterobacter gergoviae Nosocomial (hospital-acquired) urinary tract infections
1.2 Motivation
In the past, considerable attentions have been paid on issues related to decompose the
cellulose by microbes. However, the procedure of cellulose degradation is complex and
inefficient. Since biodiesel became more and more popular, the major byproduct during
biodiesel production, glycerol, also produced with a large amount. Unlike cellulose, the
structure of glycerol is more ordinary and can be used directly. Therefore glycerol came out to
be an ideal substrate to generate biofuels.
There are many studies on glycerol fermentation in Escherichia coli, previous study
described that glycerol was not fermented in the absent of external electron acceptor. However,
Dharmadi [3]proposeda framework for glycerol fermentation by Escherichia coli which showed using tryptone could affect cell growth, yet tryptone is not electron acceptor and the
mechanism of its effectiveness remains unknown.
Recently, the metabolic engineering began to involve with metabolic pathways and gene
networks to optimize the yield of metabolites required. However, efforts in experiments to
find the beneficial gene for production are too heavy and complicated to execute. Therefore,
we need the mathematical method, especially modeling, to facilitate the metabolic
engineering implementation. Constructing models using the experimental data combined with
chemical and physical knowledge could simulate the behavior of cell and even economize on
complicated experiments by reasonable gene selection. Besides, studies on gene expression
and enzyme activity dominating metabolites synthesis usually focus on only one enzyme or
metabolites, which may overlook the complexity within a cell. Systematic analysis has
gathered great importance in recent years. Integrating all its aspects into glycerol anaerobic
utilization by Escherichia coli could verify the results more correctly.
Figure 1.7 systems flow of Modeling and Analysis of Glycerol Anaerobic Utilization by Escherichia coli
1.3 Research goals
The purpose of this study was to investigate the mechanism of glycerol anaerobic
utilizing in Escherichia coli, computational anticipation of glycerol anaerobic utilization, and
1.3.1 Mechanism of glycerol anaerobic utilizing in Escherichia coli
The specific research question in this study addressed concerns on why Escherichia coli
couldn’t immediately ferment glycerol in anaerobic condition and how to solve the problem
with different strategies such as replenish tryptone, fumarate, or foreign gene transformation.
The methods in previous projects for different objective exists some disadvantages when
producing ethanol. Besides, the purpose of those experiments is not for ethanol production.
However, the strategies have been proved by many literatures that they actually work in
Escherichia coli.
Elementary flux modes (EFM) analysis was used to count the possible way of metabolic
systems in the metabolic analysis of central carbon. The EFM analysis obeyed the
physiological rule, such as the law of conservation of mass. Using elementary flux modes
(EFM) analysis can indicate the different condition of possible routes from the external
carbon source to the end product. Compared with high yield modes, low yield modes can
clearly illustrate the relation between metabolic flux distribution and products yield.
1.3.2 Computational prediction of glycerol anaerobic utilization
The next part of the analysis used hybrid model to extend elementary flux modes
usability and can be differ from previous study about elementary flux modes. Previous studies
calculate elementary flux modes to represent the whole systems reaction flux distribution, in
which each mode will multiply one independent parameter. This did not express metabolic
systems characteristics such as the fluctuation of time scale dependant metabolites
concentration. The hybrid model methods not only contain the time dependant parameters but
also reveal enzyme kinetic based knowledge like Michaelis–Menten kinetics [5].
The parameters have to fit experimental data to construct the computational model that
compared with general data are similar, it can be told that parameters fitted correctly and
reflected the real experiment.
1.3.3 Verification of simulation derived from constructed model
The model accuracy is of importance when used to predict cell behavior in real system.
The process of verifying the model makes it reliable with biologist. When models are used to
evaluate strategies in experiments, the results of evaluation is usually made to a fundamental
model representing a cellular system, from which systems could be modified and work.
Sensitivity of parameters quantified the correlation between parameters and model’s
variables. The significance of parameters affecting whole systems can be found. Besides, the
parameters distribution also implied the tendency of model system. For example, the specific
reaction became momentous role when condition changed. The analysis of parameters
accompanied with the evidence of gene modification experiments together demonstrate the
anaerobic condition of Escherichia coli system utilizing glycerol is an authentic way when
predicting the work of Escherichia coli behaviors.
Chapter 2 Pathway investigation of glycerol
anaerobic utilization by Escherichia coli
2.1 Introduction
2.1.1 Glycerol related reaction in Escherichia coli
Using glycerol for generating biofuels is a new strategy differs from cellulose as carbon
source in Escherichia coli last three years. The major variation of these two carbon source is
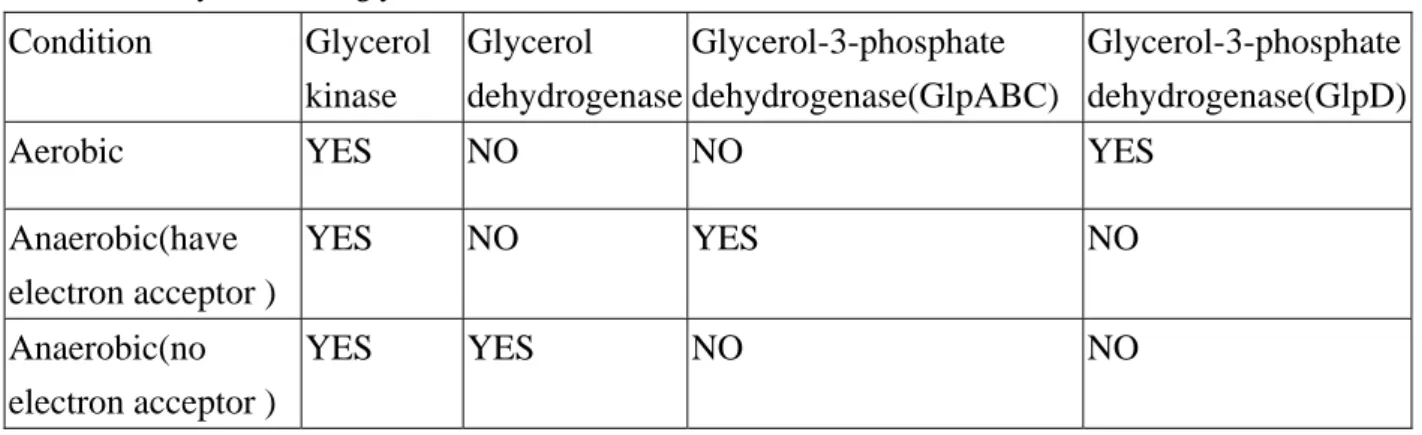
the reactions of convert substrate to glycolytic intermediate. Glycerol was through glycerol
kinase or glycerol dehydrogenase in different conditions. When the environment presents
electron acceptor, glycerol converted to sn-glycerol -3-phosphate. After then, sn-glycerol
-3-phosphate transferred to dihydroxyacetone phosphate by glycerol-3-phosphate
dehydrogenase, which only express in anaerobic condition shown in Table 2.1.
Previous study showed glycerol fermentation can not take place in Escherichia coli.
Escherichia coli grow under anaerobic conditions in a mixture of glycerol together with nitrate or fumarate. However, recent research [3] showed that Escherichia coli undergo
glycerol fermentation when tryptone added and they prove that tryptone is not electron
acceptor by NMR spectra. Yet if tryptone is absent, Escherichia coli can not grow in this
condition. According to these studies, we proposed that the tryptone is taken as a cell’s
biomass growing source, from which some redox compounds was provided to push metabolic
Table 2.1 Enzymes related glycerol utilization in Escherichia coli Condition Glycerol kinase Glycerol dehydrogenase Glycerol-3-phosphate dehydrogenase(GlpABC) Glycerol-3-phosphate dehydrogenase(GlpD)
Aerobic YES NO NO YES
Anaerobic(have electron acceptor ) YES NO YES NO Anaerobic(no electron acceptor ) YES YES NO NO
Figure 2.1 Subset of glycerol anaerobic utilization pathway in Escherichia coli.
2.1.2 Elementary flux modes
Because of detailed investigation of genome and enzyme in Escherichia coli, the
and survival[6]. When intracellular substrates and enzymes presented under suitable condition,
the enzyme catalyzed reaction is not restricted by simple decisions. Few routes in metabolic
pathway couldn’t represent the whole metabolic pathway. Leiser and Blum [7] proposed the
“fundamental modes ”can be decomposed to a linear structure as a model of elementary flux
modes. In a biochemical reaction systems distinguish between border reactions and internal
reactions. Border reactions and internal reactions can be distinguished in a biochemical
reaction system such as glucose that be feed on E.coli, or ethanol flow from E.coli. A
chemical reaction possess two direct that called the reversible reaction because of enzyme
capability, free energy of reactions, and push form the environment. If the reaction is
reversible, the numbers of path that elementary mode analyses calculated will be increase.
The principle of elementary flux mode is finding the immediate path from substrate to end
product, and the numbers of elementary flux mode represent all of possible cell behavior in
metabolic pathway. Which elementary flux mode related to different end product in metabolic
pathway such as biomass, ethanol, acetate and lactate, is commentated by biological
knowledge.
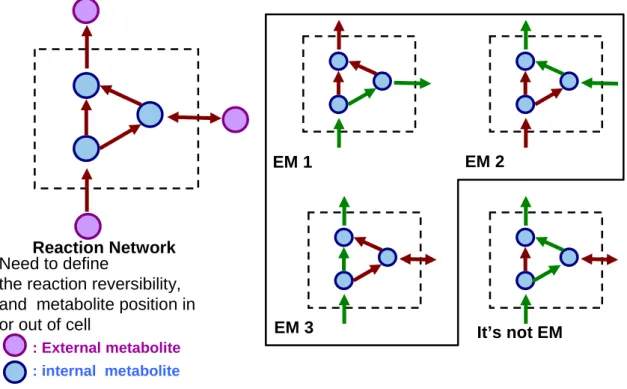
The route from external metabolite go through the direct reactions to the end product
shown in Figure 2.1, and every elementary flux modes that is not cyclic have at least one
input and one output flux, which allowed multiple compounds in one reaction. The possible,
complex pathways in a cell were thought to indicate cell flexibility and robustness to adapt
with optima fitness to the environmental conditions by integrating the use of preferable
pathways. One of the aims for elementary flux modes was to assign anabolic and catabolic
costs to make benefits in different environments[8]. Another aim was to reduce the intricate
metabolism to a simple linear path with different properties[9].
Besides, there are various extensions of the elementary flux modes such as
thermodynamics rules[9], optimal conversion yields[10] and simulation by multiplying an
Reaction Network
EM 1 EM 2
EM 3 It’s not EM
Need to define
the reaction reversibility, and metabolite position in or out of cell
: External metabolite : internal metabolite
Figure 2.2 Simple example of a biochemical network of elementary flux modes (O.Palsson ,systems biology :properties of reconstructed networks).
2.1.3 Different bacterium glycerol utilize pathway
The reactions of microbes shown in Table 1.1 compare to Escherichia coli are something
different. Figure 2.3 and Figure 2.4 show major reactions of glycerol utilization in
Escherichia coli and Klebsiella pneumoniae. The reactions in red frame are crucial role for glycerol fermentation, which involves two enzymes as glycerol dehydratase and
1,3-propanediol dehydrogenase. Glycerol dehydratase convert glycerol to
3-hydroxypropionaldehyde and liberate water as electron acceptor that could make up for the
lack of electron acceptor in Escherichia col. By genetic engineering, these two foreign genes
imported from Klebsiella pneumoniae to Escherichia coli could make the latter one ferment
ISBLab - Integrative Systems Biology Laboratory
Glycerol 3-HPA 1,3-PDO
Dihydroxyactone Biomass Dihydroxyactonephosphate ATP ADP PEP Pyruvate Acetyl-CoA Acetaldehyde Acetyl-P Acetoin 2,3-Butanediol Formate H2 CO2
Acetic acid Ethanol
Lactic acid CoA Succinic acid H2O NADH2NAD+ NAD+ NADH2 NAD+ NADH2 NAD+ NADH2 NAD+ NADH2 2NAD+ 2NADH2 Pyruvate 2CO2 NADH2 NAD+ NADH2 NAD+ CoA Pi NAD+ NADH2 H2 CO2 CO2 NAD+ NADH2 ATP ADP ATP ADP ATP ADP ADP ATP NADH2 NAD+ p
Figure 2.3 Subset of glycerol fermentation pathway in Klebsiella pneumoniae. Reactions differ from Escherichia coli with red frame.
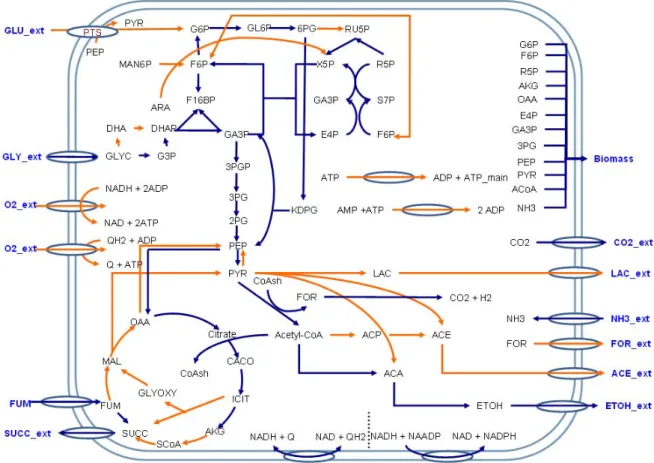
2.1.4 Large- scale metabolic network
In microbes, the arrangement of cell is intricate and complicated. Although the key
section could explain specific movement, their large-scale structure remains unknown[12].
Trinh’s[13] E. coli central metabolic network shown in Figure 2.4, which includes
glycolysis, gluconeogenesis, pentose phosphate pathway, tricarboxylic acid cycle,
fermentative acid pathway, anapleurotic pathway, entner-doudoroff pathway, degradation
pathways of pentoses and hexoses, oxidative phosphorylation, maintenance energy,
membrane transport, and biomass synthesis. About 70 reactions that can describe major
Figure 2.4 Metabolic map of E. coli central metabolic network. [13]
2.2 Related work
Early research developed process shown in Table 2.2. At first, researchers proposed that
E.coli can not ferment glycerol as external electron acceptor to grow unless fumarate of nitrate was used as an exogenous hydrogen acceptor[4].
Later, other species such as K. pneumoniae, C. butyricum and C. freundii expand
glycerol fermentation to 1,3-propanediol, and the major products are 1,3-propanediol and
ethanol. Besides, researchers studied on how to improve the yields of 1,3-propanediol. They
also found that K. pneumoniae couldn’t produce 1,3-propanediol only, because of the balance
between biomass growth and reduction potential.
pneumoniae to wild-type Escherichia coli. They successfully construct a recombinant E.coli by importing dha regulon, and found that the growth is not luxuriant. Later, researchers
cloned dhaB from Citrobacter freundii and used it to improve E.coli growth[15].
Last three years, Dharmadi used a medium containing high concentration of yeast
extracts and tryptone, on which E.coli can grow with glycerol under anaerobic condition [3].
Table 2.2 Coordination of glycerol anaerobic utilized literatures.
Condition Description Ref.
No growth Requires electron acceptors [4]
Plus fumarate Fumarate, as an exogenous hydrogen acceptor. [4]
Plus tryptone Using a medium containing high concentrations of yeast extract and tryptone.
[3]
Other species Ability to grow fermentatively on glycerol without an exogenous hydrogen acceptor
[16, 17]
Foreign gene express in E.coli
Their purpose for clone dha regulon genes to E.coli producing 1,3-propanediol
[14, 15, 18]
Plus glucose Glucose will be uptake first and become major carbon source
2.3 Motivation and the Specific aim
With previous study on glycerol anaerobic utilization in Escherichia coli, we use
elementary flux modes analysis to explain why Escherichia coli can not grow in glycerol
under anaerobic condition. And then we calculate the possible yields in each mode using
different strategy for Escherichia coli glycerol anaerobic utilization.
2.4 Materials and methods
That calculated all EFMs using METATOOL 5.0, Matlab-based software package for fast
and flexible elementary modes analysis. [19]
metabolic network we concerned like Table 2.3. The second is reversibility of enzymes of
reactions, express which reaction can react in reverse directly. And the final part is position of
metabolite, which described which metabolite was used as end product and initial substrate.
To construct three METATOOL file for calculate elementary flux mode, there are glycerol
fermentation with tryptone added medium, glycerol anaerobic utilization with fumarate added
medium, and glycerol fermentation in E.coli which expressed foreign gene dhaB. The
knowledge of reactions and enzymes was shown in Table 2.4.
Table 2.3 Example of METATOOL input file‘s reactions.
No. Reaction
GG1 GLC_external + PEP = G6P + PYR GG2r G6P = F6P
GG3 F6P + ATP = F16BP + ADP
Table 2.4 Pathway data about glycerol anaerobic utilization .
Data description Ref.
Metabolic map of E. coli central metabolic network [13]
Glycerol degradation pathway [3, 6]
1,3-propanediol production pathway [14, 15]
.
2.5 Results
In this section, explanations of cell growth condition are investigated by elementary flux
modes analysis. The ideality yields of each condition are discussed for high yields mode and
low yields mode. Finally, the selected mode with both high biomass and high ethanol yields
2.5.1 Numbers of elementary flux modes
Verifying to previous study find that E.coli can not directly grow in anaerobic condition
that absence external electron acceptor. Compare to other carbon source, numbers of EFMs
shown in Table 2.5.the numbers of Glucose is more than the others, obviously E.coli had
place importance on digest glucose. See the glycerol part , the numbers of EFMs is very few
and the EFMs related biomass is zero ,that show E.coli can not grow in this condition , it
correspond to previous study.
This analysis used EFMs in glycerol fermentation in E.coli is directly explain that only
glycerol as carbon source would not be utilized to generate biomass. Compare to E.coli,
Klebsiella pneumoniae only add two reactions, but its numbers of EFMs are 1762.
The biological significant of each carbon source in anaerobic condition is present in the
numbers of EFMs, which E.coli feed on glucose contain 5010 EFMs more than feed on other
carbon source ,because of preferable import channel such as phosphoenolpyruvate
phosphotransferase system provide more efficiently and more important with carbon source.
Because of the coenzyme NADH and NAD+ are key role of some reactions that include
in biomass growing , if NADH had not generate from reactions ,the biomass reactions can not
obtain the require compound, that didn’t grow biomass at all.
The different strategies of glycerol anaerobic utilization have a common ground about
electrons transformation, first is tryptone provide biomass growing factor: NADH generated
to push glycerol dehydrogenase activate, second is fumarate convert to succinate and accept
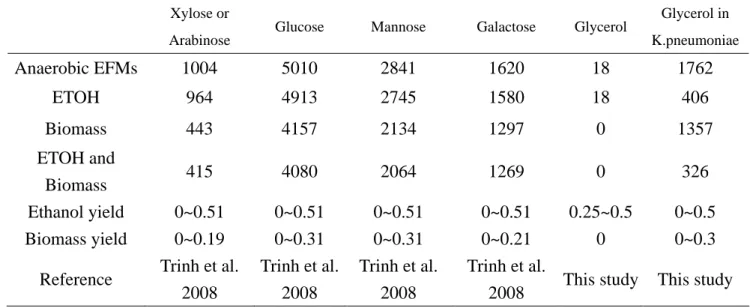
Table 2.5 Numbers of elementary flux modes in different carbon source and conditions. Xylose or
Arabinose Glucose Mannose Galactose Glycerol
Glycerol in K.pneumoniae Anaerobic EFMs 1004 5010 2841 1620 18 1762 ETOH 964 4913 2745 1580 18 406 Biomass 443 4157 2134 1297 0 1357 ETOH and Biomass 415 4080 2064 1269 0 326 Ethanol yield 0~0.51 0~0.51 0~0.51 0~0.51 0.25~0.5 0~0.5 Biomass yield 0~0.19 0~0.31 0~0.31 0~0.21 0 0~0.3
Reference Trinh et al. 2008 Trinh et al. 2008 Trinh et al. 2008 Trinh et al.
2008 This study This study
Expect the biomass reactions part, the EFMs’s overall reaction descript that glycerol
fermentation is inclined to produce ethanol shown in Table 2.6.
The preliminary elementary flux modes for three part of glycerol utilization in E.coli
presented in Table 2.7, that depicted the three condition for E.coli are more likely to produce
ethanol or grow more biomass such as glycerol + tryptone the ratio of EFMs of
biomass/anaerobic are very high, that obviously said grow in glycerol + tryptone exuberant.
Table 2.6 Overall reaction of glycerol fermentation.
EFMs ratio Overall reaction
6/18 GLYCEROL_ext = H2_ext + ETOH_ext + CO2_ext
6/18 2 GLYCEROL_ext = H2_ext + ETOH_ext + SUCC_ext
6/18 GLYCEROL_ext = ETOH_ext + FOR_ext
Table 2.7 Numbers of elementary flux modes in different strategy for E.coli no growth problem
Glycerol + tryptone Glycerol + fumarate Glycerol +1,3 PDO pathway
Anaerobic EFMs 442 1952 1762
Ethanol 114 940 406
2.5.2 Relationship between yields of biomass and ethanol
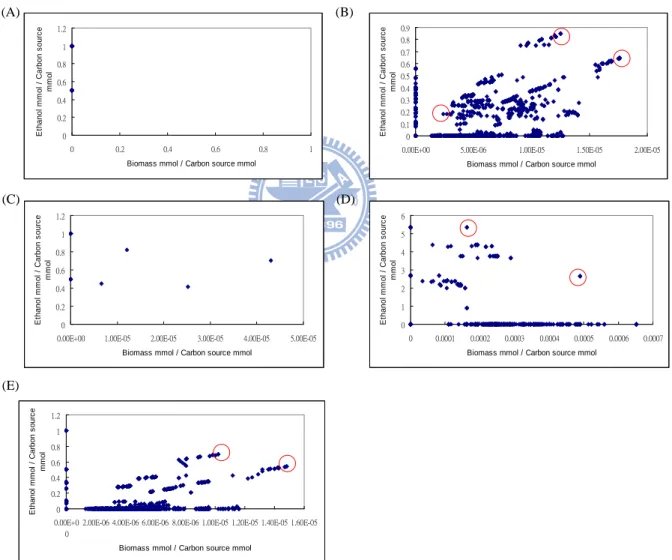
That detail concern the yields of each modes, we can see Figure 2.5 (B), that three of
blots descript the best ethanol produce mode, best biomass grow mode, and blank mode to
compare to others. The modes include what reaction shown in Figure 2.6 ~ Figure 2.8, those
reactions different in obviously in Figure 2.6 and Figure 2.7 are Entner-Doudoroff pathway,
and different in Figure 2.8 are respiration (anaerobic) pathway and produce acetate acid. It
shows a relationship of biomass and Entner-Doudoroff pathway.
0 0.2 0.4 0.6 0.8 1 1.2 0 0.2 0.4 0.6 0.8 1
Biomass mmol / Carbon source mmol
E tha no l m m ol / Ca rbo n s o ur c e mm o l 0 0.1 0.2 0.3 0.4 0.5 0.6 0.7 0.8 0.9
0.00E+00 5.00E-06 1.00E-05 1.50E-05 2.00E-05 Biomass mmol / Carbon source mmol
E tha no l m m ol / Ca rbo n s o ur c e mm o l 0 0.2 0.4 0.6 0.8 1 1.2
0.00E+00 1.00E-05 2.00E-05 3.00E-05 4.00E-05 5.00E-05 Biomass mmol / Carbon source mmol
E tha nol m m ol / Ca rbon s o ur c e mm o l 0 1 2 3 4 5 6 0 0.0001 0.0002 0.0003 0.0004 0.0005 0.0006 0.0007 Biomass mmol / Carbon source mmol
E tha nol m m ol / Ca rbon s o ur c e mm o l (A) (B) (C) (D) 0 0.2 0.4 0.6 0.8 1 1.2 0.00E+0 0
2.00E-06 4.00E-06 6.00E-06 8.00E-06 1.00E-05 1.20E-05 1.40E-05 1.60E-05
Biomass mmol / Carbon source mmol
E tha nol m m ol / C ar bon s our c e mmo l (E)
Figure 2.5 Yields of biomass and ethanol (A) Modes of glycerol anaerobic utilization in medium plus fumarate which relate only glycerol (B) Modes of glycerol anaerobic utilization in medium plus fumarate which relate fumarate and glycerol (C) Modes of glycerol fermentation in medium plus tryptone which relate only glycerol (D) Modes of glycerol fermentation in medium plus tryptone which relate glycerol and tryptone (E) Modes of glycerol fermentation in recombinant E.coli.
Compare the others condition, the modes of most high ethanol yields and most biomass
growing are similar to above conditions. Correspond to our purpose, that Entner-Doudoroff
pathway is related with biomass growing.
Figure 2.7 The mode of most high yields of biomass in glycerol anaerobic utilization in medium plus fumarate.
Figure 2.9 The mode of which most high yields of ethanol is in glycerol fermentation express foreign genes.
Figure 2.11 The mode of which most high yields of ethanol is in glycerol fermentation in medium plus tryptone.
2.6 Summery
The yields of product are important for factory to produce a large amount, investigating
possible yields use elementary flux mode that provide valuable information.
Above all, the analysis indicated the reason about E.coli glycerol fermentation absence
electron acceptor problem, no any biomass growing mode in elementary flux mode analysis,
so we can correspond to previous study, and them which reason about biomass no growth may
be some redox factor like NADH is scanty, so we find the solution strategy from previous
research that consist three part, first is cultivating E.coli in medium plus electron acceptor like
fumarate , second is cultivating E.coli in medium plus tryptone for biomass growing , third is
cultivating E.coli express foreign gene dhaB from Klebsiella pneumoniae.
The analysis of elementary flux mode about the glycerol pathway shown the mold of
high yields pathway, and we show the pathway that is most high yields, descript the possible
Chapter 3 Modeling and simulation of glycerol
anaerobic utilization behavior in Escherichia coli
3.1 Introduction
3.1.1 Modeling for metabolic engineering
Metabolic engineering consist of two parts. One is the development of strategies for
control pathways in microbes, and the other use actual biotechnological experiments to
complete such strategies [20]. In other words, there are theories and execution involve in
metabolic engineering. This study is critically important in considerable decision for
implementation of efficient experiments.
Besides, metabolic engineering has a large amount experiment for change expression
level of gene, or the different condition for specific enzyme activity. Prediction not only
implies the result of experiments, but also explains the biological significant for complex
biochemical experiments.
The relationship between substrates in a chemical reaction can be summarized
quantitatively by stoichiometry [21]. When breaking metabolic network down into a
stoichiometric matrix, the rows and columns in the matrix represent participated chemicals
and reactions themselves, respectively. To infer the possibilities from the metabolic network,
recent study work on two approaches, that is extreme pathways and elementary mode analysis
3.1.2 Simulation of biological systems
The simulations of biological systems contain three aspects such as gene regulatory
network, metabolic pathway, and signal transduction pathway. Three parts represent
intracellular behavior fundamental elements that are gene, protein, and metabolite.
Large-scale simulations regenerate gene expression and how many genes are regulated, genes
possessed translation to protein that will bind to other protein or react with chemical
compounds, called protein-protein interaction and metabolic pathway. But the transition of
each fundamental element is difficult problem for scaling the heterogeneous data and
parameters. Therefore, the research focus on one part of aspect ignored other part’s influence.
The usage of simulation are confirming the corresponding of mathematical model with a
set of experimental data, predicting the behavior that experiments didn’t prove , and the
biological significant of cell behaviors[23].
3.2 Related work
3.2.1 Flux balance analysis (FBA)
Flux balance analysis is a different way to simulate the metabolic network using linear
programming. There’s only single solution resulted from flux balance analysis, which differs
from elementary mode analysis and extreme pathways. Because linear programming is
usually used to get the maximum potential from the objective function investigated, single
solution became ideal for the optimization problem when using flux balance analysis [24].
When approaching flux balance analysis, only metabolites entering or leaving particular
fluxes along with the enzymes ranging from negative to positive value.
3.2.2 Enzyme kinetic
Enzyme kinetic is research of relation of enzyme and substrate. When substrate bond to
enzyme, the protein structure of enzyme were changed and the activity of enzyme responded
binding affinity.
The Michaelis–Menten equation relates the initial reaction rate v0 to the substrate
concentration. The corresponding graph is a hyperbolic function; the maximum rate is
symbolized as Vmax.
The number of reactions per second catalyzed per mole of the enzyme was defined as
reaction rate and symbolized as V. According to Michaelis–Menten equation, the reaction rate
increases when substrate concentration increasing and the maximum rate may approach to
Vmax.
3.3 Motivation and the Specific aim
Simple elementary flux modes is topological analysis of metabolic network, it doesn’t
realize the cell behavior such as time dependant metabolite concentration. And the simulation
of metabolite concentration is vital to the biologist because of cell dynamic change can tell us
much valuable information. So we expand the elementary flux modes using hybrid method
which Kim[25]develop, correctly simulate time series data similar to experiments.
3.4 Materials and methods
There are result of elementary flux mode analysis, and experimental data from literatures,
using the hybrid model that combined EFMs and enzyme kinetic base parameters of
3.4.1 Experimental data source
Experimental data were collected from literature, shown in Table3.1, include Glycerol
fermentation in medium add tryptone, express foreign gene dhaB from Klebsiella pneumoniae,
and cultivate in medium which contain fumarate.
Table 3.1 Experimental data source.
3.4.2 Method of hybrid model
Kim and his group [25] used the elementary flux mode decomposition to express the
reaction rate vector by
Z is the matrix represents all of elementary flux modes. For example, when we have 4
reactions that contain 8 elementary flux modes, Z is a 4 X 8 matrix. then rM is each EFMs
regulated uptake rate vector, that represent each of EFMs multiply regulated uptake rate
vector will get each reactions rate depend times. And metabolite concentration can be
calculated by each reaction rate.
rM defined in Figure 3.1,that show rM is similar to enzyme kinetic model:
Michaelis–Menten kinetics [5].
Data description Reference
Glycerol fermentation add tryptone [26]
Recombinant E.coli which can produce 1,3 PDO [27]
Ki is the saturation constant,
e
i is the enzyme level for elementary flux mode, and kmax ismaximum uptake rate of elementary flux mode. Detailed explain shown in Figure 3.1, first we
got the EFMs like matrix contain amount of EFMs and the reactions in this network, second
we generated transposed matrix and use initial parameters for calculate the regulated flux
vector rM, third carried matrix multiplication out .finally we can get the reaction rate in
procession .Reaction rate provide how fast of substrate transform to product, that were
influenced by temperature, pH value, cofactor, inhibitor and other environment variables. The
end product concentration can be calculated by reactions rate of each reactions. For example,
the reaction rate V0 that dependant times, and the product B initial concentration x. when next
time step B concentration is x +V0.
1 2 3 = 1 2 3 1 2 3 1 0 0 1 0 0 0 1 0 0 1 0 0 0 1 0 0 1 = > 1 0 0 0 1 0 0 0 1 1 0 0 0 1 0 0 0 1 1 0 0 0 1 0 0 0 1 1 0 0 0 1 0 0 0 1 1 2 3 4 5 6 EFM1 EFM2 EFM3
rm: the regulated uptake rate vector
1 2 3
4
5 6
r: the reaction rate vector
T
EFM3 EFM2 EFM1
Experiment data
Simulation data
Compare the residual
between simulation
and experiment data
if
residual >desirable value
Yes
NO
Revise parameters
model
Parameters successfully
identify
Figure 3.2 Schema of parameters identification.
But this result of simulation is worse because of parameters didn’t match with
experimental data. Therefore, we have to train the parameters of model shown in Figure 3.2,
because of the parameters involve in the kinetic base, that need the solver for nonlinear least
square problem, using Tomlab ,matlab package software that is powerful optimization
platform and modeling language for solving applied optimization problems in Matlab.
The training flow need a threshold residual for confirm the parameters quality, the
residual represent the distance different with simulation and experimental data. If residual
value bigger than threshold value, parameters will alter for decrease residual. When
parameters smaller than threshold value, that we can called the parameters successfully
3.5 Results
The results show experimental data in different conditions that contain of metabolite
concentration disputant times, which include formate, succinate, glycerol, fumarate, biomass,
lactate, and ethanol. Figure 3.3 ,Figure3.5 and Figure3.7 illustrate the experimental data from
literature that rough descript the yields of each metabolite .and them Figure 3.4 ,Figure3.6 and
Figure3.8 depicts the comparisons of metabolite experimental data and simulation data from
our model generated, which the variation of predict data and real data was small when the
metabolite concentration is not too small to calculate, and see the Figure 3.4 (B), the variation
seem very large , but the real variation compare with others is very small.
In this study, the model construction fit to experimental data was successful to simulate
the quality data.
lactate lactate formate formate succinate succinate glycerol glycerol fumarate fumarate ethanol ethanol biomass biomass mM /g cell dr y w e ight Time (m) 0 50 100 150 200 250 300 350 400 450 500 0 20 40 60 80 100 120 140
0 0.05 0.1 0.15 0.2 0.25 0.3 0.35 0.4 0.45 0 0.5 1 1.5 2 2.5 0 50 100 150 200 250 300 350 400 450 500 0 0.5 1 1.5 2 2.5 0 50 100 150 200 250 300 0 0.5 1 1.5 2 2.5 0 50 100 150 200 250 300 0 0.5 1 1.5 2 2.5 0 50 100 150 200 250 300 350 400 0 0.5 1 1.5 2 2.5 0 1 2 3 4 5 6 0 0.5 1 1.5 2 2.5 5.6 5.8 6 6.2 6.4 6.6 6.8 0 0.5 1 1.5 2 2.5 (A) (D) (B) (C) (E) (F) (G)
Figure 3.4 Contrast of experimental data in anaerobic utilization of glycerol by E. coli supplemented with fumarate (dark blue diamond) and simulation data (pick square) (A) formate (B) lactate
(C)succinate(D)glycerol(E)fumarate consume(F)acetate(G)ethanol
In Figure 3.3, formate and succinate are major end product, and the concentrations of
glycerol decrease parallel with fumarate. Moreover, fumarate respiration net reactions contain
H2 + Fumarate --, Succinate and HCO2- + Fumarate + H + ~ CO2 + Succinate, that two
reactions end product agreement with experimental data [31].
The simulation shown in Figure 3.4, the direct comparisons experimental data
perturbation more than simulation because of the simulation prefer the linear values than large
0 5 10 15 20 25 0 20 40 60 80 100 120 glycerol glycerol ethanol ethanol succinate succinate acetate acetate M /g cell dr y w e ight Time (h)
Figure 3.5 Fermentation of glycerol by E. coli supplemented with tryptone
0 50000 100000 150000 200000 250000 300000 350000 0 20 40 60 80 100 120 0 50000 100000 150000 200000 250000 300000 350000 0 20 40 60 80 100 120 0 1000 2000 3000 4000 5000 6000 7000 8000 9000 0 20 40 60 80 100 120 0 1000 2000 3000 4000 5000 6000 7000 8000 0 20 40 60 80 100 120 (A) (C) (D) (B)
Figure 3.6 Contrast of experimental data in fermentation of glycerol by E. coli supplemented with tryptone (dark blue diamond) and simulation data (pick square) (A) glycerol consume (B) ethanol (C) succinate (D) acetate.
0 1 2 3 4 5 6 7 8 9 10 0 5 10 15 20 25 30 acetate ethanol lactate succinate formate 1,3 -PDO mM /g ce ll dr y w e igh t Time (h)
Figure 3.7 Fermentation of glycerol by E. coli expressed foreign gene dhaB from Klebsiella pneumoniae.
0 20 40 60 80 100 120 0 10 20 30 0 0.1 0.2 0.3 0.4 0.5 0.6 0.7 0 10 20 30 0 1 2 3 4 5 6 7 0 10 20 30 0 0.5 1 1.5 2 2.5 3 3.5 0 10 20 30 0 0.5 1 1.5 2 2.5 3 3.5 0 10 20 30 0 1 2 3 4 5 6 7 8 9 10 0 10 20 30 0 1 2 3 4 5 6 7 8 9 0 10 20 30 (A) (B) (C) (D) (E) (F) (G)
Figure 3.8 Contrast of experimental data in fermentation of glycerol by E. coli expressed foreign gene dhaB from
Klebsiella pneumoniae (dark blue diamond) and simulation data (pick square) (A) glyceorl (B) 1,3-PDO (C) succinate (D) formate (E) ethanol (F) acetate (G) lactate.
3.6 Summery
This section extends above part of elementary flux mode, and we construct the dynamic
model. This model contains the previous study method called hybrid method combine the
elementary flux mode and enzyme kinetic base equation. Let the model work, we have to
identify parameters in kinetic equation. Therefore the experimental data for glycerol
anaerobic utilization in different condition was used to test the parameters can successfully
push the model to simulate data that similar to experimental data.
The results of simulation are very similar to experimental data, the model we construct
Chapter 4 Model verification and validation
4.1 Introduction
4.1.1 Parameter sensitivity analysis
The study about how to assign the uncertainty in the output of a mathematical model to
different sources of variation in the input of a mathematical model either qualitatively or
quantitatively is called sensitivity analysis (SA).[32]
Generally, when studies include some form of mathematical modeling, uncertainty and
sensitivity analyses was usually used to check the robustness of a study. Uncertainty analysis
studies the overall uncertainty in the conclusions of the studies, while sensitivity analysis
identifies which source of uncertainty weights more in the conclusions. Several guidelines for
impact assessment or for modeling have used sensitivity analysis as a tool to make sure the
reliability of the modeling or assessment. [32]
4.1.2 Correlation of flux and parameters
The correlation between two homogenous or heterogenous data indicated the
perturbation of one part, the effect affect to others. This information can tell us the intensity of
factory we concern, for example, hair style and gender are related; long hair people tend to be
girl than short hair people. But the relation is not 100 percentages.
Correlation applies for quantifiable data that numbers contain significant, usually
4.2 Results
In this section, we demonstrate the verification of model’s parameters and provide one
case study to promote creditability of glycerol fermentation model. It can be seen that each
parameters how much of strength influence the metabolites concentration. Because of values
disproportion, parameters distributions incline to distinguish into confusion part and
limitation part. More specifically, the similarity of EFMs affect the strength is worth while to
discussion.
4.2.1 Parameters analysis and correlation coefficient between EFMs
The parameters have a primary role in mathematical model and greatly influence how the
cell behavior be simulated.
About the control effect of parameters, Figure 4.1 illustrate the strange of parameters can
be separated to a subset that has high coefficient, although the parameters didn’t have high
coefficient for every metabolite, tend to prefer high coefficient. Because of the trend, select
one of mode that correspond high coefficient parameter’s shown in Figure 4.4.Compare with
Figure 2.11 and Figure 2.12, the reactions are a lot of different such as produce acetate and
succinate ,and no ethanol produce. Studies should be undertaken to determine the frequency
of each reactions operating shown in Table 4.1.the high frequency reactions such as F16BP =
F6P, GL6P = 6PG, 6PG + NADP = R5P + CO2 + NADPH, and glycolysis pathway are more
consistent than the fermentative pathway , that explain the major trunk pathway and branch
Table 4.1 Reaction frequency of EFMs for glycerol fermentation plus tryptone: 33~133
GG1 GG3 GG4 GG11 GG12 GG13 PPP2 PPP3 TCA1 TCA2r FR1
0 0 1 0.87 0 0.48 1 1 0.95 0.95 0.58
FR2 FR3 ANA1 ANA2 ANA3 FEM1 FEM2 FEM7 FEM8 FEM3 FEM5
0.63 0.63 1 0.19 0 0.49 0.19 0.25 0.25 0.13 0.12
FEM6 FEM4 FEM9 EDP1 EDP2 XYL1 XYL2 GAL1 MAN1 MAN2 ARA1
0.25 0.49 0.13 0 0 0 0 0 0 0 0
BIO OPM4r FC2 TRA1 TRA2 TRA3 TRA4 TRA5 TRA6 TRA7 GLB1
0.95 0.51 0 0.25 0.44 0.95 0.13 0.69 0 0.55 0.24
GLB2 TRA8 TRA9 TRA10 GLYD1 GLYD2 GLYD3 GLYD4 OPM3 TRYP GG2r
0.24 0 0 0 1 0 1 1 0 1 1
GG5r GG6r GG7r GG8r GG9r GG10r PPP1 PPP4r PPP5r PPP6r PPP7r
1 1 1 1 1 1 1 0.69 1 0.68 0.68
PPP8r TCA3r TCA4 FC1r
0.68 0.95 0.95 1
Moreover, the reaction rate is equal to parameters multiply elementary flux mode, the
parameter value is an important characteristic of reaction rate. Figure 4.2 depict the
parameters value express in logarithm and normal bar chart. It alteration of parameters in low
coefficient part is small compare with high coefficient part in logarithm bar chart, and the
0.00E+00 1.00E-02 2.00E-02 3.00E-02 4.00E-02 5.00E-02 6.00E-02 7.00E-02 8.00E-02 9.00E-02 1 23 45 67 89 111 133 155 177 199 221 243 265 287 309 331 353 375 397 419 441 0 200 400 600 800 1000 1 22 43 64 85 106 127 148 169 190 211 232 253 274 295 316 337 358 379 400 421 442 0 50 100 150 200 250 300 350 400 1 22 43 64 85 106 127 148 169 190 211 232 253 274 295 316 337 358 379 400 421 442 0 20 40 60 80 100 120 1 22 43 64 85 106 127 148 169 190 211 232 253 274 295 316 337 358 379 400 421 442 0.00E+00 1.00E-02 2.00E-02 3.00E-02 4.00E-02 5.00E-02 6.00E-02 7.00E-02 8.00E-02 1 23 45 67 89 111 133 155 177 199 221 243 265 287 309 331 353 375 397 419 441 0 50 100 150 200 250 300 350 1 22 43 64 85 106 127 148 169 190 211 232 253 274 295 316 337 358 379 400 421 442 0 100 200 300 400 500 600 1 22 43 64 85 106 127 148 169 190 211 232 253 274 295 316 337 358 379 400 421 442 0 0.2 0.4 0.6 0.8 1 1 22 43 64 85 106 127 148 169 190 211 232 253 274 295 316 337 358 379 400 421 442 0 100 200 300 400 500 600 700 1 22 43 64 85 106 127 148 169 190 211 232 253 274 295 316 337 358 379 400 421 442 (A) (B) (C) (E) (D) (F) (G) (H) (I)
Figure 4.1 Coefficient of parameters and metabolites concentration: glycerol fermentation plus tryptone (A) tryptone (B) Ethanol (C) Succinate (D) Glycerol (E) NH3 (F) Formate (G) Biomass (H) Lactate (I) CO2.
Furthermore, we investigate the correlation coefficient of each EFMs, that can realize
that every EFMs are similar or not. Figure 4.3 shows the correlation coefficient in glycerol
fermentation plus tryptone, the red point represent high correlation coefficient, yellow point
represent low correlation coefficient, and green represent negative correlation coefficient.
There are many red square that reveal this part of EFMs is similar shown in Figure 4.3, and
(A) (B) 0 0.02 0.04 0.06 0.08 0.1 0.12 1 17 33 49 65 81 97 113 129 145 161 177 193 209 225 241 257 273 289 305 321 337 353 369 385 401 417 433 0.00000001 0.0000001 0.000001 0.00001 0.0001 0.001 0.01 0.1 1 1 18 35 52 69 86 103 120 137 154 171 188 205 222 239 256 273 290 307 324 341 358 375 392 409 426
Figure 4.2 Parameters distribution : glycerol fermentation plus tryptone .
EF M1 EF M2 EF M3 EF M4 EF M5 EF M6 EF M7 EF M8 EF M9 EF M1 0 EF M1 1 EF M1 2 EF M1 3 EF M1 4 EF M1 5 EF M1 6 EF M1 7 . . . . E FM 442 EFM1 EFM2 EFM3 EFM4 EFM5 EFM6 EFM7 EFM8 EFM9 EFM10 EFM11 EFM12 EFM13 EFM14 EFM15 EFM16 EFM17 . . . . . . . . . . . . . . . . . . . . . . . . EFM442
Each of the three parts EFMs that we select one to compare with early work shown in
Figure 4.5, Figure 4.6, and Figure 4.7. In Figure 4.5, the major product is acetate. In Figure
4.6, the major products are ethanol, biomass, and succinate. In Figure 4.7, it have the most
less reaction that only convert glycerol to succinate and ethanol ,but this EFMs didn’t growing
biomass. Above all, the cluster of EFMs matrix provides a possible thinking that performs the
a few EFMs to stand for whole systems EFMs.
The frequency of high correlation coefficient part shown in Table 4.2-4.4, focus on mode
151 – mode 282, there is none of the reaction about biomass growing, and the less flow in
pentose phosphate pathway and ratio of ethanol in fermentative produce is increased. That
cluster of EFMs stand for high yields EFMs lead us to further research on the question of how
to balance the cell growing and increase the ethanol yields.
Table 4.2 Reaction frequency of EFMs for glycerol fermentation plus tryptone: 1~32
GG1 GG3 GG4 GG11 GG12 GG13 PPP2 PPP3 TCA1 TCA2r FR1
0 0 1 0.87 0 0.47 0 0 1 1 0.57
FR2 FR3 ANA1 ANA2 ANA3 FEM1 FEM2 FEM7 FEM8 FEM3 FEM5
0.63 0.63 1 0.2 0 0.53 0.17 0.23 0.23 0.13 0.13
FEM6 FEM4 FEM9 EDP1 EDP2 XYL1 XYL2 GAL1 MAN1 MAN2 ARA1
0.27 0.53 0.13 0 0 0 0 0 0 0 0
BIO OPM4r FC2 TRA1 TRA2 TRA3 TRA4 TRA5 TRA6 TRA7 GLB1
1 0.53 0 0.27 0.4 1 0.13 0.7 0 0.53 0.27
GLB2 TRA8 TRA9 TRA10 GLYD1 GLYD2 GLYD3 GLYD4 OPM3 TRYP GG2r
0.27 0 0 0 1 0 1 1 0 1 1
GG5r GG6r GG7r GG8r GG9r GG10r PPP1 PPP4r PPP5r PPP6r PPP7r
1 1 1 1 1 1 0 1 1 1 1
PPP8r TCA3r TCA4 FC1r
Table 4.3 Reaction frequency of EFMs for glycerol fermentation plus tryptone: 33~133
GG1 GG3 GG4 GG11 GG12 GG13 PPP2 PPP3 TCA1 TCA2r FR1
0 0 1 0.87 0 0.48 1 1 0.95 0.95 0.58
FR2 FR3 ANA1 ANA2 ANA3 FEM1 FEM2 FEM7 FEM8 FEM3 FEM5
0.63 0.63 1 0.19 0 0.49 0.19 0.25 0.25 0.13 0.12
FEM6 FEM4 FEM9 EDP1 EDP2 XYL1 XYL2 GAL1 MAN1 MAN2 ARA1
0.25 0.49 0.13 0 0 0 0 0 0 0 0
BIO OPM4r FC2 TRA1 TRA2 TRA3 TRA4 TRA5 TRA6 TRA7 GLB1
0.95 0.51 0 0.25 0.44 0.95 0.13 0.69 0 0.55 0.24
GLB2 TRA8 TRA9 TRA10 GLYD1 GLYD2 GLYD3 GLYD4 OPM3 TRYP GG2r
0.24 0 0 0 1 0 1 1 0 1 1
GG5r GG6r GG7r GG8r GG9r GG10r PPP1 PPP4r PPP5r PPP6r PPP7r
1 1 1 1 1 1 1 0.69 1 0.68 0.68
PPP8r TCA3r TCA4 FC1r
0.68 0.95 0.95 1
Table 4.4 Reaction frequency of EFMs for glycerol fermentation plus tryptone: 151~282
GG1 GG3 GG4 GG11 GG12 GG13 PPP2 PPP3 TCA1 TCA2r FR1
0 0.19 0.34 0.76 0.19 0.4 0.15 0 0.35 0.35 0.53
FR2 FR3 ANA1 ANA2 ANA3 FEM1 FEM2 FEM7 FEM8 FEM3 FEM5
0.57 0.57 0.81 0.3 0.19 0.41 0.13 0.28 0.28 0.05 0.19
FEM6 FEM4 FEM9 EDP1 EDP2 XYL1 XYL2 GAL1 MAN1 MAN2 ARA1
0.28 0.41 0.09 0.15 0.15 0 0 0 0 0 0
BIO OPM4r FC2 TRA1 TRA2 TRA3 TRA4 TRA5 TRA6 TRA7 GLB1
0 0.45 0.19 0.28 0.4 0 0.05 0.67 0 0.54 0.35
GLB2 TRA8 TRA9 TRA10 GLYD1 GLYD2 GLYD3 GLYD4 OPM3 TRYP GG2r
0.35 0 0 0 1 0 1 1 0.19 0.91 0.15
GG5r GG6r GG7r GG8r GG9r GG10r PPP1 PPP4r PPP5r PPP6r PPP7r
0.15 0.98 0.98 0.98 0.98 0.98 0.15 0 0 0 0
PPP8r TCA3r TCA4 FC1r
Figure 4.4 The mode No.81 in glycerol fermentation in medium plus tryptone.
In other condition, glycerol fermentation plus furmarate, there are also high coefficient
subset and low high coefficient subset parameters with metabolites concentration.. Although
the high coefficient parameters modes influence averagely, it have less effect to the exception
metabolite. Using these variations, the extreme condition and phenomenon can be revealed.
So the cluster of similar EFMs can not use few amounts of EFMs to represent the whole
systems. (A) (B) (C) (E) (D) (F) (G) (H) (I) 0 20 40 60 80 100 120 140 1 115 229 343 457 571 685 799 913 1027 1141 1255 1369 1483 1597 1711 1825 1939 0 50 100 150 200 250 300 350 400 1 115 229 343 457 571 685 799 913 1027 1141 1255 1369 1483 1597 1711 1825 1939 0 500 1000 1500 2000 2500 3000 1 117 233 349 465 581 697 813 929 1045 1161 1277 1393 1509 1625 1741 1857 0 200 400 600 800 1000 1 117 233 349 465 581 697 813 929 1045 1161 1277 1393 1509 1625 1741 1857 0 500 1000 1500 2000 2500 1 117 233 349 465 581 697 813 929 1045 1161 1277 1393 1509 1625 1741 1857 0 200 400 600 800 1000 1200 1400 1600 1800 1 117 233 349 465 581 697 813 929 1045 1161 1277 1393 1509 1625 1741 1857 0 0.002 0.004 0.006 0.008 0.01 0.012 1 118 235 352 469 586 703 820 937 1054 1171 1288 1405 1522 1639 1756 1873 0 100 200 300 400 500 1 115 229 343 457 571 685 799 913 1027 1141 1255 1369 1483 1597 1711 1825 1939 0 20 40 60 80 100 120 140 1 115 229 343 457 571 685 799 913 1027 1141 1255 1369 1483 1597 1711 1825 1939
Figure 4.8 Coefficient of parameters and metabolites concentration: glycerol fermentation plus furmarate (A) Furmarate (B) Ethanol (C) Succinate (D) Glycerol (E) NH3 (F) Formate (G) Biomass (H) Lactate (I) CO2.
![Figure 1.5 US biodiesel production and its impact on crude glycerol prices [2]](https://thumb-ap.123doks.com/thumbv2/9libinfo/8406838.179587/15.892.163.570.122.444/figure-biodiesel-production-impact-crude-glycerol-prices.webp)