Method for determining the fast axis and phase
retardation of a wave plate
Ming-Horng Chiu, Cheng-Der Chen, and Der-Chin Su
Institute of Electro-Optical Engineering, National Chiao Tung University, 1001 Ta-Hsueh Road, Hsin-Chu, Taiwan Received October 6, 1995; revised manuscript received April 10, 1996; accepted April 26, 1996 Based on the heterodyne interferometric technique and the discrimination technique of using two light beams with different wavelengths, a novel method for identifying the fast axis of a wave plate and evaluating its phase retardation is presented. Some of the merits of the method, such as, a simple optical setup, high sta-bility, better resolution, and easier operation, are presented, and the validity of the method is demonstrated. © 1996 Optical Society of America.
1. INTRODUCTION
A wave plate is a commonly used optical element in an op-tical metrological system.1–5 The retardation error of a
wave plate significantly influences the measurement re-sults. Furthermore, for accurate optical alignments it is necessary to identify the fast axis of the wave plate. Some papers6,7 have reported how to identify the fast axis, but these studies were done qualitatively without high resolution. There are also some papers7–14on how to evaluate the phase retardation of a wave plate. Al-though the procedures reported have high resolution, they are performed under the condition that the fast axis be located accurately in advance at a special azimuth angle.
In this paper a novel method is presented that can identify the fast axis of a wave plate and at the same time evaluate its phase retardation. The method is based on the heterodyne interferometric technique and the dis-criminative technique of using two light beams with dif-ferent wavelengths. The phase difference, rather than optical intensity, is measured electrically, thus giving bet-ter resolution. The method has some advantages such as a simple optical setup, high stability because of its com-mon path configuration, and easier operation.
2. PRINCIPLE
The schematic diagram of this method is shown in Fig. 1. A linearly polarized light at wavelength of l1 or l2
passing through an electro-optic (EO) modulator is inci-dent on a beam splitter BS and is divided into two parts: The reflected light and the transmitted light. The reflected light passes through an analyzer ANr, then
enters a photodetector Dr. If the amplitude of light
ar-riving at Dr is Er, then the intensity measured by Dris Ir5 uEru2, where Ir is the reference signal. The
trans-mitted light passes through a tested wave plate W and an analyzer ANt and is detected by another photodetector
Dt. If the amplitude of light arriving at Dtis Et, then
the intensity measured is It5 uEtu2, where It is the test
signal.
A. Intensities of the Reference Signal and the Test Signal
For convenience, the 1z axis is chosen to be along the light propagation direction and the y axis to be along the vertical direction. Let the incident light be linearly po-larized in the x direction, the fast axis of the EO modula-tor under an applied electric field be 45° (the technique for locating the EO modulator is written in Appendix A), and the fast axis of the tested wave plate W beu with re-spect to the x axis. The transmission axes of the two analyzers ANrand ANtare along the y axis. Then the
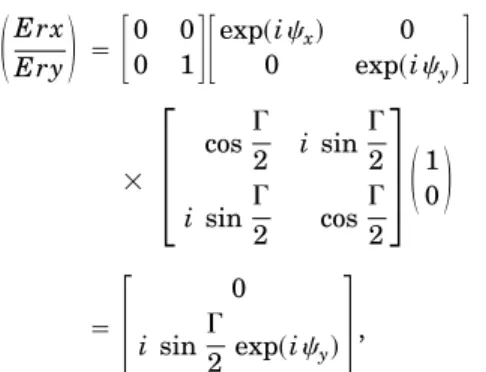
Jones vector15of Er is
S
Erx EryD
5F
0 0 0 1GF
exp~icx! 0 0 exp~icy!G
3F
cosG 2 i sinG 2 i sinG 2 cosG 2G
S
1 0D
5F
0 i sinG 2 exp~icy!G
, (1)the intensity of the reference signal is
Fig. 1. Schematic diagram of the method: P, polarizer; BS, beam splitter; M, mirror; EO, electro-optic modulator; AN, ana-lyzer; W, wave plate to be measured; D, photodetector.
Ir5 uEru25
1
2 ~1 2 cos G!, (2) where G is the phase retardation introduced by the electro-optic modulator andcxandcyare the phase shifts
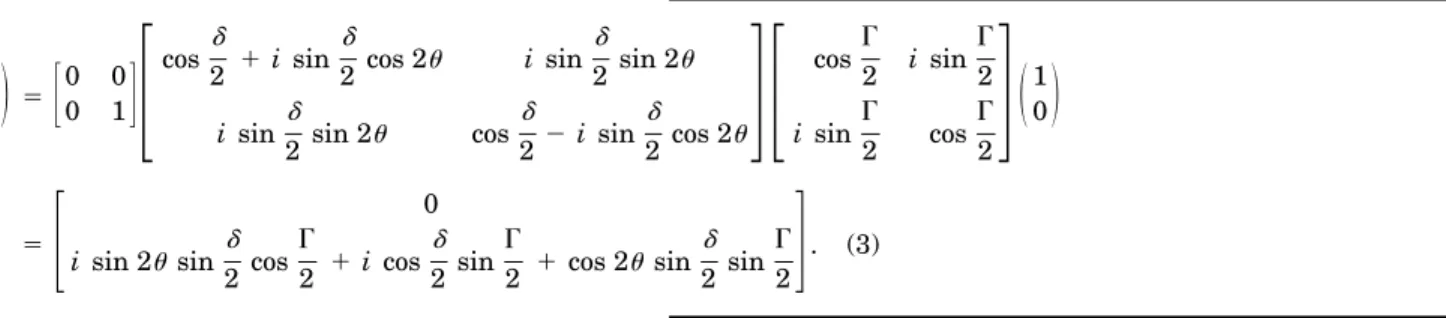
for the x component and the y component, respectively, of the reflected beam from BS. From Eq. (2) it is obvious that the intensity of the reference beam is independent of the phase shifts corresponding to the reflection from BS. In contrast, the Jones vector of Et is
Then the intensity of the test signal is It5
1
2 @1 2
A
A21 B2 cos~G 1 f!#; (4)
wheredis the phase retardation of W and
A5 cos22u 1 sin22u cosd, (5)
B5 sin 2u sind. (6)
In the above descriptions, f is the phase difference be-tween It and Ir. It can be any value between 0 and 2p
with a period of 2p ; here we arbitrarily define its value to be between2p and p. Then, according to the value ofd and the signs of A and B,f is given by the following ex-pressions:
If 0°< udu < 90°, then
f 5 tan21~B/A!. (7)
If 90°< udu< 180° and if
A > 0, then f 5 tan21~B/A!; (8) A , 0 and B > 0, then f 5 p 1 tan21~B/A!; (9) A , 0 and B , 0, then f 5 2p 1 tan21~B/A!.
(10) If G is constant, i.e., without the electro-optic modulator or with the electro-optic modulator off, then both Irand It
are constants, and it is difficult to evaluate the value off. If a sawtooth voltage signal with amplitude Vl/2, the half-wave voltage of the EO modulator, is applied to the EO modulator, then G 5 wt, where w is the angular fre-quency of the sawtooth signal. Thus from Eqs. (2) and (4) it is seen that the two detected output signals are sinu-soidal with a phase difference f. These two sinusoidal signals are sent to a phase meter, and the phase differ-encef can be measured.
B. Performing Procedures
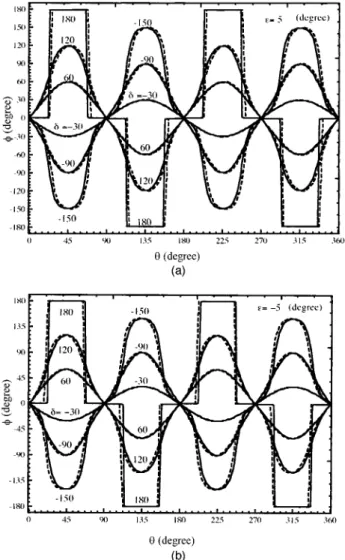
From Eqs. (5)–(10) it is obvious that the phase difference f between Itand Iris a function ofu andd. The relation
curves off versus u for differentdthat are from2180° to 0° and from 0° to 180° with an interval of 30° are shown in Figs. 2(a) and 2(b), respectively. It can be seen in these figures that, despite the values ofd,f equals zero whenu equals 0°, 90°, 180°, and 270°. These values oc-cur when Itand Ir are in phase. So this behavior can be
used for identifying the azimuth angle when u equals ei-ther 0° or 90°. Although the phase retardation of the wave plate at 180° or nearly 180° also has this behavior,
it is difficult to identify the azimuth angle whenu equals either 0° or 90° by using only this behavior, because the curve of the phase difference is horizontal near u 5 0° and u 5 90°. Since the phase retardation of a wave
S
Etx EtyD
5F
0 0 0 1G
F
cosd 2 1 i sin d 2 cos 2u i sind 2 sin 2u i sin d 2 sin 2u cosd 22 i sin d 2 cos 2uGF
cosG 2 i sinG 2 i sinG 2 cosG 2G
S
1 0D
5F
0 i sin 2u sind 2 cos G 2 1 i cos d 2 sin G 2 1 cos 2u sin d 2 sin G 2G
. (3)Fig. 2. Relation curves of f versus u for different d: (a) d 5 2180° to 0°, (b)d5 0° to 180°, at 30° intervals.
plate depends on the wavelength, we can solve this prob-lem by introducing another light source of wavelengthl2.
Then the phase retardation of the wave plate is changed anddis no longer 180° or nearly 180°. Now the behavior can again be used to determine the azimuthal position at eitheru 5 0° or u 5 90°. In contrast, f has an extreme value when u equals 45°, 135°, 225°, and 315°. For u 5 45° and 225°, d5 f; and for u 5 135° and 315°,
d5 2f. Consequently, the phase retardation can be es-timated. On the basis of the above descriptions, the pro-cedures for determining the fast axis and the phase retar-dation of a wave plate, specified for wavelengthl1, can be
summarized as follows:
1. Rotate the wave plate W until It and Ir are in
phase (i.e., f 5 0) with light source of wavelength l1.
Then rotate the wave plate back and forth slightly to check the sensitivity off versus u. If it is sensitive, then keep the wave plate at the azimuth angle wheref equals zero. If it is insensitive, introduce another light source of wavelengthl2and rotate the wave plate untilf becomes
zero. At this condition the fast axis of the wave plate is located at eitheru 5 0° or u 5 90°. This represents the situation in which either the fast axis or the slow axis is along the x axis.
2. Next rotate the wave plate counterclockwise by 45°, and u becomes either 45° or 135°. Under this arrange-ment light sources of wavelengths l1 and l2 are used
separately, and f1 and f2, respectively, are obtained.
Note that the phase retardation of a wave plate has a pe-riod of 360°; hence the correspondingf1andf2should be
modified so that they are within the range 0° to 360°. The measurable range of the phase meter is between 2180° and 180°; hence for the required modification to be obtained, the measured values off1andf2must remain
unchanged if they are positive; otherwise, 360° should be added to the data whenever it is negative.
3. Following the measurements off1andf2in
proce-dure 2, if the modified values off1andf2are nearly
sat-isfied with the following reference equation,
f2>
l1
l2 f1
, (11)
then the fast axis is at 45° to the x axis (i.e., u 5 45°), and the phase retardation to be measured is the original value f1. Otherwise, the slow axis is at 45° (i.e.,
u 5 135°) to the x axis, and the phase retardationdto be measured is the negative of the original value off1.
3. EXPERIMENTS AND RESULTS
To demonstrate the validity of this technique, a quarter-wave plate 6328-4M) and a half-quarter-wave plate (WPQ-6328-2M) manufactured by Japan Sigma Koki Ltd., speci-fied for a 632.8-nm wavelength, were tested. A He–Ne laser with a l15 632.8-nm and a He–Cd laser with
l25 441.6-nm were used. An EO modulator (PC200/2)
manufactured by Electro-Optics Developments Ltd., with half-wave voltage 170 V for 632.8-nm and 118.6 V for 441.6-nm wavelength, was used in this test. A sawtooth signal with frequency 2 kHz and amplitude Vl/2, the
half-wave voltage of EO modulator, was applied to the EO modulator. For a quarter-wave plate it was easy to iden-tify the azimuthal position where u equals either 0° or 90°, and f15 89.3° and f25 128.85° were obtained
when light sources ofl1andl2, respectively, were used.
Since f1 and f2 satisfied Eq. (11), the fast axis was at
u 5 45°, and its phase retardation was 89.3°. For the half-wave plate it was difficult to identify the azimuthal position whereu equals either 0° or 90°; the second light source of wavelength l2 was used to identify it. Then
f15 2179° and f25 102.3° were obtained when light
sources ofl1andl2, respectively, were used. Becausef1
is negative, it was modified to f1m5 181° according to
procedure 2. Since the modified valuef1m and f2 did
not satisfy Eq. (11), the fast axis of the half-wave plate was atu 5 135°, and its phase retardation was 179°.
To verify the correspondence between theory and ex-periments with this method, after the fast axes of these two wave-plates were determined, the phase differencesf were measured at different azimuth anglesu. The mea-surement results of the phase differencef versus the azi-muth angleu are shown in Fig. 3. In this figure the solid curves and the dashed curves represent the theoretical values, and the symbolss and n represent the measured values at wavelengths of 632.8 and 441.6 nm, respec-tively. The phase retardations at 632.8 nm can be read at u 5 45° to be 89.3° in Fig. 3(a) and 179° in Fig. 3(b). These results are in good accordance with the original
Fig. 3. Theoretical and experimental results for wave plates with 632.8-nm wavelength: (a) a quarter-wave plate, (b) a half-wave plate. Theoretical and experimental results with 441.6-nm wavelength are also included.
wave-plate specifications. The corresponding phase re-tardations at 441.6-nm wavelength are 128.85° and 2102.3°.
4. DISCUSSION
It is described in the beginning of Subsection 2.A that the precondition of this method is that the fast axis of the EO modulator be located accurately at 45° to the x axis. In the following, we discuss the influence of this accuracy on the determination of the fast axis and on the measure-ment of the phase retardation of the tested wave plate. If there is an azimuthal angular error e in locating the fast axis of the EO modulator, then the Jones matrix of the fast axis can be expressed as
EO 5
F
cosG 2 2 i sin 2e sin G 2 i cos 2e sinG 2 i cos 2e sinG 2 cosG 2 1 i sin 2e sin G 2G
. (12) With similar derivations from Eqs. (1)–(4), the intensities of the reference signal and the test signal areIr5 cos 2e 2 ~1 2 cos wt!, (13) It5 1 2 ~g 1 b! 2 1 2 @~g 2 b cos 2a! 2
1 ~b sin 2a!2]1/2cos~wt 1f8!, (14)
respectively, where
a 5 tan21
S
cos 2e cos ~d/2!sin 2u sin ~d/2!
D
,b 5 @sin 2u sin ~d/2!#21 @cos 2e cos ~d/2!#2, g 5 cos2~2u 2 2e!sin2 ~d/2! ,
and
According to Eqs. (13) and (14), the relation curves of f versusu for differentdwhene 5 5° and 25° are shown in Figs. 4(a) and 4(b) respectively, in which the correspond-ing curves shown in Fig. 2 are added for comparison. In these figures, the solid and the dashed curves represent the results without and with azimuth angular errore,
re-spectively. Here, positivee means an error in the coun-terclockwise direction. It is seen that the behavior thatd equals zero when u 5 0°, 90°, 180°, or 270° remains un-changed, sodhas no influence on identifying the fast axis of the tested wave plate. In contrast, the measurement error of the phase retardation is
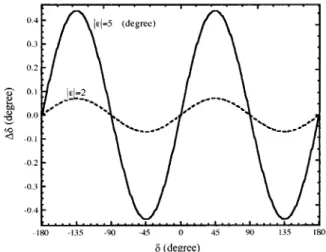
Dd5 tan21
S
sindcos 2e cosd
D
2 d. (15)Withueu 5 2° and 5°, the measurement errors of different wave plates are calculated and shown in Fig. 5. From these curves it is clear that even whenueu is as large as 5°,
Fig. 4. Comparison of the relation curves offversusufor dif-ferentdas (a)e5 5°, (b)e5 25°. Solid and dashed curves rep-resent results without and with azimuth angular errore, respec-tively.
f85 tan21
H
cos 2e sin 2u sindthe measurement error is still small. The maximum er-ror occurs at the wave plates with phase retardations 2135°, 245°, 45°, and 135°. However, the maximum er-ror is always less than 0.45°.
This method is suitable for wave plates with phase re-tardation between 0° and 360°; its resolution depends on the phase retardation of the wave plate and the resolution of the phase meter. Our experiments show that this method provides a resolution of better than 0.1° when a phase meter with 0.01° resolution is employed to measure a quarter-wave plate.
5. CONCLUSION
A novel method for identifying the fast axis of a wave plate and evaluating its phase retardation was presented. The method is based on the heterodyne interferometric technique and the discriminative technique of using two light beams with different wavelengths. Some of its mer-its are a simple optical setup, high stability, better reso-lution, and easier operation. The performance of this system was demonstrated.
APPENDIX A
In our experiments the fast axis of the EO modulator is located atu 5 45° by means of the following procedures: 1. The EO modulator is inserted between polarizer P and analyzer A as shown in Fig. 6, and we let the trans-mission axes of P and A be 0° and 90°, respectively, rela-tive to the x axis. If the fast axis of the EO modulator is athto the x axis and a sawtooth signal with angular fre-quency w and amplitude Vl/2is applied to it, then the in-tensity detected by photodetector D can be expressed as
I 5 sin 22h
2 ~1 2 cos wt!, (A1)
based on the derivations of Jones calculus. The signal is an ac signal with amplitude (sin22h)/2. It is obvious that the amplitude equals zero, and the signal becomes a dc signal whenh5 0° or 90° by rotation of the EO
modula-tor until a dc signal appears in the oscilloscope. Then the fast axis of the EO modulator is located at either u 5 0° or 90°.
2. The optical setup is modified, as shown in Fig. 7. The azimuth angle of the fast axis of the EO modulator is unchanged, and the transmission axes of the polarizer and the analyzers are located at 45° relative to the x axis. The incident beam is diffracted by acousto-optic modula-tor AOM and is divided into two beams of frequencies f0
and f01 fs, where f0is the optical frequency and fsis the
driven frequency applied to AOM. The beam of fre-quency f01 fs is reflected by mirror M to polarization
beam splitter PBS. Then x- and y-polarization compo-nents enter photodetectors D1and D2, respectively. The
beam of frequency f0 passes through the EO modulator
and also enters PBS. A sawtooth signal with frequency f and amplitude Vl/2is applied to the EO modulator; thus the Jones vector of the light beam after leaving the EO modulator is E05
H
expF
i2pS
f06 f 2D
tG
expF
i2pS
f07 f 2D
tG
J
, (A2)where the upper signs are taken if the fast axis of the EO is atu 5 0°. The beam is then divided by PBS, and the y- and the x-polarization components enter D1and D2,
re-Fig. 5. Measurement errors for wave plates asueu5 2° and 5°.
Fig. 6. Optical setup for locating the fast axis of the EO modu-lator at eitheru5 0° oru5 90°: P, polarizer; EO, electro-optic modulator; A, analyzer; D, photodetector.
Fig. 7. Optical setup for identifying the fast axis of EO modu-lator: P, polarizer; AOM, acoustic-optic modulator; M, mirror; EO, electro-optic modulator; PBS, polarization beam splitter; A’s, analyzer; D’s, photodetectors.
spectively. Consequently, D1and D2detect the
interfer-ence signals with beat frequencies at f1and f2, and they
can be expressed as
f15 fs6 f/2, (A3)
and
f25 fs7 f/2, (A4)
respectively. These two signals are sent to the RF spec-trum analyzer for comparison. If f1, f2, the fast axis of
the EO modulator is along the x axis (i.e.,u 5 0°). Oth-erwise, the fast axis of the EO modulator is along the y axis (i.e.,u 5 90°). After determining the fast axis of the EO modulator, we use a high-resolution rotation stage to rotate the fast axis of the EO modulator tou 5 45°.
ACKNOWLEDGMENT
This study was supported by the National Science Coun-cil, Taiwan, under contract NSC 82-0417-E-009-346.
REFERENCES
1. H. Takasaki, ‘‘Photoelectric measurement of polarized light by means of an ADP polarization modulator,’’ J. Opt. Soc. Am. 51, 461–462 (1961).
2. R. M. A. Azzam and N. M. Bashara, Ellipsometry and Po-larized Light (North-Holland, Amsterdam, 1977), Chap. 5, p. 364.
3. P. S. Hauge and F. H. Dill, ‘‘Design and operation of ETA, an automated ellipsometer,’’ IBM J. Res. Dev. 17, 472–489 (1973).
4. D. C. Su and L. H. Shyu, ‘‘Phase shifting scatter plate in-terferometer using a polarization technique,’’ J. Mod. Opt. 38, 951–959 (1991).
5. P. Hariharan, ‘‘Double-pass interferometers,’’ in Opti--calShop Testing, D. Malacara, ed. (Wiley, New York, 1992), pp. 247–263.
6. G. Li, J. Li, and Y. Li, ‘‘Determination of the fast axis with an infrared spectrometer for quartz and mica waveplates,’’ Appl. Opt. 29, 1870–1871 (1990).
7. N. O’Flaherty, N. Kiyomoto, I. Shirahama, and Y. Mochida, ‘‘A system for high sensitivity measurement of birefrin-gence using a photo-elastic modulator, and its applica-tions,’’ in Electro-Optic and Magneto-Optic Materials II, H. Dammann, ed., Proc. SPIE 1274, 122–131 (1990). 8. B. R. Grunstra and H. B. Perkins, ‘‘A method for
measure-ment of optical retardation angles near 90 degrees,’’ Appl. Opt. 5, 585–587 (1966).
9. C. M. McIntyre and S. E. Harris, ‘‘Achromatic wave plates for the visible spectrum,’’ J. Opt. Soc. Am. 58, 1575–1580 (1968).
10. Y. Lin, Z. Zhou, and R. Wang, ‘‘Optical heterodyne mea-surement of the phase retardation of a quarter-wave plate,’’ Opt. Lett. 13, 553–555 (1988).
11. E. Collett, ‘‘The measurement of the phase shift of a re-tarder,’’ in Polarized Light: Fundamentals and Applica-tions (Marcel Dekker, New York, 1993), pp. 130–138. 12. S. Nakadate, ‘‘High precision retardation measurement
us-ing phase detection of Young’s frus-inges,’’ Appl. Opt. 29, 242– 246 (1990).
13. M. Sypek, ‘‘A new technique for the measurement of phase retardation,’’ Opt. Laser Technol. 23, 42–44 (1991). 14. L.-H. Shyu, C.-L. Chen, and D.-C. Su, ‘‘Method for
measur-ing the retardation of a wave plate,’’ Appl. Opt. 32, 4228– 4230 (1993).
15. A. Yariv and P. Yeh, Optical Waves in Crystals (Wiley, New York, 1984), Chap. 5, pp. 121–131.