行政院國家科學委員會補助國內專家學者
出席國際學術會議報告
97 年 5月 30日 報告人姓名 李亭林 服務機構 及職稱 高雄大學亞太工商管理學系 時間 會議地點 97/4/6-97/4/10 杜拜-阿拉伯聯合大公國 本會核定 補助文號 NSC 96-2416-H-390-011-MY3 附件三 會議 (中文) 2008 國際科技管理學會:創造與管理知識經濟(英文) 2008 International Association for Management of Technology (IAMOT): ”Creating and Managing a knowledge economy” 名稱
發表 (中文) 光電產業集群的網絡分析:台灣個案
論文 (英文) Network Analysis of opto-electronics industry cluster: A case of Taiwan 題目 報告內容應包括下列各項: 一、 參加會議經過 大會除了各學者的研究報告外,另外每天早上大會也安排專題演講,邀請產官學業界的資深 管理者報告目前政府科技發展的趨勢、策略與作法,及產業界國際知名公司的發展狀況,獲 益良多。此外,針對本人發表之研究報告和與會的專家學者交換意見與充分討論。 二、 與會心得 能有機會認識各國專家學者,交換目前的研究心得。 三、 考察參觀活動(無是項活動者省略) 無 四、 建議 無 五、 攜回資料名稱及內容 攜回的資料包括大會發送的研討會資料及論文集。 其他
NEWWORK ANALYSIS OF OPTO-ELECTRONICS INDUSRY CLUSTER: A CASE OF TAIWAN
Ting-Lin LEE
Department of Asia Pacific Industrial and Business Management, National University of Kaohsiung
700, Kaohsiung University Road, Kaohsiung 811, Taiwan [email protected]
The research scope in this study includes optoelectronics industry, especially LCD firms, and other complementary institutions in STSP. The purposes of this study are mainly to describe supply chain relationships networks of opto-electronics industry in STSP as fully as possible, tease out the prominent patterns in such networks, and discover what effects these relationships and networks have on organizations performance. In this regard, this research was conducted into two stages. In the first stage, some hypotheses (if some variables, for example network competence, network position and absorptive capacity, have significant effects on the innovation performance) will be verified through SPSS. We also expect to examine if the “network position” and “absorptive capacity” to the innovation performance has a meditative effect or not, and if they have significant influences on innovation performance. The second stage we adopted SNA to analyse further how the “network position” (such as direct ties, closeness centrality, betweenness centrality, coreness, and structural holes etc.) affect innovation performance.
In this study, most hypothesizes have been proved positively, and we further figure out the variable of “network position” exists meditative effect between network capacity and innovation performance. Simultaneously, network position also acts as mediator between network capacity and absorptive capacity. The results of this study contribute to a better understanding of how firms can utilize network benefits to enhance their innovation performance. Furthermore, “coreness centrality” is the most interpretable position variable for innovation performance.
Keywords: social network analysis, network competence, absorptive capacity, Southern Taiwan Science Park (STSP)
Introduction
Since the IC industry in Taiwan developing maturely into the 21st century, next emerging high-tech industry in Taiwan has already come around the corner that is “opto-electronics industry.” Thanks to governments’ policy planning, “North (Shin-Chu Science Park, SCSP) IC, South (Southern Taiwan Science Park, STSP) Opto-electronics,” engines in the high-tech industry have been fuelled by two major focuses and each of them locates in different Parks. Obviously, each industry has developed an industry network along with its cluster in the Park. The STSP, for example in 2006, is homed by more than 38 opto-electronics corporations which were has been approved by National Science Council, and 29 of them have production. The total revenue in the STSP has already topped $4,516 hundred million in 2006. Opto-electronics industry, particularly, has already taken above 71% in the STSP. Sales revenue for opto-electronics industry was NT$3,224 million in 2006, an increase of 16 times over 2001. Corporations in the industry has benefited from the policy, and part of economic gains coming from the cluster in the Park. Obviously, the STSP has turned out to be an important cluster of opto-electronics in Taiwan.
Science Parks have been linked to the economic development of countries and the creation of local competitive advantages. According to Hakansson and Ford (2002) point out that there are three paradoxes (e.g. opportunities and limitation in networks; influence and being influenced in a network; controlling and being control in networks) that can be detected in a network. Nevertheless, business cluster is one of the formats of network. This study examine if business clusters (such as science parks) faced these paradoxes. These three paradoxes give us insights about there are insistence advantage and risk surrounding the network. Porter (2000) argues that location as a single factor is losing its competitive advantage. However, as firms join clusters, the meaning of location in the sense of firm agglomeration becomes important again. Government set many special areas to attract foreign investments. Companies also want to gain benefits from Science Park by means of policy subsidy or cooperation with other firms. The main motivation of this research is to see if firms can really get the resources they want from the cluster. In order to understand relationships among optic-electronic firms, especially in LCD firms, in the STSP, Social Network Analysis (SNA) approach and related statistics will be used in the research.
According to statements above, we are interested in the following issues related to the firms in the Southern Taiwan Science Park: 1) the communication patterns among LCD firms in the STSP and find out the key players in LCD industry, 2) the relationships between network competency, network position, absorptive capacity and innovation performance, 3) the effect of network features, such as degree, betweenness, closeness, coreness, and structural holes etc., on the innovation performance.
Literature Review Network competence
Early researches focus on competence in terms of firm’s ability to satisfy customer and these issues were related to relational marketing. But, recently researcher attach importance to relationships between firms’ (e.g. Ritter and Gemunden 2004; Gemunden, Ritter, and Heydebreck, 1996; Ritter and Gemunden, 2003; Ritter, Wilkinson, and Johnston, 2002). Ritter and Gemunden (1997) introduced the network competence as firm’s specific characteristic. Ritter (1999) claims this ability as “network competence” and defines it “… the degree of network management task execution and the degree of network management qualification possessed by the people handling a company’s relationships” (Ritter 1999, p.471; Ritter et al., 2002). According to its definition, network competence enables firm to establish relations and manage their relationships with multiple partner companies. In other words, the ability to cultivate network competence can help firm establish and utilize relationships with others organizations. The more competence a firm has with respect to establishing relationships, the more likely the company will find itself embedded in a rich network of relationships. Hence, we hypothesize:
H1: There is a significant relationship between a company’s level of network competence and its network position.
Many researchers have examined relationship between network competence and innovation performance, and they descript the advantage of higher degree of network competence. Firms with higher degree of network competence can efficiently establish relationship with other firms and promote the communication of information to contribute innovation performance (Biemans, 1992; Gemunden et al., 1996). Furthermore, Scholars argue that if firms have higher network competence, then they can obtain market-oriented path to innovation success (Ritter & Gemunden, 2004). Therefore, it helps firms set up better market strategy to introduce new innovative product. Besides, Li and Calantone (1998) assumed firms with higher network competence also have higher market knowledge competence, so it can lead to innovation success. Some researchers have proposed a link between a company’s network competence and its innovation success (Biemans, 1992; Gemunden et al., 1996; Heydebreck, 1996; Ritter & Gemunden, 2004). Here, we also want to examine network competence and innovation performance in Taiwan’s Optoelectronics industry. Hence we hypothesize as follows:
H2: There is a significant relationship between a company’s level of network competence and its innovation performance.
Absorptive capacity
There are several scholars point out that absorptive capacity as an innovation platform which can increase the speed and frequency of incremental, it primarily attribute on the firm’s existing knowledge base (Kim & Kogut, 1996; Anderson & Tushman, 1990; Helfat, 1997). Cohen and Levinthal (1990) argued that absorptive capacity with valuable input factor can increase and facilitate a firm’s innovation to the R&D process. Still, Hurry, Miller and Browman (1992) noted that this process is ‘self-reinforcing’ which means that innovation and absorptive capacity can reinforce each other. Certainly the innovative output will be turned into the external knowledge which will be a resource for other companies after a period. We focus on and study the relation between the results of the absorptive capacity and innovation performance mainly. In our research, absorptive capacity is defined as a firm’s learning capability. Also Tsai (2001), Lane & Klavans (2005) has examined the
relation between absorptive capacity and innovation performance. Fallowing this clue, in our research we bring into absorptive capacity as mediating variable. We therefore hypothesize as follows:
H3: There is a significant relationship between a company’s level of network competence and its absorptive capacity.
H4: There is a significant relationship between a company’s level of absorptive capacity and its innovation performance.
Network position
There are some evidences shows positive relationship between network position and innovation from a network perspective (Tsai, 2001). Tsai (2001) points out that in an intraorganizational network a higher centrality is significantly and positively related to innovation. This finding may also apply in an interorganizational situation. Network position is a descriptor of ‘’social structure’’ and play important role in networks (Coleman et al., 1990; Tsai & Ghoshal, 1998). Position can enhance actor’s capability to develop innovative or creative value to achieve specific goals. Different network positions allow different levels of access to information or knowledge. We therefore hypothesize as follows:
H5: There is a significant relationship between a company’s network position and its absorptive capacity.
Information and knowledge can viewed as external resources. Central network positions offer more opportunities to access these resources than peripheral positions. These resources represent “fuel” in the innovation process, driving innovation performance (Tsai, 2001). We therefore hypothesize as follows:
H6: There is a significant relationship between a company’s network position and its innovation performance.
For further test which network position to the last influences innovation most, some variables were selected to observe.
Direct Ties and Innovation Performance
Direct ties could affect a firm’s innovative output positively (Ahuja, 2000), and this is because direct ties provide three substantive benefits: First, direct ties facilitate knowledge sharing (Berg, Duncan, & Friedman, 1982). When collaboration relationship exists among firms, the relative industry knowledge is available to all partners. Thus, each partner can potentially receive a greater amount of knowledge from a collaborative firm. Second, collaboration facilitates bringing together complementary skills from different firms (Arora & Gambardella, 1990). Technology often demands the simultaneous use of different sets of skills and knowledge based in the innovation process (Arora & Gambardella, 1990; Powell, Koput, & Smith-Doerr, 1996). Hence, this different knowledge from variety of firms could facilitate innovative ideas. Third, the effect of direct ties emerges through scale economies in research that arise when larger projects generate significantly more knowledge than smaller projects. Collaboration enables firms to take advantage of such scale economies. In addition, in biotechnology start-ups, Shan, Walker, and Kogut (1994) found that the greater the number of collaborative linkages formed by a start-up, the higher the innovation performance. And Ahuja (2000) found the same results in the chemical industry. Besides, firm’s communication relationship with knowledge producing institutions, such as universities, research institutes, technology-providing firms and bridging institutions such as providers of technical or consultancy services all enable knowledge sharing and exchange (Drejer, Kristensen, & Laursen, 1999). Furthermore, firms without collaboration relationship maybe also have communication relationship. Communication relationship makes firms to exchange information about technology, industrial development and etc. What information do these firms exchange depends on their ties strength. Hence, the more direct ties a firm maintains, the more information the firm holds. Then firms may exploit the information to their advantage (Burt, 1992). Accordingly, we hypothesize that:
H6a: The more direct ties a firm has, the greater the firm’s innovation performance will be. Closeness Centrality and Innovation Performance
An interfirm linkage can be a channel of communication between the firm and many indirect contacts (Mizruchi, 1989; Davis, 1991; Haunschild, 1993; Gulati, 1995). A firm’s partners bring the knowledge and
experience from their interactions with their other partners to their interaction with the focal firm, and vice versa (Gulati & Garguilo, 1999). A firm’s linkages therefore provide it with access not just to the knowledge held by its partners but also to the knowledge held by its partner’s partners (Gulati & Garguilo, 1999). The network of interfirm linkages thus serves as an information conduit, with each firm connected to the network being both a recipient and a transmitter of information (Rogers & Kincaid, 1981). Hence, if a firm could reach any other firm in the shortest distances, namely, higher closeness centrality, the firm could get knowledge and information in the shortest time (Freeman, 1979). Other things being equal, firms that spend less time to obtain knowledge and information, are likely to have effect on innovation performance than firms who spent more time. Thus, we hypothesize:
H6b: There is a positive relationship between a firm’s closeness centrality and its innovation performance. Betweenness Centrality and Innovation Performance
Betweenness is an indicator of network centrality based on Freeman’s (1979) measure of betweenness, which captures the extent to which firms sit astride network pathways between other organizations. Betweenness centrality indicates a firm’s ability to control information flows within communication network. Hence, a firm controls more information flow, it could gather more important information. Thus, the firm could perform better than others in innovation process. Similarly, Smith-Owen and Powell (2004) proved the effect of betweenness centrality on innovation performance in Boston biotechnology community. Accordingly, we hypothesize that:
H6c: There is a positive relationship between a firm’s betweenness centrality and its innovation performance. Coreness and Innovation Performance
The core/periphery models developed by Borgatti and Everett (1999) provide a useful analytical tool that represents the classic idea of a core formed by a group of densely connected actors, in contrast to a more loosely connected class of actors making up the periphery of the system. In other words, a network has a core/periphery structure if the network can be partitioned into two sets: a core whose members are densely tied to each other and a periphery whose members have more ties to core members than to each other. From this viewpoint, firms in core have more dense communication than firms in periphery and thus transfer more information and knowledge among them. Accordingly, firms in core have better innovation performance than firms in periphery. In this research, we use coreness as an indicator of core/periphery which was developed by Borgatti and Everett (1999). The higher the coreness of a firm, the better the firm’s innovation performance will be. Thus, it can be stated that:
H6d: There is a positive relationship between a firm’s coreness and its innovation performance. Structural Holes and Innovation Performance
Recent research suggests that a firm’s ego network is likely to be important to innovation such as the extent of connectivity between a firm’s partners (Burt, 1992). The underlying mechanism posited by Burt is that actors in a network rich in structural holes will be able to access novel information from remote parts of the network, and exploit that information to their advantage (Burt, 1992). Moreover, a structural hole indicates that the actor on either side of the hole have access to different flows of information (Hargadon & Sutton, 1997). Many structural holes in ego’s network will increase ego’s access to diverse information and, thus, enhance innovation performance (Ahuja, 2000). According, we hypothesize that:
H6e: The greater the structural holes bridged by a firm, the greater the firm’s innovation performance.
Methodology
Questionnaire design
In our research, the content of the questionnaire is divided into four major parts. In the first part we measure the degree of firm’s absorptive capacity, including three sub-constructs: knowledge acquisition, knowledge diffusion, and knowledge utilization. Part two captures the communication network between firms in STSP. On a list showed all organizations of the optoelectronics industry in STSP, the respondents were asked to indicate
what kind of relationship with other firms and institutions they have. There are three types of relationship proposed in the questionnaire: buyer/supplier, competitor, and other. In other words, the analytic network in this research consists of three kinds of communication relationships, and three groups of actors. In the third part the respondents were asked to evaluate their firm’s level of network competence. We use three items based on the work of Abernathy & Utterback (1988) - efficiency of R&D process, number of successful new product developments, and time-to-market for newly developed products, to measure a firm’s innovation performance. We finally aggregate these three items into an index of innovation performance. The final part includes basic company information.
Data Collection and Analysis Structure
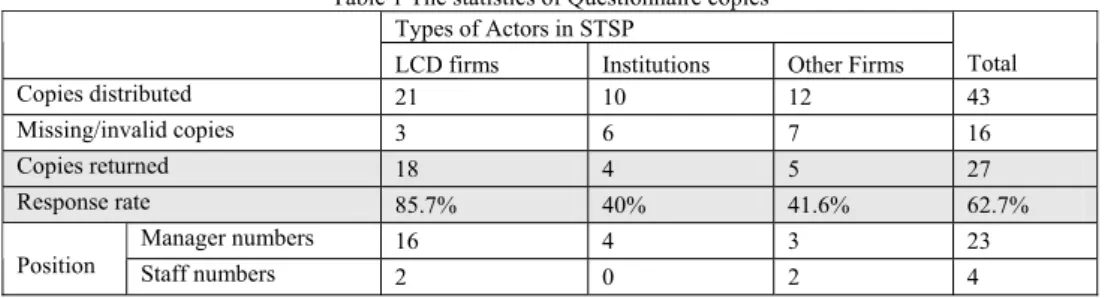
The STSP gathers optoelectronics manufactures and constructs a complete social network. It can be seen that a complete supply chain, especially for LCD firms, was formed in STSP and became more worthy as an observation target for our research. Three copies of Questionnaire were sent to each firms of the optoelectronics cluster in STSP, the respondents include senior managers, R&D staffs, and purchasing/sales agents at different levels/department. By the limited sample size, sampling methods have not been taken into account. Data collection was conducted from January till May 2007. Altogether, 43 firms and institutions were contacted. 27 questionnaires were retrieved, which is a return rate of 62.7%. If we only consider LCD firms, which is the core of our first stage research, the return rate increases up to 85.7% (refer to Table 1).
Table 1 The statistics of Questionnaire copies Types of Actors in STSP
LCD firms Institutions Other Firms Total
Copies distributed 21 10 12 43
Missing/invalid copies 3 6 7 16
Copies returned 18 4 5 27
Response rate 85.7% 40% 41.6% 62.7%
Manager numbers 16 4 3 23
Position Staff numbers 2 0 2 4
The first stage in our research mainly focuses on the LCD firms’ communication network; the second stage, the network boundary will be extended to institutions in STSP and even to optoelectronics firms of STSP. The purposes of this extension are to see if firms’ network position variable changed with extended network boundary, and see if the changed network position variables’ effect on innovation performance. Accordingly, we design four kinds of communication network based on three kinds of relationships and three groups of actors. They are LCD network (LCDNet), LCD network with institutions (LCD-InstNet), collaborative network (ColNet), and the whole optoelectronics network in STSP (OptoNet). In a word, LCDNet contains only LCD firms and their vertical collaborative relationships. LCD-InstNet contains LCD firms and related institutions, and the vertical and assistant relationships among them. ColNet contains all actors and relationships except horizontal competitor relationship. OptoNet contains all actors which include cooperators, competitors, and institutions and theirs relationships.
Empirical Analysis and Discussion
Hypotheses prove for first stage
In this section we mainly discuss our hypothesis 1 to 6, and conduct testing. Regression analysis are mainly based on the linear relation of valuables, and go a step further predict relationships between variables. In Table 2, we can figure the relations among those hypothesis variables, and the means and sum of square of each variable. Moreover, Table 3 shows the correlation between variables and significant differences.
Table 2: Mean and standard deviation of all research variables
Hypothesis Variable format Variable name Mean Standard deviation N Independent Variable Network competence 69.083 5.392
H1
Dependent Variable Network position 0.2077 0.110 18 Independent Variable Network competence 69.083 5.392
H2
Dependent Variable Innovation performance 14.278 2.492 18 Independent Variable Network competence 69.083 5.392
H3
Dependent Variable Absorptive capacity 68.584 6.989 18 Independent Variable Network position 0.2077 0.110
H4
Dependent Variable Absorptive capacity 68.584 6.989 18 Independent Variable Network position 0.2077 0.110
H5
Dependent Variable Innovation performance 14.278 2.492 18 Independent Variable Absorptive capacity 68.584 6.989
H6
Dependent Variable Innovation performance 14.278 2.492 18
Table 3: Correlation Matrix of variables
Network competence Absorptive capacity Network position Innovation performance Network competence 1
Absorptive capacity 0.706(**) 1
Network position 0.482(*) 0.736(**) 1
Innovation performance 0.661(**) 0.609(**) 0.621(**) 1
Network Competence Related Hypothesis Proof (H1~H3)
The influence of a company’s network competence on its network position, innovation performance, absorptive capacity as shown in Table 4. The results of the regression analysis show that there is respectively a significant and positive correlation between them. If a company possesses higher networking capacity, it would positively influence its position in the network because networking competence is connected with other partnership or level of communication. Whenever a company embraces higher networking capacity, it simultaneously implies the close interaction with other partners and stands on the position near the network anchor.
The higher the communication level is the easier sharing information will be. This source of information could be come from a more market oriented down-stream firm or/and up-stream firm. This affluent information can bring firms to increase its efficiency and successfulness of innovation.
Besides, if a company possesses a high networking competence, which means the company contains a kind of capacity of making other firms “willing” and “must” to interact and exchange information. Once a company embraces the ability of handling the information and internalizes them into its own knowledge, and then becomes its competitive advantages. The transformation process is exactly like the procedure of absorptive capacity. Furthermore, the research results also prove that there are positive relations between the level of network competence and absorptive capacity.
Absorptive Capacity Related Hypothesis Proof (H4)
The influence of a company’s absorptive capacity on its innovation performance as shown in Table 4. Obviously, the stronger absorptive capacity a company contains the higher innovative efficiency a company will be. The outcome is in line with what scholars had previously examined as well (e.g. Tsai, 2001; Lane and Klavans, 2005). The result does not come as a surprise: companies with better absorptive capacity can benefit from external knowledge acquisition, and internalize it to enhance internal capability. Therefore, the output of knowledge can directly correspond to a company’s innovation performance.
Network Position Related Hypothesis Proof (H5~H6)
The results of the regression analysis indicate that it is respectively a significant and positive correlated between network position and absorptive capacity, innovation performance. The more central network position compared to surrounded position can easily receive messages and information, and it will influence the level of absorptive capacity and its innovation performance. Our outcome is in line with what scholars had examined as well (e.g. Tsai and Ghoshal, 1998). Our research finding once more emphasizes the importance of network position.
Table 4: Regression analysis of each model
Model Unstandardized Coefficient(b) Std. Beta(β) t value Sig. R2 Adjusted R2
Network position 0.010 0.482 2.198 0. 043** 0.232 0.184 Innovation Performance 0.305 0.661 3.519 0.003*** 0.436 0.401 Absorptive capacity Network competence (H1~H3) 0.916 0.706 3.992 0.001*** 0.499 0.468 Innovation performance Absorptive capacity(H4) 0.217 0.609 3.072 0.007*** 0.371 0.332 Absorptive capacity 46.818 0.736 4.348 0.000*** 0.542 0.513 Innovation performance Network position (H5~H6) 14.079 0.621 3.166 0.006*** 0.385 0.347 Note: *p<0.1, **p<0.05, ***p<0.01 Multiple-regression analysis
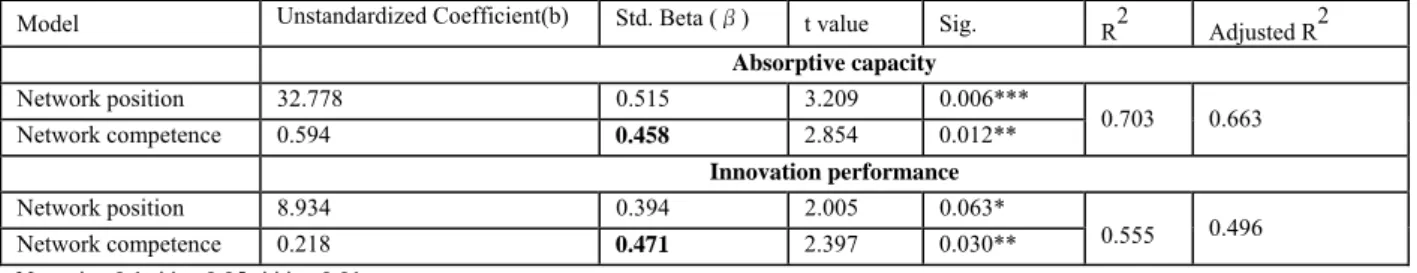
The using of multiple-regression is to examine if network competence and network position have a significant
effect on absorptive capacity. According to Table 5, the results show that it is significant and positive relation
between network competence and network position on absorptive capacity at the same time. Hence, it can be gone forward to examine if network position is a mediator variable. In H3, the Std. Beta of network competence is 0.706 (β=0.706). But in this Multiple-regression model the Std. Beta of network competence decrease to 0.458 (β=0.458). Therefore we can argue that there is a partial mediate effect between network competence and absorptive capacity.
Table 5: Multiple-regression analysis both network position and network competence on absorptive capacity and innovation performance Model Unstandardized Coefficient(b) Std. Beta (β) t value Sig. R2 Adjusted R2
Absorptive capacity Network position 32.778 0.515 3.209 0.006*** Network competence 0.594 0.458 2.854 0.012** 0.703 0.663 Innovation performance Network position 8.934 0.394 2.005 0.063* Network competence 0.218 0.471 2.397 0.030** 0.555 0.496 Note: *p<0.1, **p<0.05, ***p<0.01
Next, we examine if network competence and network position have significant effect on innovation
network position on innovation performance. There is the same with above result. In H2, the Std. Beta of network competence is 0.661 (β=0.661). But in this Multiple-regression model the Std. Beta of network competence decrease to 0.471 (β=0.471). Although, the P-value of network position is 0.063(p=0.063), but we can say it still has partial significant. Therefore we can argue that network position has partial mediate effect between network competence and innovation performance.
Moreover, the authors want to examine if network competence and absorptive capacity have significant effect
on innovation performance. The result shows that there are no significant relationships among the mentioned
variables (refer Table 6). Finally, the study examine if absorptive capacity and network position have
significant effect on innovation performance. The result still shows that there are no significant relationships
among the mentioned variables (refer to Table 7). Hence, it is reasonable to doubt that maybe there is some moderate effect that unhuman manipulate on these variables. There might have several reasons to explain above results. First, data collected are incomplete. The ideal data retrieve rate is 100% in SNA study. In practice, it is difficult to achieve this goal. Because of some ignored firms’ communication, it might result in insignificant. Second, maybe there still exist some moderate effects that were not found. Third, the sample is too small for multiple-regression. But we still believe these independent variables have significant affect to innovation performance.
Table 6: Multiple-regression analysis both network competence and absorptive capacity on innovation performance Model Unstandardized Coefficient(b) Std. Beta (β) t value Sig. R2 Adjusted R2
Innovation performance
Network competence 0.212 0.460 1.947 0.102
Absorptive capacity 0.101 0.284 -0.138 0.298 0.477 0.407 Note: *p<0.1, **p<0.05, ***p<0.01
Table 7: Multiple-regression analysis coefficient both absorptive capacity and network position on innovation performance Model Unstandardized Coefficient(b) Std. Beta
(β) t value Sig. R2 Adjusted R2
Innovation performance
Absorptive capacity 0.119 0.332 1.160 0.264
Network position 8.529 0.376 1.312 0.209 0.436 0.361 Note: *p<0.1, **p<0.05, ***p<0.01
Table 8: The Summary of empirical results
Hypothesis Result
H1: There is a significant relationship between a company’s level of network competence and its
network position. accepted
H2: There is a significant relationship between a company’s level of network competence and its
innovation performance. accepted
H3: There is a significant relationship between a company’s level of network competence and
firm’s absorptive capacity. accepted
H4: There is a significant relationship between a company’s level of absorptive capacity and its
innovation performance. accepted
H5: There is a significant relationship between a company’s network position and its absorptive
capacity. accepted
H6: There is a significant relationship between a company’s network position and its innovation
performance. accepted
Network Analysis
The following section, five hypotheses about network position variables (degree, closeness, betweenness, structural holes, coreness etc.) and innovation performance will be tested in detail. The results of correlation analysis are shown in Table 9. There are significantly positive correlations among independent variables. This is because our independent variables are all network position variables, although they capture different position concepts. However, high correlations among independent variables could lead to collinearity in multiple regressions. In addition, our research respectively focuses on the effect of different network position variables
on innovation performance and seeks to examine which network position variable could explain innovation performance most. Hence, this section will adopt simple linear regression to test our hypotheses.
Table 9: Means, standard deviations, and correlations
Structural Innovation Mean S.D Degree Closeness Betweenness Coreness
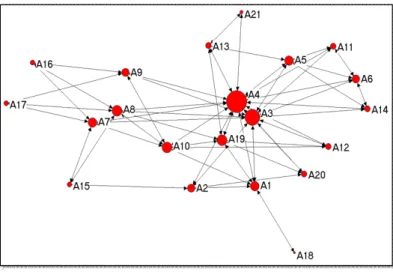
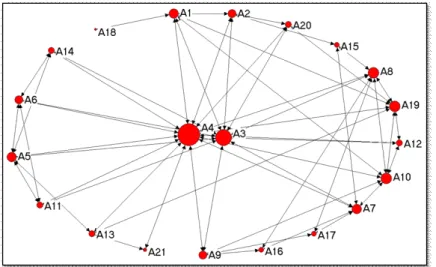
Four graphs represent network structures of optoelectronic industry in the STSP and in different scope. Code A represents LCD industry companies. Code B represents other optoelectronic industry companies which settle in the STSP and support/compete with Code A firms. Code C represents research institution units which settle in the STSP and cooperate with Code A firms.
Figure 2 shows the LCD industry in the STSP (LCDnet), which are our research main targets. The size of nodes is weighted by degree centrality. It can be observed A3 and A4 are key players in this network structure. Besides, the evidence indicates that the LCD cluster is a close cluster. The ties maintained by these two key players almost make up the whole LCD cluster, especially for firm A4 that almost has collaboration relationships with all other LCD firms. In a close network, through frequent social interaction, actors are likely to have shared values, shared norms and even collective behavior (Nooy, et al., 2005). Moreover, LCD industry is a cluster that places importance on supply chain’s collaboration. Hence, the two key players would play a role of industrial leader to lead LCD firms to achieve a better overall industry performance.
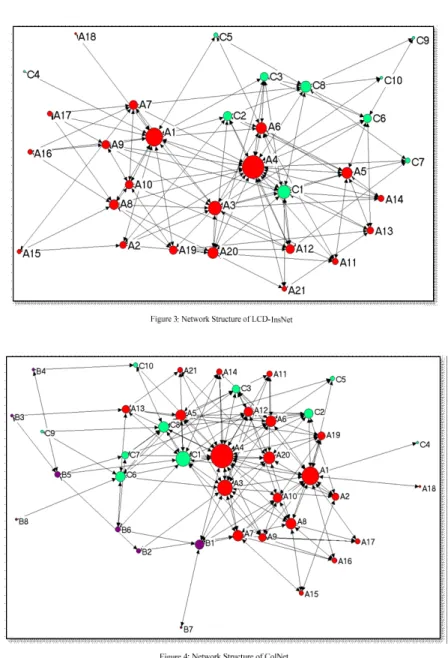
Figure3 shows the LCD companies plus collaborative research institutions (LCD-InsNet). Figure 3 is a visualization graph, where the green nodes (C1~C10) indicate institutions and red nodes indicate LCD firms (A1~A21). Institution C1 is the biggest node in the graph because it is the official administration of STSP. Hence, it must have most communication with firms in any industry in STSP’ institutions. When the research institutions were included in this network, the position of A1 becomes even more central. A3 and A4 remain the key players in this network.
In Figure 4 (ColNet), red nodes indicate LCD firms, green nodes indicate institutions, and purple nodes indicate other firms of optoelectronics industry. The sizes of nodes are weighted by degree centrality. From Figure 4, we can see that almost other firms of optoelectronics industry are in the periphery. This is because the direct ties of other firms of optoelectronics industry are smaller than others.
Holes Performance Degree 11.44 6.35 Closeness 0.55 0.09 0.975** Betweenness 0.06 0.09 0.917** 0.875** Structural Holes 0.63 0.20 0.718** 0.804** 0.550* Coreness 0.21 0.11 0.937** 0.942** 0.861** 0.671** Innovation 14.28 2.49 0.486* 0.509* 0.487* 0.337 0.621** Performance
Figure 5 shows the whole communication network among optoelectronic companies (B1~B8) and research institutions in the STSP. It includes collaborative relationships (supply chain), competitive relationships and horizontal relationships (e.g. assistance relationship). The only difference between ColNet and OptoNet is the later contains communication relationships with competitors. In Figure 5, because communication relationships between competitors are quite less, the difference between Figure 4 and Figure 5 are also quite small.
Direct Ties and Innovation Performance
The regressive results of H6a (Table 10) indicate that direct ties of four kinds of network have significantly positive effect on innovation performance. Hence, the more direct ties a firm maintains, the more information the firm holds. Then because of these information and knowledge from communication among actors, the firm has better innovation performance. Moreover, direct ties of LCD-InsNet have better explanation on innovation performance.
Closeness Centrality and Innovation Performance
The regressive results of H6b indicate that closeness centrality of four kinds of network have significantly positive effect on innovation performance. Hence, it means that firms could reach other actors in shorter time and they get more information and knowledge faster. Therefore they can enhance innovation performance. Moreover, closeness centrality of LCD-InsNet has better explanation on innovation performance.
Betweenness centrality and innovation performance
The regressive results of H6c indicate that betweenness centrality of four kinds of network have significantly positive effect on innovation performance. Hence, a firm controls more information flow, it could gather more important information. Then, the firm could perform better than others in innovation performance. Also, betweenness centrality of LCD-InsNet has better explanation on innovation performance.
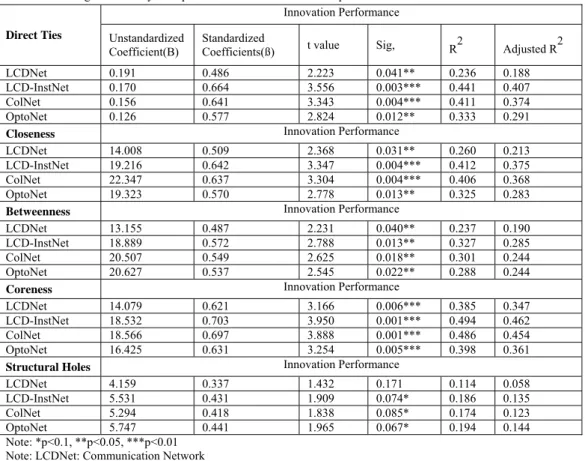
Table 10: Regression analysis of position variables on innovation performance of each communication network Innovation Performance
Direct Ties Unstandardized Coefficient(B)
Standardized
Coefficients(ß) t value Sig, R2 Adjusted R2 LCDNet 0.191 0.486 2.223 0.041** 0.236 0.188 LCD-InstNet 0.170 0.664 3.556 0.003*** 0.441 0.407 ColNet 0.156 0.641 3.343 0.004*** 0.411 0.374 OptoNet 0.126 0.577 2.824 0.012** 0.333 0.291
Closeness Innovation Performance
LCDNet 14.008 0.509 2.368 0.031** 0.260 0.213 LCD-InstNet 19.216 0.642 3.347 0.004*** 0.412 0.375 ColNet 22.347 0.637 3.304 0.004*** 0.406 0.368 OptoNet 19.323 0.570 2.778 0.013** 0.325 0.283
Betweenness Innovation Performance
LCDNet 13.155 0.487 2.231 0.040** 0.237 0.190 LCD-InstNet 18.889 0.572 2.788 0.013** 0.327 0.285 ColNet 20.507 0.549 2.625 0.018** 0.301 0.244 OptoNet 20.627 0.537 2.545 0.022** 0.288 0.244
Coreness Innovation Performance
LCDNet 14.079 0.621 3.166 0.006*** 0.385 0.347 LCD-InstNet 18.532 0.703 3.950 0.001*** 0.494 0.462 ColNet 18.566 0.697 3.888 0.001*** 0.486 0.454 OptoNet 16.425 0.631 3.254 0.005*** 0.398 0.361
Structural Holes Innovation Performance
LCDNet 4.159 0.337 1.432 0.171 0.114 0.058 LCD-InstNet 5.531 0.431 1.909 0.074* 0.186 0.135 ColNet 5.294 0.418 1.838 0.085* 0.174 0.123 OptoNet 5.747 0.441 1.965 0.067* 0.194 0.144 Note: *p<0.1, **p<0.05, ***p<0.01
Note: LCDNet: Communication Network
LCD-InstNet: LCD Communication Network with Institutions ColNet: LCD collaborative network
OptoNet: the whole optoelectronics network with Institutions in STSP
Coreness and Innovation Performance
The regressive results of H6d indicate that coreness of four kinds of network have significantly positive effect on innovation performance. Hence, firms in core have better innovation performance than firms in periphery. Moreover, coreness of LCD-InsNet has better explanation on innovation performance.
The regressive results of H6e indicate that structural holes of only three kinds of network have significantly positive effect on innovation performance. Hence, more structural holes in actor’s network will increase actor’s access to diverse information and, thus, have better innovation performance. Moreover, structural holes of OptoNet have better explanation on innovation performance.
Table 11 : Summary of empirical results
Hypotheses Results H6a: The more direct ties a firm has, the greater the firm’s innovation performance. Supported
H6b: There is a positive relationship between a firm’s closeness centrality and its innovation performance. Supported H6c: There is a positive relationship between a firm’s betweenness centrality and its innovation performance. Supported H6d: There is a positive relationship between a firm’s coreness and its innovation performance. Supported Partially Supported H6e: The greater the structural holes bridged by a firm, the greater the firm’s innovation performance.
Position variables in explaining innovation performance
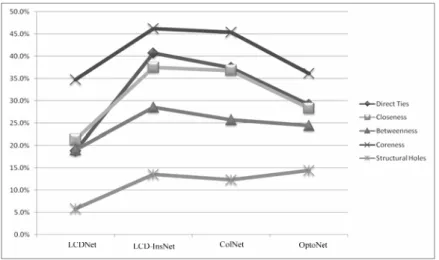
From the empirical results, we can find that almost every network position variable had significantly positive effect on innovation performance, in spite of each position variables’ adjusted R square on innovation performance are different, namely, each position variables’ goodness of fit for innovation performance are different.
In the past, many scholars proved that network position had significant effect on firm’s performance or innovation performance (Zaheer & Bell, 2005; Ahuja, 2000; Tsai, 2001). However, they often apply different network position variable to explain innovation performance in different industries. Hence, one objective of this research is to identify which network position variable is most suitable for explaining the network of LCD industry which emphasizes collaboration of supply chain in explaining innovation performance.
We use each adjusted R square (degree of explanation toward innovation performance) of regression analysis to present the distinction among different position variables and networks in Figure 6. Consequently, it shows that the explanation of coreness is the highest in each network. In other words, coreness offers the best explanation for innovation performance in all four networks. According to Borgatti and Everett (1999), in contrast to a more loosely connected class of actors, a core formed by a group of densely connected actors makes up the periphery of the network (refer to Figure 7). From the analysis results, it is likely that there are two key firms which dominate over other LCD firms. Important information and knowledge are mostly held and distributed by them, thus they have better innovation performance than others. In other words, the important information and knowledge often held by firms who are core in LCD industry. Hence, it can be concluded that when key firms in a network hold critical information, knowledge, or know-how, it is suitable to use coreness to explain innovation performance.
On the contrary, structural holes offer least explanation in each network. In addition, all network position variables get the best explanation toward innovation performance in LCD-InsNet. The explanatory power of position variables gradually decreases from LCE-InsNet to OptoNet, except for structural holes. It is likely that direct ties, closeness, betweenness, and coreness are best to be explained toward innovation performance in LCD-InsNet. Because this cluster contains all LCD firms and related institutions, the cluster is a fully complete network from an industrial cluster’s perspective.
Figure 7: Two key players in LCDNet
Remarks
All in all, network position indeed influences innovation performance from our results of analysis. We expected that a firm with more direct ties will lead him to access more information and knowledge and then get a better innovation performance. This hypothesis was supported. It means that rich and diverse sources of information facilitate knowledge generation and lead to better innovation performance. Structural holes also prove to have a significant impact on innovation performance in three networks (except LCDNet). According to Burt (1992), actors in a network rich in structural holes will be able to access novel information from remote parts of the network, and exploit that information to their advantage. But in LCDNet the actors are quite close, therefore actors interact frequently. It is likely that the closeness of the LCDNet makes it less susceptible to structural holes, and thus structural holes do not influence innovation performance at LCDNet. However, structural holes do have significant impact on innovation performance at LCD-InsNet, ColNet and OptoNet. According to Burt (1992), once other actors are added to original network, the network becomes bigger in terms of the number of exchange relationships. New actors provide even more diverse information and knowledge. In such a new network, actors with structural holes have an easier time exploiting these information and knowledge to their innovation performance than actors in LCDNet.
CONCLUSION
Theoretical Contributions
Scholars have examined the relationship between network competence with innovation performance have examined the relationship between absorptive capacity with innovation performance. According to the empirical result in this research, it can be found that network competence has significant influence on absorptive capacity. Although Tsai (2001) examine absorptive capacity has moderate effect on network position, but we argue that it is worthy to analyze mediating effect between network position and absorptive capacity with innovation performance in our research model. It has evidence that network position is the mediator between network competence and absorptive capacity; network position is the mediator between network
competence and innovation performance. This is full of meanings in the theoretical domain. The result will enhance the SNA role in the analysis of innovation management, including knowledge management.
The results indicate that a firm’s network position indeed influences his innovation performance. Different network position variables capture different kinds of position concepts. In this study, we represent the most interpretable position variable in LCD industry, namely, coreness. It is suitable to be used in any industry which has a structure of core/periphery. Moreover, a method was proposed to observe the significant change on structural holes. The way is to add additional actors to original network and then examine the change of network indicators among each actor.
Managerial Implications
At the cluster-management-level, how to efficiently manage clusters is an important issue that government and STSP Authority must handle. Government plays as an integrity facilitator and provides related tax preferential policies in order to attract firm’s investment willing. Despite STSP Authority only play an assistant role to companies, from the result of this study, the STSP Authority plays a role of communication bridge between government and companies, it offer complete “after-care service” and deeply understand every problem that companies faced in each growth stages and work them out. Accordingly, STSP Authority must make efforts in enhancing and improving relationship among LCD firms.
From the results of this study, we know that coreness has significant influences on innovation performance. Hence, LCD firms could try to communicate or collaborate with firms which are core in network. The survey reveals that the main reason for many LCD firms settled in the STSP is attaching to key firms and sucking fruitful resources from them. They can utilize the attached-companies’ network position to access more information and knowledge, and enhance self-absorptive capacity and then improve their innovation performance. Therefore, at the company-level, the most important things for SMEs is how to access and stick in the network center, or at least attach to key actors.
Limitations and Outlook
Though the sample of LCD firms is enough (86%), return rate of other firms in optoelectronics industry is quite low (38%). It might result in statistical bias, such as the sample is less than 30. Besides, the measure of innovation performance is consists of three items, and respondents were asked to assess these items by their subjective opinions. It might also make our results bias. Moreover, to develop objective index to measure network competence and absorptive capacity in the future will be strongly commended.
In social network studies, relationships are usually specific to a particular domain. Researchers usually look at board ties, business ties, and etc. In this research, the main efforts only focus on communication relationship with collaboration, competition, and institutions. Maybe other types of relationships also have influence on innovation performance.
Future research should extend network scope. For example, future research could survey optoelectronics industry of different science park, industry, and even a country to examine effect on several subnetworks. Besides, future research should discuss actor’s attributes (e.g. innovativeness) and network features at the same time and the interaction effect between them.
Abernathy, J W, and Utterback, M J (1988). Patterns of industrial innovation. In the management of innovation (2nd.). LM Tushman, and LW Moore (eds.). Cambridge, MA: Ballinger/ Harper and Row.
Ahuja, G. (2000). Collaboration networks, structural holes, and innovation: A longitudinal study. Administrative Science Quarterly, 45, 425-455.
Anderson, P and ML Tushman (1990). Technological discontinuities and dominant designs: a cyclical model of technological change. Administrative Science Quarterly, 35, 604-633.
Arora, A and A Gambardella (1990). Complementarity and external linkages: The strategies of large firms in biotechnology. Journal of Industrial Economics, 38, 361-379.
Berg, S, J Duncan and P Friedman (1982). Joint Venture Strategies and Corporate innovation. Cambridge, MA: Oelgeschlager.
Biemans, WG (1992). Managing innovation within networks, London: Routledge.
Borgatti, PS, and G M Everett (1999). Models of core/periphery structures. Social Network, 21, 375-395. Burt, RS (1992). Structural Holes: The Social Structure of Competition. MA: Harvard University Press.
Cohen, WM and, DA Levinthal (1990). Absorptive capacity: A New Perspective on Learning and Innovation. Administrative Science Quarterly, 35 (1), 128-152.
Davis, FG (1991). Agents without principles? The spread of the poison pill through the intercorporate network. Administrative Science Quarterly, 36, 583-613.
Drejer, I, FS Kristensen and K Laursen (1999). Cluster studies as a basis for industrial policy: The case of Denmark. Industry and Innovation, 6, pp. 171-190.
Freeman, LC (1979). Centrality in Social Networks: Conceptual clarification. Social Networks, 1.
Gemunden HG, T Ritter (1997). Management technological networks: the concept of network competence. In Relationships and networks in international markets. HG Gemunden, T Ritter, A Walter (eds), 294-304.
Gemunden, HG., T Ritter, P Heydebreck (1996). Network configuration and innovation success: an empirical analysis in German high-tech industries. International Journal of Research Marketing, 13(5), 449-462.
Gulati, R (1995). Social structure and alliance formation patterns: A longitudinal analysis. Administrative Science Quarterly, 40, 619-652.
Gulati, R, and, M Garguilo (1999). Where do networks come from? American Journal of Sociology, 104, 1439-1493. Hakansson, H and, D Ford (2002). How should companies interact in business networks? Journal of Business Research,
55, 133-139.
Hargadon, A and IR Sutton (1997). Technology brokering and innovation in a product development firm. Administrative Science Quarterly, 38, 716-749.
Haunschild, RP (1993). Interorganizational imitation: The impact of interlocks on corporate acquisition activity. Administrative Science Quarterly, 38, 909-938.
Helfat, CE (1997). Know-how and asset complementarity and dynamic capability accumulation: the case of R&D. Strategic Management Journal, 18, 339-360.
Hurry, D, AT Miller, and EH Bowman (1992). Calls on high technology: Japanese exploration of venture capital investments in United States. Strategic Management Journal, 13, 85-101.
Kim, D and B Kogut (1996). Technological platforms and diversification. Organization Science, 7(3), 283-387.
Lane, PJ. and R Klavans (2005). Science Intelligence Capability and Innovation Performance: An Absorptive Capacity Perspective. International Journal of Technology Intelligence and Planning, 1(2), 185-204.
Li, T and RJ Calantone (1998). The impact of market knowledge competence on new product advantage: conceptualization and empirical examination. Journal of Marketing, 62, 13-29.
Mizruchi, SM (1989). Similarity of political behavior among large American corporations. American Journal of Sociology, 95, 401-424.
Nooy, WD, A Mrvar and V Batagelj (2005). Exploratory Social Network Analysis with Pajek. New York: Cambridge University Press.
Porter, ME (2000). Location, competition, and economic development: Local clusters in a global economy. Economic Development Quarterly, 14(1), 15-34.
Powell, WW, , WK Koput and L Smith-Doerr (1996). Interorganizational collaboration and the locus of innovation: Networks of learning in biotechnology. Administrative Science Quarterly, 41, 116-145.
Ritter, T (1999). The Networking Company. Industrial Marketing Management, 28, 467-479.
Ritter, T and HG Gemunden (2003). Network competence: Its impact on innovation success and its antecedents. Journal of Business Research, 56, 745-755.
Ritter, T and HG Gemunden (2004). The impact of a company’s business strategy on its technological competence, network competence and innovation success. Journal of Business Research, 57, 548-556.
Ritter, T, IF Wilkinson, and WJ. Johnston (2002). Measuring network competence: some international evidence. The Journal of Business and Industrial Marketing, 17(2/3), 119-138.
Press.
Shan, W, G Walker and B Kogut (1994). Interfirm cooperation and startup innovation in the biotechnology industry. Strategic Management Journal, 15, 387-394.
Smith-Owen, J and, WW Powell (2004). Knowledge networks as channels and conduits: The effects of spillovers in the Boston biotechnology community. Organization Science, 15, 5-21.
Tsai, W (2001). Knowledge Transfer In Intraorganizational Networks: Effects of Network Position and Absorptive Capacity on Business Unit Innovation and Performance. Academy of Management Journal, 44(5), 996-1004. Tsai, W and S Ghoshal (1998). Social Capital and Value Creation: The Role of Intrafirm Network. Academy of
Management Journal, 41(4), 464-477.
Zaheer, A and GG Bell (2005). Benefiting from network position: Firm capabilities, structural holes, and performance. Strategic Management Journal, 26, 809-825