行政院國家科學委員會補助專題研究計畫成果報告
※※※※※※※※※※※※※※※※※※※※※※※※※
※ ※
※
跨國產品擴散型態之連結: 以層級貝氏模型預測電影票房銷售
※
※
※
※※※※※※※※※※※※※※※※※※※※※※※※※
計畫類別:□個別型計畫
□整合型計畫
計畫編號:NSC89-2416-H-002-112-
執行期間:89 年 08 月 01 日至 90 年 07 月 31 日
計畫主持人:任立中
本成果報告包括以下應繳交之附件:
□赴國外出差或研習心得報告一份
□赴大陸地區出差或研習心得報告一份
□出席國際學術會議心得報告及發表之論文各一份
□國際合作研究計畫國外研究報告書一份
執行單位:國立台灣大學國際企業學系
中
華
民
國
90 年 08
月
15
日
行政院國家科學委員會專題研究計畫成果報告
跨國產品擴散型態之連結: 以層級貝氏模型預測電影票房銷售
THE LINKAGE OF CROSS-NATIONAL PRODUCT DIFFUSION
PATTERNS: AN APPLICATION FOR PREDICTING BOX-OFFICE
ATTENDANCE OF MOTION PICTURES
計畫編號:NSC 89-2416-H-002-112
執行期限:89 年 8 月 1 日至 90 年 7 月 31 日
主持人:任立中 國立台灣大學國際企業學系
共同主持人:無
計畫參與人員:陳靜怡 國立台灣大學國際企業學系
中文摘要 雖然對國際行銷人員而言,與擴散有關之新 產品上市策略是非常重要的議題,但過去只有很少 文獻探討跨國擴散。而且,這些探討多國擴散之研 究,多半只著重於消費者耐久財或工業性技術創新 產品。因此,本研究欲將跨國擴散模型延伸應用於 新奇流行品-電影之擴散型態,探討踦國與屬性因 素,後者包括類型、卡司、上映日期、創新及模仿 效果。本研究之主要目的是應用跨國擴散整合架 構,預測台灣即將上映電影之票房潛力,藉此在新 產品進入國外市場之前,產生跨國擴散型態之預 測。 關鍵詞:擴散模型、銷售預測、新產品成長 Abstr actAlthough diffusion-related new product launching strategies address critical issues for international marketing managers, only a few studies have explored cross-national diffusion. Also, previously published studies on multinational diffusion have concentrated mainly on consumer durable and industrial technological innovations. Hence, this study attempts to extend the knowledge in this area by empirically capturing the diffusion patterns of motion pictures, one kind of a novelty product, in cross-national context and integrating perceived attributes, including the genre, cast and release date of the movie and a lead-lag effect into a framework. In particular, the main objective of this research is to apply the proposed integrated framework for forecasting the box-office potential of new
motion pictures in Taiwan where sales data are not available. Thereby yielding some insights into the nature of the expected diffusion pattern in foreign countries prior to market entry.
Keywor ds: Diffusion Model, Sales Forecast,
New Product Growth
Intr oduction
The new product diffusion model has been one of the most important theories for explaining the formation of product life cycle in marketing literature since it was introduced by Bass (1969). However, it has not been accepted without criticisms. First of all, the model is post hoc in nature, which means that a historical dataset must exist before the parameters of the model can be estimated. Secondly, most research objects were consumer durable goods, such as automobiles and home appliances. For the most consumer goods with very short product life cycle, only a few researches was conducted by using fashion goods, such as motion pictures, as research objects. However, the purposes of those researches were aimed to study the optimal launch timing (Krider & Weinberg, 1998; Radas & Shugan, 1998) or to establish model of sales growth (Jedidi, Drider, & Weinberg, 1998). The issue about how to predict product life cycle before the announcement of the new product still remains un-addressed. Third, despite global marketing research is getting
more attentions in recent years, little efforts have been devoted to modeling and linking the diffusion patterns across countries. Thus, the purpose of this study is to build a model that can predict the diffusion patterns of a product before it is introduced into a foreign country. Specifically, we adopt the motion picture industry as the research object to explore the factors that influence the diffusion of American movies in America and to establish a model for predicting the sales of American movies in Taiwan market. This model will help the scholars and practitioners to better understand the characteristics of diffusion patterns in foreign countries and to forecast more accurately the product life cycle and to develop a more efficient marketing strategy.
The American movie industry based in Hollywood, California, USA, has been a global empire. Her products have been distributed all over the world. According to the survey of Motion Picture Association of America (1998), American movie industry produced 490 films and re-produced 19 films in 1998. In the same year, the revenue in US market was up to 6.9 billions US dollars. Its overseas revenue was even larger than that of North America area. In 1992, for example, its major overseas markets, in terms of revenue, were Europe (59%), Far Eastern Asia (30%), and Latin America (9%) (Dale, 1997). One of the major features of movie products, and of other fashion products, is the short life cycles and little repetitive purchase, which meet the assumptions of the diffusion model.
The diffusion theory and the empirical results of international diffusion research have suggested the following. First, the speed of diffusion is determined by such factors as customers’ perceptions on the attributes of the innovated products, the openness of the social systems, and the acceptability of the products to the society (Rogers, 1995). In this early efforts to model product diffusion across countries, we considered the effects of customers’ perceptions on product attributes only and included three major attributes in the model. The first one is the types of movies. Movie
type is one of the major movie attributes that would meet consumers’ needs (e.g. recreation, sensory excitement), or influences consumers’ beliefs or values. Litman (1983) has suggested that the types of movies affect sales performance. The second influential perceived attribute is the leading actor or actress of the movies. The audience often chose the movies solely because of the leading actor or actress. The third factor is seasonal effect. Movies launched at different time point of the year will have different pattern of diffusion (Radas & Shugan, 1998). Therefore, we predict that whether if the movie is launched on weekend or holidays will influence the diffusion pattern.
The pattern of diffusion in foreign countries is influenced by the lead-lag effects of product introduction. The fast development of international media has helped the distribution of product information across countries. Therefore, the lead-lag effect of movie introduction in foreign countries gives the foreign audiences an opportunity to learn about the movie before they go to theaters in their own countries. This opportunity, together with the advertising and the promotion campaigns of the movie, will positively affect the acceptance of the foreign audiences and help to speed up the product diffusion in the foreign countries. That is, the potential customers in the foreign countries will become the innovators through the international over-spill leaning effect, which is the combination of leading and lead-lag effects (Takada and Jain, 1991; Tseng, 1998).
On the premises of lead-lag effect, this study built a model on the basis of the diffusion record of the movies in America and the attributes of the movies. The results showed that their sales in Taiwan could be predicted accurately before they were introduced into Taiwan. This model can help to predict the diffusion pattern of innovated products at their introduction stage of life cycle and hence, to plan the marketing strategy and allocate marketing resources effectively.
Pr oduct Diffusion Model
Diffusion model is a set of quantitative functions used to describe the patterns of diffusion process which influence the form of product life cycle. It helps to forecast the success of the product at introduction stage and the sales volume in the whole life cycle. In marketing area, Bass (1969) has proposed a new product-first purchase model in which integrates the concepts of new product adoption and imitation. In this model, he classified new product customers into innovators and imitators. While the purchase decision of innovators depends on the message conveyed in the promotion campaign (i.e., external influence) and is not influenced by the opinions of the current users, the purchase decision of imitator is affected by the word-of-mouth of current users of the product (internal influence).
Drawing from hazard function, Bass built a diffusion model, as shown in equation (1), in which, at time t, the probability of a purchase made by an individual who has not purchased before time t is a linear function of the number of buyers prior to time t.
( )
( )
[
]
p qF( )
t t F t f = + − 1 where,f(t): the probability density function of purchase at time t
F(t): the cumulative distribution function of purchase at time t
The core argument of the Bass diffusion model is that the purchase probability at time t is positively associated with the number of purchasers before time t. The parameter q
reflects the imitation effect and the parameter
p represents the rate of innovation effect. If q equals zero, then f(t) is negative
exponential distributed.
Let the parameter m be the total number
of potential users. Then n(t)=m*f(t) is the
number of purchasers at time t and N(t)=m*F(t) indicates the cumulative number
of purchasers at time t. Using the preceding definitions as a basis, n(t) can be derived as shown in equation (2).
( )
( )
[
( )
]
( )
t[
m N( )
t]
N m q t N m p t d t N d t n − + − = = (2)The term p[m - N(t)] in equation (2)
indicates the number of innovators who are not affected by the current users before time (t). The term (q/m) N(t)[m - N(t)] in the
same equation represents the number of imitators who become users due to the influence of the current users before time t.
Note that when the time t in equation (2)
is equal to zero, the function n(0) will equal
pm. If q>p, then the sales curve will be in
the form of an inverted U shape. If q≤p, then the sales curve will decline continuously (Figure 1).
Mahajan, Mason, and Srinivasan (1986) have suggested that non-linear least-squared method is the best approach to estimating the parameters of Bass’s diffusion model. Following the suggestion of Mahajan et al., this study used non-linear least-squared method to estimate the three parameters of Bass’s diffusion model: innovation coefficient (p), imitation coefficient (q), and
market potential (m).
Equation (1) can result in equation (3) shown below. ) ) ( 1 ( ) ) ( ( ) ( ) ( p qF t F t t d t F d t f = = + − (3)
Let F(t = t0 = 0) = 0 and integrate equation
(3), we can obtain equation (4).
t q p t q p e p q e t F ( ) ) ( ) / ( 1 1 ) ( − + + − + − = (4) Let − − − − ) ( 1 ) ( ) ( 1 1 i i i t F t F t F denotes the probability of an individual who makes purchase at time t but did not at time ti-1 and
before. We can estimate the parameters of innovation coefficient (p), imitation coefficient (q), and market potential (m) by
equation (5). i i i i i e t F t F t F t N m i X + − − − = − − − ) ( 1 ) ( ) ( ) ) ( ( ) ( 1 1 1 (5) where,
x(i): the total purchasers at time t (time period of (ti-1,ti))
m: market potential
N(ti-1): the cumulative purchasers at
time ti-1
F(ti) = N(t)/m = the purchase ratio at
time ti
ei = error term Data
This study chose those motion pictures that were announced between October 1997 and December 1998 and that were among top 100 sales ranking in the US market. Among them, those motion pictures that were played for more than three weeks in Taiwan were retained as parts of this study. A total of 51 motion pictures of different types were obtained. The motion picture Titanic was excluded because it was believed that most the audiences had seen it more than once. Thus, Titanic did not fit the purpose of Bass’s diffusion model for first purchase.
The analysis unit was the total amount of audiences of a week (from Friday to next Thursday). The audience amounts in the announcement weeks that did not include weekends were not included as parts of the study.
Except for the box-office in Taipei metropolitan area, no reliable record was available for the rest of Taiwan area. However, a rule of thumbs used very often by the owners of theaters was to simply multiply the total box-office of Taipei market by two to estimate the total box-office of the entire Taiwan market (Lu, 1997). This study followed this rule of thumbs to estimate the total sales of American motion pictures in Taiwan market on the basis of their sales in Taipei. The record of box-office of Taipei market was offered by Taipei Motion Picture Association. The chosen record ranged from December 19, 1997 to March 1999.
The total amount of audiences per week of the US market was estimated by dividing the total dollar sales by the average ticket fee of 5 US dollars. The total dollar sales were surveyed and reported by AC Nielsen EDI and Variety magazine. The record chosen
ranged from October 17, 1997 to February 1999.
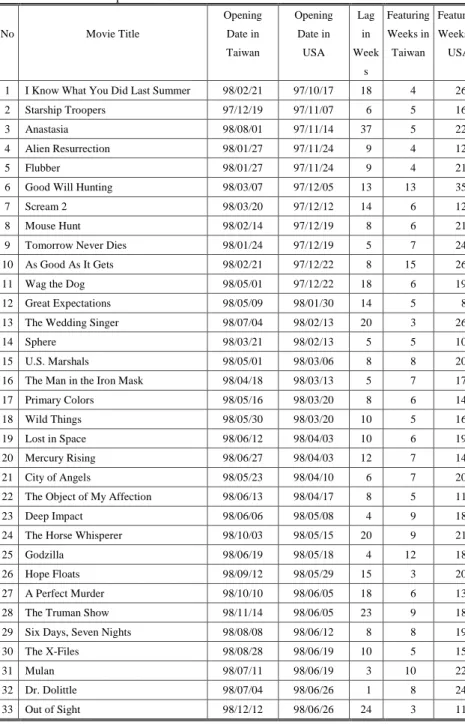
The 51 motion pictures included in this study can be classified into action (10), science fiction (8), comedy (7), drama (6), animation (4), love story (12), and horror (4). Table 1 presents the announcement date in USA and Taipei, the difference of announcement date in weeks between USA and Taipei, and the number of weeks in which data were collected for each motion picture.
The average announcement date difference was 10 weeks. The animation, Anastasia, had a maximum difference of 37 weeks because the audience in Taipei was the young who had more free time in summer vacation. The 51 motion pictures were played in USA for a time length ranging from 19 to 23 weeks. They were played in Taiwan for an average of 7 weeks. Most of the 51 motion pictures attracted most of the audience within the first weeks after they were announced. The sales curve was in an exponential shape and was presented in Table 1b, which fitted Bass’s diffusion model in which p ≥ q. The exponential pattern of diffusion can be attributed to the wide release strategy of the motion picture agents.
Quite often, motion picture agents choose between wide release strategy and platform release strategy. Motion pictures with high budget and great casts often were released under wide release strategy. That is, the agents have most of the theaters play the motion picture at the same time from the beginning. They decrease the number of theaters playing the motion pictures in proportional to decline in demand and decrease in number of audience. In contrast, the platform release strategy begins by having a few theaters play the motion pictured promoted. After accepted by the audience to some extent, the number of theaters increases to all over the country.
【Insert Table 1 here】
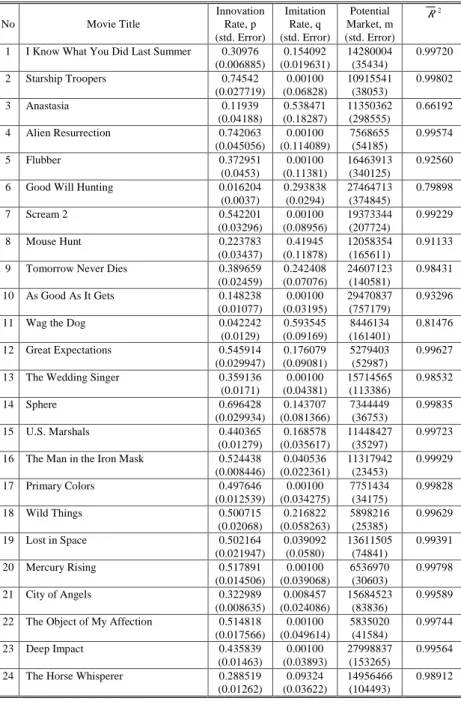
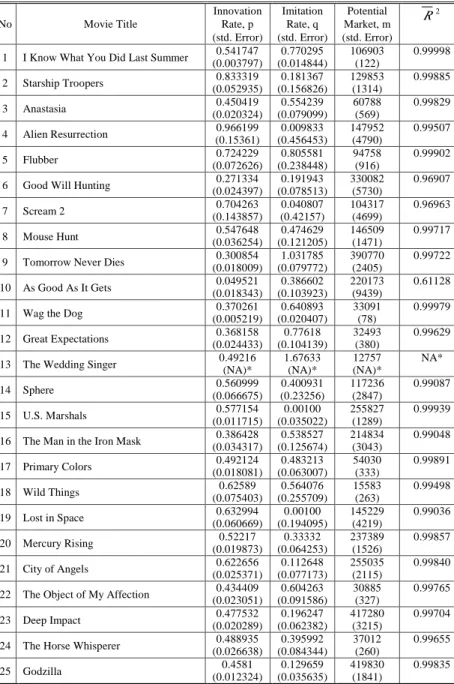
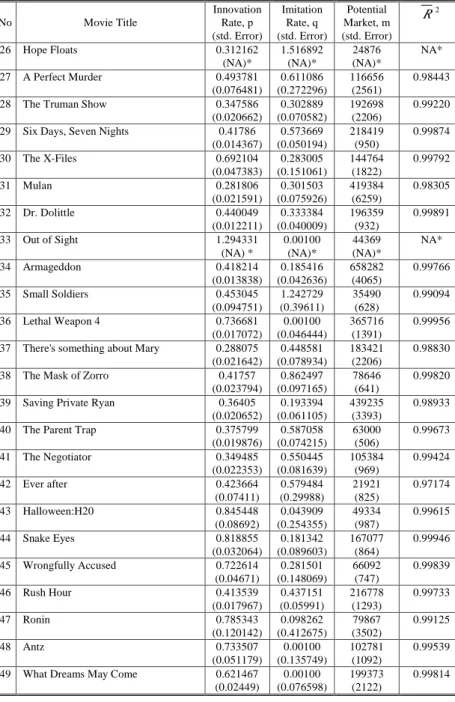
On the basis of Bass diffusion model, non-linear least-squared analyses were conducted to estimate the diffusion
coefficients for USA and for Taiwan markets. The results were presented in Table 2 and Table 3, respectively.
Most of the 2
R ’s were high, indicating
that the goodness of fit were significant. The motion pictures that had a low 2
R in USA were Anastasia (0.66192), Good Will Hunting (0.79898), and Wag the Dog
(0.81476). In Taiwan, only As Good As It Gets was low (0.61128).
The diffusion coefficients indicate that most the diffusion pattern of American motion pictures was in an exponential shape, which were different from the pattern of durable consumer goods. The innovation coefficient, p, of several science fictions and
one horror (Halloween:H20) were the highest
in USA. In Taiwan, the action motion picture (Out of Sight) and the horror motion
picture (Bride of Chucky ) had the highest p.
Some science fiction and horror movies also had high innovation coefficients.
The imitation coefficients, q, of 19
movies in USA were very low. A re-estimation was made by setting the lower bound limit at 0.001. The movies that had the highest q were Wag the Dog, Anastasia,
and Mouse Hunt. In Taiwan, The Wedding
Singer, Hope Floats, Small Soldiers, and Tomorrow Never Dies had the highest values
in imitation coefficients.
【Insert Table 2 here】 【Insert Table 3 here】
The results show that the diffusion coefficients, particularly imitation coefficients, of Taiwan tended to be higher than those of USA, indicating that the diffusion patterns were different between these two countries.
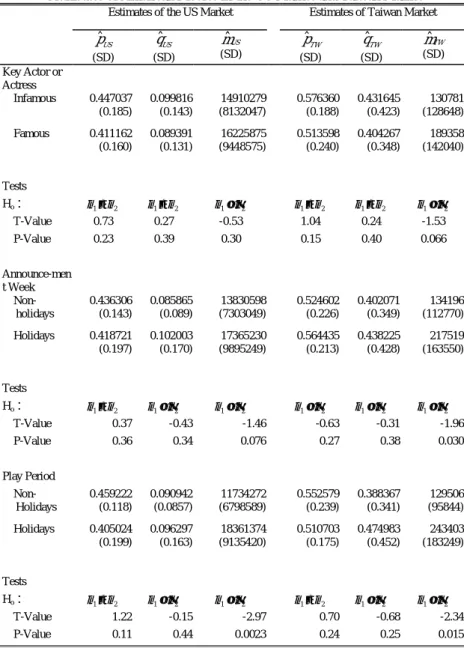
Table 4 and Table 5 present the differences in diffusion coefficients between Taiwan and USA when the following factors were taken into consideration. For USA data, the factors included whether the key actor or actress was famous, whether the movie was announced during such major holidays as summer vacation, Thanksgiving day, Christmas and New Year holiday(Radas
& Shugan, 1998). For Taiwan data, the factors included whether the announcement day was within summer vacation, New Year holidays, or Chinese lunar new year holidays.
Table 4 shows that the potential market of comedies and science fictions were the highest in USA. In Taiwan, science fictions and actions were most preferred by the audience. The results in Table 5 indicate that whether the movies played during holidays had a significant influence on the box-office both in USA and in Taiwan. Whether the key actor or actress was famous was significantly related to the potential market in Taiwan.
【Insert Table 4 here】 【Insert Table 5 here】
Sales Forecast Model
Based on Bass’s diffusion model, this study analyzed the diffusion patterns of American motion pictures in America and Taiwan, followed by multiple regression analyses with an aim to identifying the factors influencing the diffusion patterns and to building a prediction model.
To build a sales prediction model, seemingly unrelated regression (SUR) analyses were conducted to identify the factors that influenced the leading effect and lead-lag effect on the diffusion of American movies in Taiwan. The model is shown as in equations (6)-(8).
yp = xβp +εp (6) (6)
yq = xβq +εq (7) (7)
ym = xβm +εm (8) (8)
where,
yp : the innovation coefficient matrix of
diffusion model for innovated products in Taiwan market
yq : the imitation coefficient matrix of
diffusion model for innovated products in Taiwan market
ym : the potential market matrix of
diffusion model for innovated products in Taiwan
x : matrix of independent variables, including constants
βp : matrix of influence coefficients
of innovation propensity
βq : matrix of influence coefficients
of imitation propensity
βm : matrix of influence coefficients
of market potential
εp ,εq ,εm : error terms matrix
Empirical studies have suggested that the time-lag of product introduction give the potential adopters of foreign countries an opportunity to learn about how the product have diffused successfully in the innovation country. This helps to reduce the risk and to speed up the diffusion rate in adoption countries. We hypothesize that the leading and lead-lag effects should make the experience of successful diffusion can be easily learned by the foreign potential innovators through the helps of international media. That is, the innovation coefficient (USp), imitation coefficient(USq), and
potential market(USm,in million people)
in USA should affect the diffusion pattern in Taiwan.
To test the hypothesis, the movies included in this study were re-classified into four types: horror, science fiction, drama, and others. Type of motion pictures was considered as an antecedent of diffusion pattern and was recoded by dummy variables.
The evaluation of the influence of the fame of movie stars on diffusion patterns were made based on the results of survey conducted to rate the value of movie stars to box-office (The International Entertainment Weekly, 1998). Since not all movie stars were included in the ranking, a dummy variable (STR) was created to measure whether the key actor or actress was in the ranking would have a significance on diffusion pattern. The rank of the movie stars (RNK) was used to evaluate wheterh the key actor or actress was in the rank would influence the box-office.
Lu (1997) has suggested that in Taiwan, the amount of movie audience was at its peak during summer vacation, New Year holidays, and Chinese lunar New Year holiday. Thus, a dummy variable (HDYp) was created to
reflect the influences of whether the
announcement day was during holidays on innovation coefficients. A dummy variable (HDYq) was used to reflect the influences of
whether the movies were played during summer vacations, lunar Chinese new year holidays, and winter vacations on imitation coefficients. Basically, the two dummy variables were used to measure the effects of holidays (HDYm) on market potential.
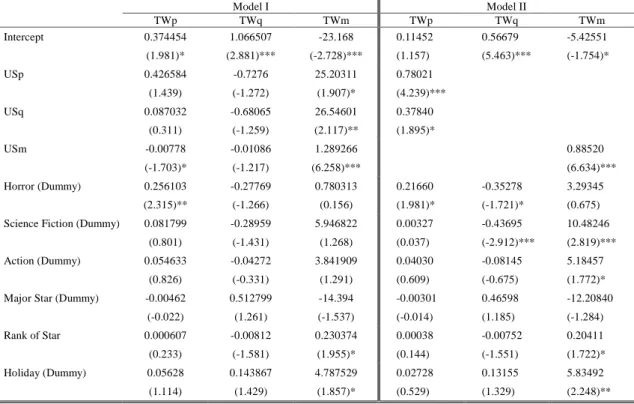
Table 6 presents the results of the SUR model for the prediction of diffusion patterns of American movies in Taiwan. The results of model 1 indicated that the diffusion patterns of American movies in Taiwan were influences by factors inside Taiwan society, not by the factors in American society. Due to the intercorrelations among the diffusion coefficients, the diffusion coefficients in America were not significant. In model 2, the influences of diffusion coefficients in American on those in Taiwan were analyzed and the sales of American movies in Taiwan were predicted. The model was shown below. TWp =αp + β1USp+ β2 USq+ β3 HR+ β4 SF+ β5 DR+ β6 STR+ β7 RNK + β8 HDYp +εp TWq = αq + γ1HR+ γ2 SF+ γ3DR+ γ4 STR+ γ5 RNK + γ6 HDYq+εq TWm = αm +η1USm+ η2HR+ η3SF+ η4DR+ η5 STR+ η6 RNK + η6 HDYm+εm
TWp, TWq, and TWm represented the
innovation coefficient, imitation coefficient, and potential market (in millions of people) of American movies in Taiwan, respectively. HR, SF, and DR indicated horror movies, science fiction movies and drama, respectively. The definitions of the other variables were the same as before.
【Insert Table 6 here】
The contribution of this study was to build a prediction model of the sales of American movies in Taiwan on the basis of limited information. That is, only the experience of diffusion in America and the attributes of the movies were used for the prediction of sales in Taiwan. This model is
particularly valuable for predicting the sales in the product introduction stage when the diffusion pattern is exponential distributed.
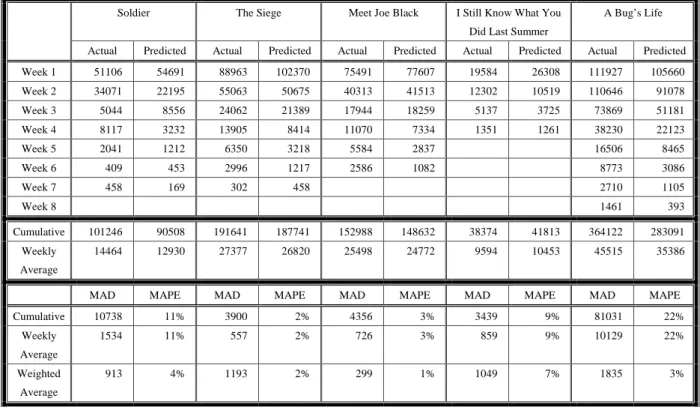
To test the prediction ability of the model, the prediction of 5 different types of movies: Soldier, The Siege, Meet Joe Black, I Still Know What You Did Last Summer, and A Bug’s Life, were conducted. The
prediction performance was indicated by mean absolute deviation (MAD) and root mean squared error (RMSE) in Table 7. Figure 2 represented the comparison between the actual and the predicted sales of the aforementioned movies in Taiwan. The results showed that the predictive performance of the model was satisfactory. The prediction of the movie A Bug’s Life
deserves more attention. A Bug’s Life was
promoted very intensively with several peripheral measures when it was played in Taiwan, which greatly influenced its diffusion pattern in Taiwan. However, such marketing factors were not taken into consideration in our model.
【Insert Table 7 here】 【Insert Figure 2 here】
Conclusions
To our best knowledge, few studies have been conducted to analyze the across-countries diffusion of American movies. Using the time-lag of product introduction as a premises, the study integrated the effects of the experience of diffusion in American and the attributes of the movies to build a prediction model for estimating the sales of American movies in Taiwan before they were introduced into Taiwan. This model is of particularly importance when the product analyzed is of fashion nature and when the sales of the product is exponential distributed across time. The satisfactory predictive performance of the model proposed in this study can help to understand and predict the diffusion pattern of a product before it is introduced into Taiwan, and help firms to form effective marketing strategies and allocate marketing
resources optimally.
The diffusion theory suggests that the difference in the structure of social culture leads to differentiated acceptability of innovated products to the society and differentiated preference to the diffusion channels. A comparison and contrast between the diffusion patterns of American movies in America and Taiwan indicates that the imitation coefficients of Taiwan market were larger than those of American market. This implied that word-of-mouth was the most preferable communication method in Taiwan market of such features as emphasizing inter-personal relationship, valuing others’ opinions, and communicating in a high-contextual way. Thus, the marketers of American movies in Taiwan should not only rely on mass media to promote their products, but also make best use of such events as movie previews and rehearsals.
In contrast to durable consumer goods, the diffusion of fashion products is influenced more by external factors. Therefore, according the data from American Motion Picture Association, the high expenditure ratio of advertising for promoting American movies in America implies that advertising expenditure can be one of the influential factors of the diffusion of American movie in America. We, however, did not include advertising expenditure in our model because such data were not available in Taiwan. Another limitation is that we used the sales record of Taipei market only to conduct the analyses. This might limit the generalizability of the inference made in this study to the whole Taiwan market.
Since cultures could shape the pattern the diffusion, whether the model could be applied to other countries deserves further study. The fact that the overseas revenue of American movies is larger than that of domestic market should warrant the efforts of analyzing the differences in diffusion patterns of American movies across countries and using the similarity in diffusion pattern to segment the global market.
Refer ence
[1] Bass, Frank Myron (1969), "A New
Product Growth for Model Consumer Durables", Management Science, Vol. 15,
No. 5, pp. 215~227.
[2] Dale, Martin (1997), The Movie Game :
the Film Business in Britain, Europe and America, London : Cassell.
[3] Eliashberg, Jehoshua and Steven M.
Shugan (1997), "Film Critics: Influencers or Predictors?", Journal of Marketing,
Vol. 61, No. 2, pp. 68~78.
[4] Ganesh, Jaishankar and V. Kumar (1996),
"Capturing the Cross-National Learning Effect: An Analysis of an Industrial Technology Diffusion", Journal of the Academy of Marketing Science, Vol.24,
No.4, pp. 328~337.
[5] Jedidi, Kamel, Robert E. Krider, and
Charles B. Weinberg (1998), "Clustering at the Movies", Marketing Letters, Vol. 9,
No. 4, pp. 393~405.
[6] Lu, F. I. (1997), An analysis of Taiwan’s
Movie Market of 1994, Broadcasting and Television, 3 (1), pp. 167-191.
[7] Tseng, Hui-Fang (1998), The Influence of
Cross-Cultural Difference on New
Product Diffusion, unpublished thesis,
Graduate Institute of International Business Studies, National Chi-Nan University, Taiwan.
[8] Krider, Robert E., Charles B. Weinberg
(1998), "Competitive Dynamics and the Introduction of New Products: The Motion Picture Timing Game", Journal of Marketing Research, Vol. 35, No. 1, pp.
1~15.
[9] Kumar, V., Jaishankar Ganesh and Raj
Echambadi (1998), "Cross-National Diffusion Research: What Do We Know and How Certain Are We ?", Journal of Product Innovation Management, Vol.15,
No.3, pp. 255~268.
[10] Litman, Barry R. (1983), "Predicting
Success of Theatrical Movies : An Empirical Study", Journal of Popular Culture, Vol. 16, pp. 159~175.
[11] Mahajan, Vijay and Yoram Wind
(1986a), Innovation Diffusion Models of New Product Acceptance, Cambridge,
MA: Ballinger Publishing Company. , Charlotte H. Mason, and V. Srinivasan (1986), "An Evaluation of Estimation Procedures for New Product Diffusion Models" in Innovation Diffusion Models of New Product Acceptance, Vijay Mahajan and Yoram
Wind, eds. Cambridge, MA: Ballinger
Publishing Company. , Eitan Muller, and Frank
M. Bass (1990), "New Product Diffusion Models in Marketing: A Review and Directions for Research", Journal of Marketing, Vol.54, January, pp. 1~26.
[12] Radas, Sonja, and Steven M. Shugan
(1998), "Seasonal Marketing and Timing New Product Introductions", Journal of Marketing Research, Vol.35, No.2,
pp296-315.
[13] Rogers, Everett M. (1995), Diffusion of
Innovations, 4th ed., New York: The Free
Press.
[14] Sawhney, Mohanbir S. and Jehoshua
Eliashberg (1996), "A Parsimonious Model for Forecasting Gross Box-Office Revenues of Motion Pictures",
Marketing Science, Vol. 15, No. 2, pp.
113~131.
[15] Takada, Hirokazu and Dipak Jain (1991),
"Cross-National Analysis of Diffusion of Consumer Durable Goods in Pacific Rim Countries", Journal of Marketing, Vol.
10
n(t) n(t)
t t
(a) q > p (b) q < p Figure 1 Product Life Cycles based on relative values of p and q
11 F i g u r e 2 ( c ) F o r e c a s t i n g R e s u l t s : W e e k l y B o x - O f f i c e A t t e n d a n c e ( M e e t J o e B l a c k ) 0 5 , 0 0 0 1 0 , 0 0 0 1 5 , 0 0 0 2 0 , 0 0 0 2 5 , 0 0 0 3 0 , 0 0 0 3 5 , 0 0 0 4 0 , 0 0 0 4 5 , 0 0 0 5 0 , 0 0 0 5 5 , 0 0 0 6 0 , 0 0 0 6 5 , 0 0 0 7 0 , 0 0 0 7 5 , 0 0 0 8 0 , 0 0 0 8 5 , 0 0 0 0 1 / 0 1 / 9 9 0 1 / 0 8 / 9 9 0 1 / 1 5 / 9 9 0 1 / 2 2 / 9 9 0 1 / 2 9 / 9 9 0 2 / 0 5 / 9 9 W e e k
Weekly B.O. Attendance
F i g u r e 2 ( d ) F o r e c a s t i n g R e s u l t s : W e e k l y B o x - O f f i c e A t t e n d a n c e ( I S t i l l K n o w W h a t Y o u D i d L a s t S u m m e r ) 0 3 , 0 0 0 6 , 0 0 0 9 , 0 0 0 1 2 , 0 0 0 1 5 , 0 0 0 1 8 , 0 0 0 2 1 , 0 0 0 2 4 , 0 0 0 2 7 , 0 0 0 3 0 , 0 0 0 0 1 / 1 5 / 9 9 0 1 / 2 2 / 9 9 0 1 / 2 9 / 9 9 0 2 / 0 5 / 9 9 W e e k
Weekly B.O. Attendance
F i g u r e 2 ( e ) F o r e c a s t i n g R e s u l t s : W e e k l y B o x - O f f i c e A t t e n d a n c e ( A B u g ' s L i f e ) 0 1 0 , 0 0 0 2 0 , 0 0 0 3 0 , 0 0 0 4 0 , 0 0 0 5 0 , 0 0 0 6 0 , 0 0 0 7 0 , 0 0 0 8 0 , 0 0 0 9 0 , 0 0 0 1 0 0 , 0 0 0 1 1 0 , 0 0 0 1 2 0 , 0 0 0 0 2 / 0 5 / 9 9 0 2 / 1 2 / 9 9 0 2 / 1 9 / 9 9 0 2 / 2 6 / 9 9 0 3 / 0 5 / 9 9 0 3 / 1 2 / 9 9 0 3 / 1 9 / 9 9 0 3 / 2 6 / 9 9 W e e k
Weekly B.O. Attendance
F i g u r e 2 ( b ) F o r e c a s t i n g R e s u l t s : W e e k l y B o x - O f f i c e A t t e n d a n c e ( T h e S i e g e ) 0 1 0 , 0 0 0 2 0 , 0 0 0 3 0 , 0 0 0 4 0 , 0 0 0 5 0 , 0 0 0 6 0 , 0 0 0 7 0 , 0 0 0 8 0 , 0 0 0 9 0 , 0 0 0 1 0 0 , 0 0 0 1 1 0 , 0 0 0 1 2 / 0 4 / 9 8 1 2 / 1 1 / 9 8 1 2 / 1 8 / 9 8 1 2 / 2 5 / 9 8 0 1 / 0 1 / 9 9 0 1 / 0 8 / 9 9 0 1 / 1 5 / 9 9 W e e k
Weekly B.O. Attendance
F i g u r e 2 ( a ) F o r e c a s t i n g R e s u l t s : W e e k l y B o x - O f f i c e A t t e n d a n c e ( S o l d i e r ) 0 5 , 0 0 0 1 0 , 0 0 0 1 5 , 0 0 0 2 0 , 0 0 0 2 5 , 0 0 0 3 0 , 0 0 0 3 5 , 0 0 0 4 0 , 0 0 0 4 5 , 0 0 0 5 0 , 0 0 0 5 5 , 0 0 0 6 0 , 0 0 0 1 2 / 0 4 / 9 8 1 2 / 1 1 / 9 8 1 2 / 1 8 / 9 8 1 2 / 2 5 / 9 8 0 1 / 0 1 / 9 9 0 1 / 0 8 / 9 9 0 1 / 1 5 / 9 9 W e e k
Weekly B.O. Attendance
A c t u a l P r e d i c t e d
12
Table 1. The Descriptions for Selected Motion Pictures Shown in the USA and in Taiwan
No Movie Title Opening Date in Taiwan Opening Date in USA Lag in Week s Featuring Weeks in Taiwan Featuring Weeks in USA
1 I Know What You Did Last Summer 98/02/21 97/10/17 18 4 26
2 Starship Troopers 97/12/19 97/11/07 6 5 16
3 Anastasia 98/08/01 97/11/14 37 5 22
4 Alien Resurrection 98/01/27 97/11/24 9 4 12
5 Flubber 98/01/27 97/11/24 9 4 21
6 Good Will Hunting 98/03/07 97/12/05 13 13 35
7 Scream 2 98/03/20 97/12/12 14 6 12
8 Mouse Hunt 98/02/14 97/12/19 8 6 21
9 Tomorrow Never Dies 98/01/24 97/12/19 5 7 24
10 As Good As It Gets 98/02/21 97/12/22 8 15 26
11 Wag the Dog 98/05/01 97/12/22 18 6 19
12 Great Expectations 98/05/09 98/01/30 14 5 8
13 The Wedding Singer 98/07/04 98/02/13 20 3 26
14 Sphere 98/03/21 98/02/13 5 5 10
15 U.S. Marshals 98/05/01 98/03/06 8 8 20
16 The Man in the Iron Mask 98/04/18 98/03/13 5 7 17
17 Primary Colors 98/05/16 98/03/20 8 6 14
18 Wild Things 98/05/30 98/03/20 10 5 16
19 Lost in Space 98/06/12 98/04/03 10 6 19
20 Mercury Rising 98/06/27 98/04/03 12 7 14
21 City of Angels 98/05/23 98/04/10 6 7 20
22 The Object of My Affection 98/06/13 98/04/17 8 5 11
23 Deep Impact 98/06/06 98/05/08 4 9 18
24 The Horse Whisperer 98/10/03 98/05/15 20 9 21
25 Godzilla 98/06/19 98/05/18 4 12 18
26 Hope Floats 98/09/12 98/05/29 15 3 20
27 A Perfect Murder 98/10/10 98/06/05 18 6 13
28 The Truman Show 98/11/14 98/06/05 23 9 18
29 Six Days, Seven Nights 98/08/08 98/06/12 8 8 19
30 The X-Files 98/08/28 98/06/19 10 5 15
31 Mulan 98/07/11 98/06/19 3 10 22
32 Dr. Dolittle 98/07/04 98/06/26 1 8 24
13
34 Armageddon 98/07/24 98/06/29 4 10 22
35 Small Soldiers 98/09/12 98/07/10 9 5 19
36 Lethal Weapon 4 98/08/21 98/07/10 6 8 17
37 There's something about Mary 98/10/23 98/07/13 14 9 31
38 The Mask of Zorro 98/08/07 98/07/17 3 5 26
39 Saving Private Ryan 98/09/25 98/07/24 9 16 16
40 The Parent Trap 98/08/29 98/07/27 4 7 18
41 The Negotiator 98/10/31 98/07/27 13 8 16 42 Ever after 98/10/10 98/07/31 10 5 22 43 Halloween:H20 98/11/12 98/08/03 14 5 17 44 Snake Eyes 98/10/23 98/08/07 11 6 19 45 Wrongfully Accused 98/09/11 98/08/21 3 5 8 46 Rush Hour 98/09/26 98/09/18 1 9 23 47 Ronin 98/11/28 98/09/25 9 4 13 48 Antz 98/11/07 98/10/02 5 9 20
49 What Dreams May Come 98/12/24 98/10/02 12 7 15
50 Bride of Chucky 98/12/24 98/10/16 10 6 13
14
Table 2. The Estimation of Diffusion Model for Movies in US Market
No Movie Title Innovation Rate, p (std. Error) Imitation Rate, q (std. Error) Potential Market, m (std. Error) 2 R
1 I Know What You Did Last Summer 0.30976 (0.006885) 0.154092 (0.019631) 14280004 (35434) 0.99720 2 Starship Troopers 0.74542 (0.027719) 0.00100 (0.06828) 10915541 (38053) 0.99802 3 Anastasia 0.11939 (0.04188) 0.538471 (0.18287) 11350362 (298555) 0.66192 4 Alien Resurrection 0.742063 (0.045056) 0.00100 (0.114089) 7568655 (54185) 0.99574 5 Flubber 0.372951 (0.0453) 0.00100 (0.11381) 16463913 (340125) 0.92560 6 Good Will Hunting 0.016204
(0.0037) 0.293838 (0.0294) 27464713 (374845) 0.79898 7 Scream 2 0.542201 (0.03296) 0.00100 (0.08956) 19373344 (207724) 0.99229 8 Mouse Hunt 0.223783 (0.03437) 0.41945 (0.11878) 12058354 (165611) 0.91133 9 Tomorrow Never Dies 0.389659
(0.02459) 0.242408 (0.07076) 24607123 (140581) 0.98431 10 As Good As It Gets 0.148238 (0.01077) 0.00100 (0.03195) 29470837 (757179) 0.93296
11 Wag the Dog 0.042242
(0.0129) 0.593545 (0.09169) 8446134 (161401) 0.81476 12 Great Expectations 0.545914 (0.029947) 0.176079 (0.09081) 5279403 (52987) 0.99627 13 The Wedding Singer 0.359136
(0.0171) 0.00100 (0.04381) 15714565 (113386) 0.98532 14 Sphere 0.696428 (0.029934) 0.143707 (0.081366) 7344449 (36753) 0.99835 15 U.S. Marshals 0.440365 (0.01279) 0.168578 (0.035617) 11448427 (35297) 0.99723 16 The Man in the Iron Mask 0.524438
(0.008446) 0.040536 (0.022361) 11317942 (23453) 0.99929 17 Primary Colors 0.497646 (0.012539) 0.00100 (0.034275) 7751434 (34175) 0.99828 18 Wild Things 0.500715 (0.02068) 0.216822 (0.058263) 5898216 (25385) 0.99629 19 Lost in Space 0.502164 (0.021947) 0.039092 (0.0580) 13611505 (74841) 0.99391 20 Mercury Rising 0.517891 (0.014506) 0.00100 (0.039068) 6536970 (30603) 0.99798 21 City of Angels 0.322989 (0.008635) 0.008457 (0.024086) 15684523 (83836) 0.99589 22 The Object of My Affection 0.514818
(0.017566) 0.00100 (0.049614) 5835020 (41584) 0.99744 23 Deep Impact 0.435839 (0.01463) 0.00100 (0.03893) 27998837 (153265) 0.99564 24 The Horse Whisperer 0.288519
(0.01262) 0.09324 (0.03622) 14956466 (104493) 0.98912
15 25 Godzilla 0.723602 (0.05692) 0.00100 (0.13733) 23270428 (168682) 0.98903 26 Hope Floats 0.398717 (0.011906) 0.00100 (0.031364) 11837686 (59154) 0.99573 27 A Perfect Murder 0.38068 (0.012354) 0.167255 (0.036755) 13593096 (71840) 0.99701
28 The Truman Show (0.009287)0.432323 (0.024973)0.01641 25081559(85073) 0.99824 29 Six Days, Seven Nights 0.368744
(0.015235) 0.08555 (0.042681) 14701948 (90059) 0.99270 30 The X-Files (0.028084)0.675349 (0.070676)0.00100 16572578(78210) 0.99705 31 Mulan 0.362699 (0.009584) 0.098846 (0.026533) 23893228 (82102) 0.99666 32 Dr. Dolittle 0.375516 (0.006881) 0.00100 (0.01809) 28630900 (79762) 0.99808 33 Out of Sight 0.552417 (0.013581) 0.13630 (0.038472) 7471063 (26529) 0.99905 34 Armageddon 0.365532 (0.01189) 0.00100 (0.03103) 36227757 (198379) 0.99404 35 Small Soldiers (0.010428)0.500884 (0.027648)0.056531 10830062(27254) 0.99865 36 Lethal Weapon 4 0.489864 (0.009099) 0.018257 (0.024265) 25758976 (69606) 0.99893
37 There's something about Mary 0.137277(0.00526) (0.01605)0.068834 34641229(252334) 0.98281 38 The Mask of Zorro 0.432104
(0.014852) 0.00100 (0.037384) 18459017 (80739) 0.99364
39 Saving Private Ryan 0.295765 (0.00501) 0.00100 (0.01499) 38433075 (184828) 0.99836
40 The Parent Trap 0.373142
(0.007656) 0.042279 (0.021274) 12177400 (42769) 0.99816 41 The Negotiator 0.474242 (0.019405) 0.00100 (0.052297) 8236574 (56361) 0.99459 42 Ever after (0.006272)0.251142 (0.018261)0.095934 13120297(53976) 0.99597 43 Halloween:H20 0.701849 (0.032419) 0.00100 (0.080962) 9134546 (41524) 0.99633 44 Snake Eyes (0.019674)0.516726 (0.050164)0.00100 11050826(55215) 0.99525 45 Wrongfully Accused 0.687545 (0.05393) 0.242675 (0.154845) 1902246 (18500) 0.99594 46 Rush Hour 0.342731 (0.0172) 0.00100 (0.04484) 27639159 (242050) 0.98434 47 Ronin 0.502712 (0.015926) 0.004336 (0.04348) 8360143 (47513) 0.99750 48 Antz 0.25907 (0.01365) 0.11363 (0.04038) 18038275 (158588) 0.98404
49 What Dreams May Come (0.007773)0.427867 (0.022239)0.164076 11083806(27008) 0.99909
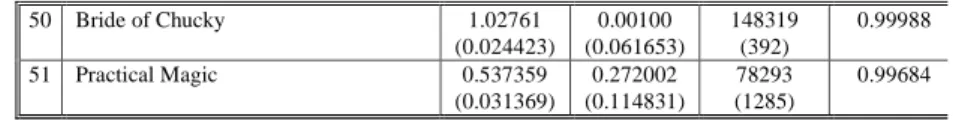
50 Bride of Chucky 0.53909 (0.015645) 0.199109 (0.044112) 6444656 (21810) 0.99858 51 Practical Magic (0.020294)0.428023 (0.058467)0.139362 9293657(65997) 0.99390
16
Table 3. The Estimation of Diffusion Model for Movies in Taiwan
No Movie Title Innovation Rate, p (std. Error) Imitation Rate, q (std. Error) Potential Market, m (std. Error) 2 R
1 I Know What You Did Last Summer 0.541747 (0.003797) 0.770295 (0.014844) 106903 (122) 0.99998 2 Starship Troopers (0.052935)0.833319 (0.156826)0.181367 129853(1314) 0.99885 3 Anastasia 0.450419 (0.020324) 0.554239 (0.079099) 60788 (569) 0.99829 4 Alien Resurrection 0.966199(0.15361) (0.456453)0.009833 147952(4790) 0.99507 5 Flubber 0.724229 (0.072626) 0.805581 (0.238448) 94758 (916) 0.99902
6 Good Will Hunting 0.271334 (0.024397) 0.191943 (0.078513) 330082 (5730) 0.96907 7 Scream 2 0.704263 (0.143857) 0.040807 (0.42157) 104317 (4699) 0.96963 8 Mouse Hunt 0.547648 (0.036254) 0.474629 (0.121205) 146509 (1471) 0.99717
9 Tomorrow Never Dies (0.018009)0.300854 (0.079772)1.031785 390770(2405) 0.99722 10 As Good As It Gets 0.049521 (0.018343) 0.386602 (0.103923) 220173 (9439) 0.61128
11 Wag the Dog (0.005219)0.370261 (0.020407)0.640893 33091(78) 0.99979 12 Great Expectations 0.368158 (0.024433) 0.77618 (0.104139) 32493 (380) 0.99629
13 The Wedding Singer 0.49216(NA)* 1.67633(NA)* 12757(NA)* NA*
14 Sphere 0.560999 (0.066675) 0.400931 (0.23256) 117236 (2847) 0.99087 15 U.S. Marshals 0.577154 (0.011715) 0.00100 (0.035022) 255827 (1289) 0.99939
16 The Man in the Iron Mask (0.034317)0.386428 (0.125674)0.538527 214834(3043) 0.99048
17 Primary Colors 0.492124 (0.018081) 0.483213 (0.063007) 54030 (333) 0.99891 18 Wild Things (0.075403)0.62589 (0.255709)0.564076 15583(263) 0.99498 19 Lost in Space 0.632994 (0.060669) 0.00100 (0.194095) 145229 (4219) 0.99036 20 Mercury Rising 0.52217 (0.019873) 0.33332 (0.064253) 237389 (1526) 0.99857 21 City of Angels 0.622656 (0.025371) 0.112648 (0.077173) 255035 (2115) 0.99840
22 The Object of My Affection 0.434409 (0.023051) 0.604263 (0.091586) 30885 (327) 0.99765 23 Deep Impact (0.020289)0.477532 (0.062382)0.196247 417280(3215) 0.99704 24 The Horse Whisperer 0.488935
(0.026638) 0.395992 (0.084344) 37012 (260) 0.99655 25 Godzilla (0.012324)0.4581 (0.035635)0.129659 419830(1841) 0.99835
17
Table 3. The Estimation of Diffusion Model for Movies in Taiwan (Continuous)
No Movie Title Innovation Rate, p (std. Error) Imitation Rate, q (std. Error) Potential Market, m (std. Error) 2 R 26 Hope Floats 0.312162 (NA)* 1.516892 (NA)* 24876 (NA)* NA* 27 A Perfect Murder 0.493781 (0.076481) 0.611086 (0.272296) 116656 (2561) 0.98443
28 The Truman Show 0.347586
(0.020662) 0.302889 (0.070582) 192698 (2206) 0.99220 29 Six Days, Seven Nights 0.41786
(0.014367) 0.573669 (0.050194) 218419 (950) 0.99874 30 The X-Files 0.692104 (0.047383) 0.283005 (0.151061) 144764 (1822) 0.99792 31 Mulan 0.281806 (0.021591) 0.301503 (0.075926) 419384 (6259) 0.98305 32 Dr. Dolittle 0.440049 (0.012211) 0.333384 (0.040009) 196359 (932) 0.99891 33 Out of Sight 1.294331 (NA) * 0.00100 (NA)* 44369 (NA)* NA* 34 Armageddon 0.418214 (0.013838) 0.185416 (0.042636) 658282 (4065) 0.99766 35 Small Soldiers 0.453045 (0.094751) 1.242729 (0.39611) 35490 (628) 0.99094 36 Lethal Weapon 4 0.736681 (0.017072) 0.00100 (0.046444) 365716 (1391) 0.99956 37 There's something about Mary 0.288075
(0.021642) 0.448581 (0.078934) 183421 (2206) 0.98830 38 The Mask of Zorro 0.41757
(0.023794) 0.862497 (0.097165) 78646 (641) 0.99820 39 Saving Private Ryan 0.36405
(0.020652) 0.193394 (0.061105) 439235 (3393) 0.98933
40 The Parent Trap 0.375799
(0.019876) 0.587058 (0.074215) 63000 (506) 0.99673 41 The Negotiator 0.349485 (0.022353) 0.550445 (0.081639) 105384 (969) 0.99424 42 Ever after 0.423664 (0.07411) 0.579484 (0.29988) 21921 (825) 0.97174 43 Halloween:H20 0.845448 (0.08692) 0.043909 (0.254355) 49334 (987) 0.99615 44 Snake Eyes 0.818855 (0.032064) 0.181342 (0.089603) 167077 (864) 0.99946 45 Wrongfully Accused 0.722614 (0.04671) 0.281501 (0.148069) 66092 (747) 0.99839 46 Rush Hour 0.413539 (0.017967) 0.437151 (0.05991) 216778 (1293) 0.99733 47 Ronin 0.785343 (0.120142) 0.098262 (0.412675) 79867 (3502) 0.99125 48 Antz 0.733507 (0.051179) 0.00100 (0.135749) 102781 (1092) 0.99539 49 What Dreams May Come 0.621467
(0.02449) 0.00100 (0.076598) 199373 (2122) 0.99814
18 50 Bride of Chucky 1.02761 (0.024423) 0.00100 (0.061653) 148319 (392) 0.99988 51 Practical Magic 0.537359 (0.031369) 0.272002 (0.114831) 78293 (1285) 0.99684
Table 4 The Means and Standard Deviations of Diffusion Coefficients of American Movies in the US Market and Taiwan Market, by Movie Type
Estimates of the US Market Estimates of Taiwan Market
pˆUS (SD) qˆUS (SD) mˆUS (SD) pˆTW (SD) qˆTW (SD) mˆTW (SD) Movie Type Love Stories 0.339193 (0.1494) 0.088378 (0.0931) 14536910 (7405096) 0.419974 (0.1593) 0.590584 (0.521) 121777 (113916) Actions 0.465871 (0.0646) 0.057488 (0.0901) 14956828 (8340636) 0.621598 (0.2991) 0.349780 (0.370) 194182 (120981) Science Fictions 0.610800 (0.1522) 0.02360 (0.0503) 17938719 (10377275) 0.629933 (0.1930) 0.173432 (0.1325) 272553 (201415) Comedies 0.371791 (0.1733) 0.113093 (0.1592) 18707943 (11308476) 0.492286 (0.1774) 0.461946 (0.1864) 134691 (59333) Dramas 0.373581 (0.1845) 0.170026 (0.2260) 14239983 (12161559) 0.455422 (0.1022) 0.505198 (0.1624) 145572 (161121) Animations 0.310511 (0.1614) 0.201870 (0.2260) 16027982 (6186056) 0.479694 (0.1872) 0.524868 (0.529) 154611 (178684) Horrors 0.523225 (0.1613) 0.088800 (0.1030) 12308138 (5722980) 0.779767 (0.207) 0.214003 (0.371) 102218 (40614)
19
Table 5 The Comparison of the Means of Diffusion Coefficients of Other Attributes of American Movies in the US Market and Taiwan Market
Estimates of the US Market Estimates of Taiwan Market pˆUS (SD) qˆUS (SD) mˆUS (SD) pˆTW (SD) qˆTW (SD) mˆTW (SD) Key Actor or Actress Infamous 0.447037 (0.185) 0.099816 (0.143) 14910279 (8132047) 0.576360 (0.188) 0.431645 (0.423) 130781 (128648) Famous 0.411162 (0.160) 0.089391 (0.131) 16225875 (9448575) 0.513598 (0.240) 0.404267 (0.348) 189358 (142040) Tests Ho: µ1≤µ2 µ1≤µ2 µ1≥µ2 µ1≤µ2 µ1≤µ2 µ1≥µ2 T-Value 0.73 0.27 -0.53 1.04 0.24 -1.53 P-Value 0.23 0.39 0.30 0.15 0.40 0.066 Announce-men t Week Non-holidays 0.436306 (0.143) 0.085865 (0.089) 13830598 (7303049) 0.524602 (0.226) 0.402071 (0.349) 134196 (112770) Holidays 0.418721 (0.197) 0.102003 (0.170) 17365230 (9895249) 0.564435 (0.213) 0.438225 (0.428) 217519 (163550) Tests Ho: µ1≤µ2 µ1≥µ2 µ1≥µ2 µ1≥µ2 µ1≥µ2 µ1≥µ2 T-Value 0.37 -0.43 -1.46 -0.63 -0.31 -1.96 P-Value 0.36 0.34 0.076 0.27 0.38 0.030 Play Period Non-Holidays 0.459222 (0.118) 0.090942 (0.0857) 11734272 (6798589) 0.552579 (0.239) 0.388367 (0.341) 129506 (95844) Holidays 0.405024 (0.199) 0.096297 (0.163) 18361374 (9135420) 0.510703 (0.175) 0.474983 (0.452) 243403 (183249) Tests Ho: µ1≤µ2 µ1≥µ2 µ1≥µ2 µ1≤µ2 µ1≥µ2 µ1≥µ2 T-Value 1.22 -0.15 -2.97 0.70 -0.68 -2.34 P-Value 0.11 0.44 0.0023 0.24 0.25 0.015
Table 6 The Estimations of SUR Model Model I Model II TWp TWq TWm TWp TWq TWm Intercept 0.374454 (1.981)* 1.066507 (2.881)*** -23.168 (-2.728)*** 0.11452 (1.157) 0.56679 (5.463)*** -5.42551 (-1.754)* USp 0.426584 (1.439) -0.7276 (-1.272) 25.20311 (1.907)* 0.78021 (4.239)*** USq 0.087032 (0.311) -0.68065 (-1.259) 26.54601 (2.117)** 0.37840 (1.895)* USm -0.00778 (-1.703)* -0.01086 (-1.217) 1.289266 (6.258)*** 0.88520 (6.634)*** Horror (Dummy) 0.256103 (2.315)** -0.27769 (-1.266) 0.780313 (0.156) 0.21660 (1.981)* -0.35278 (-1.721)* 3.29345 (0.675) Science Fiction (Dummy) 0.081799
(0.801) -0.28959 (-1.431) 5.946822 (1.268) 0.00327 (0.037) -0.43695 (-2.912)*** 10.48246 (2.819)*** Action (Dummy) 0.054633 (0.826) -0.04272 (-0.331) 3.841909 (1.291) 0.04030 (0.609) -0.08145 (-0.675) 5.18457 (1.772)* Major Star (Dummy) -0.00462
(-0.022) 0.512799 (1.261) -14.394 (-1.537) -0.00301 (-0.014) 0.46598 (1.185) -12.20840 (-1.284) Rank of Star 0.000607 (0.233) -0.00812 (-1.581) 0.230374 (1.955)* 0.00038 (0.144) -0.00752 (-1.551) 0.20411 (1.722)* Holiday (Dummy) 0.05628 (1.114) 0.143867 (1.429) 4.787529 (1.857)* 0.02728 (0.529) 0.13155 (1.329) 5.83492 (2.248)**
Table 7 The Forecasting of Box-Office Attendance for Motion Pictures in Taiwan Market
Soldier The Siege Meet Joe Black I Still Know What You Did Last Summer
A Bug’s Life
Actual Predicted Actual Predicted Actual Predicted Actual Predicted Actual Predicted Week 1 51106 54691 88963 102370 75491 77607 19584 26308 111927 105660 Week 2 34071 22195 55063 50675 40313 41513 12302 10519 110646 91078 Week 3 5044 8556 24062 21389 17944 18259 5137 3725 73869 51181 Week 4 8117 3232 13905 8414 11070 7334 1351 1261 38230 22123 Week 5 2041 1212 6350 3218 5584 2837 16506 8465 Week 6 409 453 2996 1217 2586 1082 8773 3086 Week 7 458 169 302 458 2710 1105 Week 8 1461 393 Cumulative 101246 90508 191641 187741 152988 148632 38374 41813 364122 283091 Weekly Average 14464 12930 27377 26820 25498 24772 9594 10453 45515 35386
MAD MAPE MAD MAPE MAD MAPE MAD MAPE MAD MAPE
Cumulative 10738 11% 3900 2% 4356 3% 3439 9% 81031 22% Weekly Average 1534 11% 557 2% 726 3% 859 9% 10129 22% Weighted Average 913 4% 1193 2% 299 1% 1049 7% 1835 3%