PLEASE SCROLL DOWN FOR ARTICLE
The Service Industries Journal
Publication details, including instructions for authors and subscription information: http://www.informaworld.com/smpp/title~content=t713636505
A service quality measurement derived from the theory of needs
Hung-Chang Chiu a; Neng-Pai Lin b
a Graduate Institute of Technology & Innovation Management, National Chung Hsing University, Taichung,
Taiwan. b Taiwan Power Company, Taiwan.
Online Publication Date: 01 January 2004
To cite this Article Chiu, Hung-Chang and Lin, Neng-Pai(2004)'A service quality measurement derived from the theory of needs',The Service Industries Journal,24:1,187 — 204
To link to this Article: DOI: 10.1080/02642060412331301202
URL: http://dx.doi.org/10.1080/02642060412331301202
Full terms and conditions of use: http://www.informaworld.com/terms-and-conditions-of-access.pdf
This article may be used for research, teaching and private study purposes. Any substantial or systematic reproduction, re-distribution, re-selling, loan or sub-licensing, systematic supply or distribution in any form to anyone is expressly forbidden.
The publisher does not give any warranty express or implied or make any representation that the contents will be complete or accurate or up to date. The accuracy of any instructions, formulae and drug doses should be independently verified with primary sources. The publisher shall not be liable for any loss, actions, claims, proceedings, demand or costs or damages whatsoever or howsoever caused arising directly or indirectly in connection with or arising out of the use of this material.
A Service Quality Measurement Derived
from the Theory of Needs
HUNG-CHANG CHIU and NENG-PAI LIN
A literature review has indicated that a majority of researchers tend to define quality as meeting customers needs. This study therefore attempts to develop a new service quality instrument called SQ-NEED based on Maslows theory of needs. The results from the empirical analysis suggest that the SQ-NEED not only has a sound theoretical basis, but also possesses a reasonable reliability and validity. Moreover, there is significant evidence to show that SQ-NEED performs better in this study than SERVQUAL for services directed at people and providing intangible actions.
INTRODUCTION
As competition in the service industry grows, delivering high-quality service to meet customers needs becomes an important way to success [Parasuraman, Zeithaml and Berry, 1988]. Past studies have defined quality as value [Feigenbaum, 1951], fitness for use [Juran, Gryna and Bingham, 1974], conformance to requirements [Crosby, 1979], meeting customers expectations [Parasuraman, Zeithaml and Berry, 1985], and the totality of the features and characteristics of a product or service that bear on its ability to satisfy stated or implied needs [ANSI/ASQC, 1987]. However, the above definitions of quality fail to address the characteristics of services and the increased importance of the service sector. The current most pervasive definition of quality is the extent to which a product/service meets a customers expectation [Reeves and Bednar, 1994]. Juran and Gryna [1988] also redefined the definition of quality from fitness for use to meeting customers needs and freedom from deficiencies [Reeves and Bednar,
Hung-Chang Chiu, Assistant Professor, Graduate Institute of Technology & Innovation Management, National Chung Hsing University, Taichung, Taiwan. Neng-Pai Lin, Chairman, Taiwan Power Company, Taiwan.
The Service Industries Journal, Vol.24, No.1 (January 2004), pp.187204
PUBLISHED BY FRANK CASS, LONDON
1994]. The reason for the above definition of quality emphasising customers needs is the idea of only customers judge quality, all other judgments are irrelevant [Zeithaml, Parasuraman and Berry, 1990]. Therefore, a service business must understand what customers really need and then deliver its service accordingly.
Since services are intangible, heterogeneous, inseparable and perishable [Lovelock, 1996], service quality tends to be difficult to measure. Among the past studies on services marketing, service quality scales were developed primarily using empirical data in some service categories and these instruments might not be appropriate to explain some phenomena in consumer behaviour. In the past literature of service quality, the SERVQUAL scale developed by Parasuraman, Zeithaml and Berry [1988, 1994; Parasuranman, Berry and Zeithaml, 1991], which contains five dimensions: Tangibles, Reliability, Responsiveness, Assurance and Empathy, is one of the leading instruments of service quality and has been widely used by both academics and practicing managers [Hussey, 1999; Lin, Chiu and Hsieh, 2001; Mittal and Lassar, 1996]. However, some practices in service businesses are hardly measured by SERVQUAL. For example, this model may not explain cause-related marketing, which is one of the most prevalent forms of corporate giving. A famous example is that American Express offered to donate one cent to the restoration of the Stature of Liberty for each use of its charge card in the early 1980s. At the end of this activity, American Express contributed US$1.7 million, but produced a 28 percent increase in card usage [Armstrong and Kotler, 2000]. American Express linked customers purchases with fund-raising for a charitable organization and resulted in great benefits for both the company and the organisation. Customers were satisfied when they knew the company donated a part of revenues. This implies that customers might perceive higher service quality because of the cause-related marketing practice of the business. However, the previous dimensions of service quality, such as SERVQUAL, may not explain this. As such, the first purpose of this study is to fill the research gap and develop an instrument with a reliable and valid scale from the theory of needs.
Another criticism of SERVQUAL is that it may not be universally applicable across different service industries [Bienstock, Mentzer and Bird, 1997; Carman, 1990]. For example, Carman [1990] has argued that the five dimensions in the SERVQUAL instrument might not be completely generic to all of the service categories. The author recommends that SERVQUAL should be refined before application to other service categories that are quite different from those used in Parasuraman, Zeithaml and Berrys original test. Therefore, SERVQUAL
might be more suitable for some specific service industries. This leads to our second purpose, to compare the relative appropriateness of SERVQUAL and the service quality measurement derived from the theory of needs under different service categories.
THEORETICAL BACKGROUND
Needs
Psychologists have discussed the concept of needs for decades. Need is a hypothetical construct, which stands for a force in the brain region, a force which organises perception, apperception, intellection, conation and action in such a way as to transform in a certain direction of an existing, unsatisfying situation [Murray et al., 1938]. Among the theories of human needs, those of Maslow [1970] and Murray et al. [1938] are the two predominant ones [Cunningham and Wakefield, 1975].
Murray et al. [1938] proposed a scheme of needs that motivate a persons behaviour. Edwards [1959] later developed the Edwards Personal Preference Schedule (EPPS) to measure the 15 manifest needs presented by Murray et al.. These needs are Achievement, Deference, Order, Exhibition, Autonomy, Affiliation, Intraception, Succorance, Dominance, Abasement, Nurturance, Change, Endurance, Heterosexuality and Aggression. On the other hand, Maslow classified human needs into five broad categories. They are physiological needs (e.g., food, sheer activity, health, physical contentment, minimizing effort, etc.); safety needs (e.g., security, stability, freedom from fear, chaos, need for order, protection, etc.); belongingness and love needs (e.g., feelings of giving and receiving love, need for friendship and belongingness, etc.); esteem needs (e.g., feelings of confidence, achievement, prestige, self-esteem, and esteem of others, etc.); self-actualisation needs (e.g., feelings of self-fulfilment, self-realization, growth, maturity, etc.). He later revised the original theory and suggested seven broad types of needs. The first five are the basic hierarchical needs he proposed earlier and the last two are knowledge/understanding needs (e.g., satisfying curiosity, sense of learning and expanding ones knowledge, etc.) and aesthetic needs (e.g., need for order, symmetry, perfection, etc.) [Maslow, 1970, 1987]. Among these seven categories of needs, the first five are basic hierarchical needs and the last two are basic cognitive needs [Maslow, 1987]. Maslow believed that these seven types of human needs could motivate human behaviour.
Later, Alderfer revised Maslows theory of needs and proposed the ERG theory. The ERG theory consists of three groups of needs: existence, relatedness and growth. The existence group, which includes the items of
Maslows physiological and safety needs, is concerned with providing human basic material existence requirements. The relatedness need, which combines Maslows needs of belongingness and the external component of esteem, describes the human desire for interpersonal relations. The growth group, which contains Maslows internal component of esteem and self-actualisation, is an intrinsic desire for personal development [Robbins, 1993]. The primary differences between Alderfers ERG and Maslows theory lie in the hierarchical viewpoints. Maslows need hierarchy is a rigid step-like progression, however, the ERG theory does not assume such a rigid hierarchy where a lower need must be substantially gratified before one can move on toward higher-level needs [Robbins, 1993].
Although many theories about describing the contents of human needs have been developed, Maslows hierarchical theory of needs is still regarded as one of the most comprehensive and widely used need theories [Robbins, 1993]. For example, compared to the theories proposed by Maslow and Murray et al., Maslows classification is simpler and more systematic [Cunningham and Wakefield, 1975]. Moreover, if we neglect the different viewpoints about hierarchical problems between Alderfers ERG and Maslows theory and focus on the categories of needs of the two theories, they provide similar contents in delineating human needs. However, since the contents of needs in Alderfers ERG theory are primarily derived from Maslows theory, this study tended to take Maslows seven categories of needs to represent the dimensions of customers needs and developed the service quality contents in accordance with these needs.
Service Quality and Customers Needs
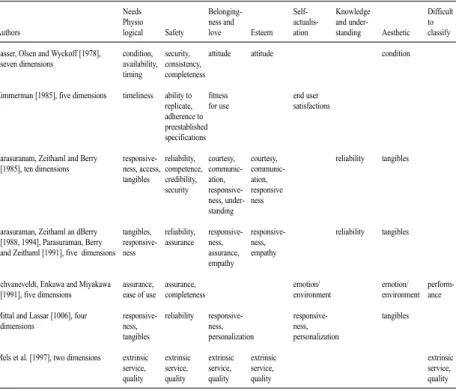
Previous studies have developed a number of dimensions to describe service quality [e.g., Mels, Boshoff and Nel, 1997; Mittal and Lassar 1996; Parasuraman, Zeithaml and Berry, 1985, 1988; Sasser, Olsen and Wyckoff, 1978; Schvaneveldt, Enkawa and Miyakawa, 1991; Zimmerman, 1985]. However, as discussed earlier, the excellent service quality provided by a business means that it meets the customers needs. Therefore, we conducted Table 1 to provide a summary of the past studies on service quality dimensions incorporating the seven categories of customers needs.
According to Table 1, relatively few of these authors proposed service quality dimensions that contained all seven categories of customers needs. Moreover, few researchers have proposed service quality dimensions related to both the knowledge/understanding and self-actualisation needs. Thus, the service quality dimensions and contents suggested by previous researchers might not completely meet customers needs. This study therefore intends to propose a service quality scale from a theoretical approach based on the theory of needs.
Since Maslows theory of needs is one of the most comprehensive theories and most widely used, we derived this service quality instrument in accordance with the needs as defined in Maslows seven categories.
SQ-NEED DEVELOPMENT
Scale Development and Item Generation
Because the definition of service quality is to meet customers needs, our analysis begins from this fundamental criterion. We took Maslows seven categories of needs to represent the dimensions of customers needs and developed the service quality contents in accordance with these needs. Figure 1 indicates how the service quality contents were derived from Maslows seven categories of needs. It represents only a part of the framework. The complete results are shown in Table 2.
TABLE 1
RELATIONSHIP BETWEEN SERVICE QUALITY DIMENSIONS AND CUSTOMERS NEEDS
Needs Belonging- Self- Knowledge Difficult
Physio ness and actualis- and under- to
Authors logical Safetylove Esteem ation standing Aesthetic classify
Sasser, Olsen and Wyckoff [1978], condition, security, attitude attitude condition seven dimensions availability, consistency,
timing completeness
Zimmerman [1985], five dimensions timeliness ability to fitness end user replicate, for use satisfactions adherence to
preestablished specifications
Parasuranam, Zeithaml and Berry responsive- reliability, courtesy, courtesy, reliability tangibles [1985], ten dimensions ness, access, competence, communic- communic-
tangibles credibility, ation, ation, securityresponsive- responsive
ness, under- ness standing
Parasuraman, Zeithaml an dBerry tangibles, reliability, responsive- responsive- reliability tangibles [1988, 1994], Parasuraman, Berry responsive- assurance ness, ness,
and Zeithaml [1991], five dimensions ness assurance, empathy empathy
Schvaneveldt, Enkawa and Miyakawa assurance, assurance, emotion/ emotion/ perform-[1991], five dimensions ease of use completeness environment environment ance Mittal and Lassar [1006], four responsive- reliabilityresponsive- responsive- tangibles
dimensions ness, ness, ness,
tangibles personalization personalization
Mels et al. [1997], two dimensions extrinsic extrinsic extrinsic extrinsic extrinsic
service, service, service, service, service,
qualityqualityqualityquality quality
In order to ensure the objectivity of the research process for the service quality contents in Figure 1, we have adopted the nominal group technique (NGT) developed by Delbecq and Van de Ven. This technique has two potential advantages. First, NGT involves different group processes for the phases of independent idea generation and structured feedback. Second, NGT ensures that each group members ideas are a part of the groups frame of reference [Delbecq, Van de Ven and Gustafson, 1975].
The nominal group in this study consisted of six members whose specialization lay in the fields of Marketing, Operations Management and Organizational Behaviour. First, all group members were asked to write down independently, before the meeting, the service quality contents in accordance with Maslows seven categories of needs. Second, at the beginning of the meeting, every member presented his or her service quality classification and explained the relationships between the proposed service quality contents and Maslows seven categories of needs. During this presentation process, discussion and criticism by others were not allowed. These first two processes were designed not only to free the individual from the inhibiting effect of criticism by others during creative problem solving, but also to ensure that every group member had the same opportunity to
Customers’ dimensions service quality contents needs of need derived from needs
physiology comfort
safety convenience belongingness and love responsiveness customers’
needs esteem
self-actualization innovation knowledge and understanding
aesthetics learning
FIGURE 1
A PART OF THE SERVICE QUALITY CLASSIFICATION MODEL BASED ON THE THEORY OF NEEDS
present ideas about this problem. Third, after the presentation process ended, group members started to discuss and evaluate the service quality contents suggested by all group members. All members were then asked to select the service quality contents that were appropriate for Maslows seven categories of needs. The results of the seven need categories and their related service quality contents are shown in Table 2.
After filling the service quality contents in Table 2, we then developed an instrument in accordance with these service quality dimensions and contents. Our initial service quality instrument was a 37-item scale. These items were generated from the service quality contents in Table 2. Each service quality content consisted of one or two items. The physiological, safety, belongingness/love, esteem, self-actualization, knowledge/ understanding and aesthetic dimensions contained six, six, six, six, five four and four items, respectively. The response format for these items was a seven-point scale ranging from 1 (strongly disagree) to 7 (strongly agree).
A perceptions-only (P) score rather than a gap score of perception-minus-expectation (PE) was adopted to conceptualise service quality. The reason for using the P score rather than the PE score was that some researchers suggested that the perceptions-only scale is the best measure when maximizing predictive power is the major objective, whereas the gap scale is useful for practical diagnostic usage [Parasuraman, Zeithaml and Berry, 1994].
Scale Pretests and Adjustments
The instruments were refined through a pretesting stage. Respondents in this stage were spread across four different service categories: education, banking, passenger transportation and laundry. These four categories were selected to represent a broad cross-section of services proposed by Lovelock [1983]. In addition, Carman [1990] recommended minor modifications in
TABLE 2
MASLOWS SEVEN NEED CATEGORIES AND THEIR RELATED SERVICE QUALITY CONTENTS
Categories of needs Contents of service quality
Physiological needs Comfort, convenience, responsiveness Safety needs Assurance, reliability, consistency, Secrecy Belongingness and love needs Relation, approval, empathy
Esteem needs Self-esteem, superiority, politeness, Acceptance Self-actualization needs Growth, show, care of the social fairs Knowledge and understanding needs Innovation, learning
Aesthetic needs Appreciation of nature, arts, and Literature
the wording of the items in different service categories. We therefore made several minor adjustments in the wording in different kinds of service categories. For instance, we changed the service counters and auto teller machines resources in the banking service (the third item in Table 3) category into teaching and exercising facilities in the education category. All respondents were asked to select an organisation that has served them for a period of time and circle their perceptions of the service quality.
Data for this pretesting stage were gathered from a sample of 97 respondents across the above four service categories. Based on these questionnaires, the sample of respondents was composed of slightly more women (52.6 per cent) than men (47.4 per cent) and the four service categories had the following sample sizes: 23 in education, 28 in banking, 25 in passenger transportation and 21 in laundry. Nunally [1967] and Churchill [1979] recommend that the first step in the analysis for measurement development should be to examine the item-to-total correlations to identify items that may exhibit measurement errors or not share the core of the construct. Factor analysis should be performed only after purifying the measure by deleting those low-correlation items [Gupta and Somers, 1992]. As they suggested, an item-to-total correlation analysis was applied to drop certain items from the four dimensions with six items. For each dimension with six items, we deleted one item that had the lowest correlation between the score on that item and the sum of scores on all the other items corresponding to the dimension. After these procedures were performed in the pilot test stage, we deleted four items. This resulted in a set of 33 items with alpha values ranging from 0.79 to 0.90 across the seven dimensions (see Table 3). The battery in Table 3 we have called SQ-NEED, which indicated the battery is a service quality classification based on the theory of needs.
Data Collection
To further examine whether SQ-NEED possesses good reliability and validity, we conducted a field study. Data for this survey were gathered from the four service categories of education, banking, passenger transportation and laundry. After eliminating those few respondents who were unable to complete their questionnaires, a total of 819 were received. Based on these questionnaires, the four service categories had the following sample sizes: 199 in education, 226 in banking, 200 in passenger transportation, and 194 in laundry. The respondents to this field survey were asked to select one service organization (school, bank, public transportation, laundry) that has served them for a period of time and then circle their perceptions of the service quality delivered by that organization. The respondents rated different service organizations ranging from poor to excellent on service
TABLE 3
THE SQ-NEED BATTERY FOR BANKING
Physiological needs
1. The environment of ______ makes me feel comfortable. 2. ______s service makes me feel convenient.
3. ______s resources (service counters, auto teller machines,...etc.) are sufficient. 4. Employees of ______ give me prompt service and make me not wait too long. 5. ______ responds my requests quickly.
Safety needs
6. Employees expertise is able to solve customers problems. 7. Employees capabilities and behaviors are dependable. 8. ______ provides service (contracts,... etc.) as promised.
9. ______always keeps its promise to deal with customers problems. 10. ______ stresses customers personal privacy.
Belongingness/love needs
11. Employees always treat me as their friend.
12. ______ can establish long-term relationships with customers.
13. Employees always use customers ways (local language,... etc.) to communicate. 14. Employees can give customers individual attention.
15. Employees understand the needs of their customers. Esteem needs
16. I have the feelings of self-esteem after ______ s service (praises,... etc.). 17. After receiving ______s service, I am confident of choosing this company. 18. I receive VIP treatment in ______.
19. Employees are polite and courteous.
20. ______ always keeps customers suggestions in mind. Self-actualization needs
21. I have a feeling of growth after ______s service. 22. I appreciate ______s service very much.
23. ______ often participate the activities about the social fairs. 24. ______ employ some handicapped person to serve.
25. ______ emphasizes the problems of environmental protection. Knowledge/understanding needs
26. ______ often provides new service contents.
27. ______ often provides new domestic/international financial information. 28. I can learn from ______s service contents (investment, ... etc.).
29. Employees let me know the related information and knowledge of service contents. Aesthetic needs
30. ______s facilities possess a sense of beauty of the arts.
31. Materials (brochures,...etc.) associated with ______ possess a sense of beauty. 32. Surroundings of ______ possess a sense of beauty of nature.
33. Employees are elegant and refined in speech.
Note: Minor adjustments in the wording of the items are needed in different service categories.
quality. The assumption of this method was that the differences among service industries are randomly distributed [Mittal and Lassar, 1996].
In order to examine the construct validity of the SQ-NEED, the perception of overall service quality or OSQ [Parasuraman, Berry and Zeithaml, 1991; Parasuraman, Zeithaml and Berry, 1994] was introduced as a predictor of the SQ-NEED scale. To assess the discriminant validity, the construct of human value (which is quite different from the construct of service quality) was introduced. The item the degree to which your goals can be aggressively achieved was used to measure customer value. Three predictors were used to determine criterion-related validity. These were overall satisfaction [Teas, 1993; Mittal and Lassar, 1996], intention to recommend [Dabholkar, Thorpe and Rentz, 1996] and intention to stay [Mittal and Lassar, 1996]. Items of the above predictors were also measured on a seven-point Likert scale ranging from very low to very high.
Reliability
Since reliability is a necessary but not sufficient condition for validity, we assessed SQ-NEEDs reliability prior to validity. Table 4 shows the reliability scores (measured by coefficient alphas) for all seven dimensions on each of the four samples. As indicated in Table 4, the coefficient alpha values were consistently high across all dimensions for all four samples. This indicates a high internal consistency among items in each SQ-NEED dimension under different samples.
Validity
In this study we discussed three basic kinds of validity. These are content validity, construct validity and criterion-related validity [American
TABLE 4
RELIABILITY ANALYSIS OF THE SQ-NEED DIMENSIONS
Coefficient alpha values
Education Banking Passenger LaundryAll transport- four ation samples Physiology (X1X5) 0.88 0.87 0.85 0.81 0.85 Safety (X6X10) 0.86 0.90 0.89 0.85 0.89 Belongingness/love (X11X15) 0.89 0.92 0.90 0.87 0.91 Esteem (X16X20) 0.85 0.92 0.93 0.91 0.91 Self-actualization (X21X25) 0.84 0.87 0.93 0.86 0.88 Knowledge (X26X29) 0.90 0.92 0.93 0.89 0.92 Aesthetics (X30X33) 0.87 0.90 0.93 0.91 0.91
Psychological Association, 1974]. Evaluating the content validity of an instrument depends mainly on subjective and qualitative judgments by a number of specialists. As discussed earlier, since the SQ-NEED instrument was based on Maslows theory of needs and developed from the nominal group technique, the scale can be considered to possess content validity.
As to construct validity, in order to examine whether the theoretical model of seven dimensions fit into the empirical data, we conducted a confirmatory factor analysis using the unweighted-least-squares procedure of the LISREL VIII [Joreskog and Sorbom, 1993]. The reason for using the unweighted-least-squares estimation rather than the maximum-likelihood estimation was that the latter is based on the assumption of a multi-normal distribution, an assumption not required by the former and not met in the present study [Parasuraman, Zeithaml snd Berry, 1994: 228]. Table 5 shows the results of some important indicators such as the square statistic, chi-square/degree of freedom index, goodness-of-fit index (GFI), adjusted goodness-of-fit index (AGFI), comparative fit index (CFI), root mean square residual (RMR) and root-mean-square error of approximation (RMSEA).
In Table 5, all of the indices lie in their acceptable ranges except the chi-square statistic. The chi-chi-square statistic of the model was significant at p<0.01, indicating a poor fit between the theoretical and measurement models for the seven-factor structure. However, only for the true model, the chi-square statistic has an expected value equal to the degree of freedom and does not vary with sample size [Marsh, Balla and McDonald, 1988]. When the sample size is large, nearly all models are rejected for the chi-square test even though these models are trivially false [Marsh, Balla and McDonald, 1988; Segars and Grover, 1993; Parasuraman, Zeithaml and Berry, 1994; Doney and Cannon, 1997]. This means that the chi-square statistic is less meaningful when the sample size is large. Because of the influence of the sample size on the chi-square statistic, researchers have suggested other
TABLE 5
CONFIRMATORY FACTOR ANALYSIS FOR SQ-NEED
Fit indexes Suggested critical values Values of this studyPass or not χ2 Prob. ≥ 0.05 [Bagozzi and Yi, 1988] 1228.2 (prob. ≤ 0.01) no
χ2/d.f. ≤ 3.00 [Segars and Grover, 1993] 2.6 (1228.2 / 474) yes
GFI ≥ 0.90 [Bagozzi and Yi, 1988] 0.99 yes AGFI ≥ 0.90 [Bagozzi and Yi, 1988] 0.99 yes CFI Close to 1.00 [Bentler, 1990] 0.99 yes RMR ≤ 0.05 [Kettinger and Lee, 1994] 0.05 yes RMSEA ≤ 0.05 [Schumacker and Lomax, 1994] 0.04 yes
indicators such as chi-square/degree of freedom index, GFI, AGFI, CFI, RMR and RMSEA to be used. As shown in Table 5, these six indexes provide evidence of adequate model fit. SQ-NEED, therefore, possesses reasonable construct validity.
Another way to check the construct validity is to test the congruence between the SQ-NEED scores and the OSQ scores. We regressed the OSQ scores on the SQ-NEED scores along the seven dimensions for each service category. The adjusted R2values for the four samples of education, banking,
passenger transportation and laundry were 0.6956, 0.6972, 0.6965 and 0.5581, respectively, and for the pooled sample, 0.6854, all significant at p<0.01. Since the adjusted R2 values are generally high across different
samples, we thus conclude that SQ-NEED also possesses construct validity. To further examine the construct validity of SQ-NEED, the construct of human value was introduced to test the discriminant validity. We regressed the value scores on the SQ-NEED scores along the seven dimensions for each service category. The adjusted R2values for each sample were 0.0237,
0.0084, 0.0096 and 0.0205, and for the pooled data, 0.0231, all insignificant at p<0.01. Therefore, the seven dimensions of the SQ-NEED instrument explained little variance of the construct of value, supporting the SQ-NEEDs discriminant validity.
Finally, to assess the criterion-related validity of SQ-NEED, the criterion predictor of SQ-NEED was measured by the summation of the three variables of overall satisfaction, intention to recommend and intention to stay. The reason for taking the summated-score predictor as the global preference for a customer was that these three variables were highly correlated (the correlation coefficients between any of the two criterion variables were ranging from 0.77 to 0.82, and the coefficient alpha value was 0.87). We then conducted the regression analyses to examine the predictive power of the seven service quality dimensions as a predictor of the global preference. The adjusted R2values were 0.7197,
0.7735, 0.7285, 0.6359 for the samples of education, banking, passenger transportation, laundry, and 0.7209 for the pooled sample of 819 respondents, all significant at p<0.01. Since the adjusted R2 values are
generally high across different samples, we thus conclude SQ-NEED possesses criterion-related validity.
SERVQUAL VS SQ-NEED
Marketing researchers have developed various schemes to classify services into different categories. The value of this classification scheme is that it not only helps managers to obtain a better understanding of consumer behaviour, but also provides insights into the management of service
systems [Lovelock, 1996]. Although the SERVQUAL scale developed by Parasuraman, Zeithaml and Berry [1988, 1994; Parasuraman, Berry and Zeithaml, 1991] is one of the leading instruments, however, one criticism is that it may not be universally applicable across different service industries [Bienstock, Mentzer and Bird, 1997; Carmen, 1990]. Therefore, it is worthwhile to examine the performance of SQ-NEED compared to SERVQUAL under various service categories.
The SERVQUAL instrument used in this study was the latest 21-item version (Parasuraman, Zeithaml and Berry, 1994). The performance here was measured by the customers overall preference, as stated earlier, which is the summation of the three variables of overall satisfaction, intention to recommend and intention to stay. We then conducted regression analyses to examine the predictive power of SERVQUAL and SQ-NEED across 826 respondents from 16 service categories (see Table 6). The sample size for each category ranged from 40 to 60 respondents. The reason for choosing these sixteen service categories was that these categories represent a broad cross-section of the services proposed by Lovelock [1983]. All respondents were asked to select a particular organization in one of these 16 service categories that has served them for a period of time. The results of the predictive powers of both SERVQUAL and SQ-NEED in 16 service categories are shown in Table 6.
TABLE 6
THE PREDICTIVE POWERS OF SQ-NEED AND SERVQUAL ACROSS VARIOUS SERVICE CATEGORIES
People (n=434) Things (n=392)
SQ-NEED SERV- SQ-
SERV-QUAL NEED QUAL
Tangibles (n=419)
Health care (n=56) 67.96 63.72 Freight transportation 66.92 66.54 (n=47)
Passenger transportation 79.39 65.47 Repair and main- 64.95 77.49
(n=57) tenance (n=47)
Beauty salons (n=56) 72.41 66.42 Janitorial services 69.78 68.57 (n=44)
Restaurants (n=53) 63.70 48.78 Laundry (n=59) 59.92 60.55 Intangibles (n=407)
Education (n=57) 81.34 57.28 Banking (n=61) 66.56 68.97 Information services (n=50) 68.82 57.96 Legal services (n=41) 72.23 67.08 Concerts (n=52) 67.30 42.59 Accounting (n=45) 65.93 58.52 Museums (n=53) 67.88 60.94 Insurance (n=50) 50.24 49.20
To test the differences between the predictive powers of SERVQUAL and SQ-NEED, we introduced the sign-test method used in nonparametric statistics. In Table 6, for those eight services directed at people (the left side including health care, passenger transportation, beauty salons, restaurants, education, information services, concerts and museums), the adjusted R2 values for SQ-NEED are all higher than those for
SERVQUAL. This indicates the probability that SQ-NEED performs equally or less than SERVQUAL under these eight categories is (1/2)8=0.0039, which is rejected under p≤0.05. We therefore conclude that
there is significant evidence to show that SQ-NEED explains additional variance in customer overall preference than SERVQUAL for the services directed at people in this study. However, for the other eight services directed at things (the right side including freight transportation, repair/ maintenance, accounting and insurance in Table 6), only five of the adjusted R2 values of SQ-NEED are higher than those of SERVQUAL.
This indicates the probability that SQ-NEED performs equally or less than SERVQUAL under these eight categories (1+8+28+56)(1/2)8=0.3627,
which is not rejected under p≤0.05. Therefore, there is no significant evidence to show that SQ-NEED performs better than SERVQUAL for the services directed at things in this study.
Moreover, for those eight services that provide tangible actions (the upper part including health care, freight transportation, passenger transportation, repair/ maintenance, beauty salons, janitorial services, restaurants and laundry in Table 6), six of the adjusted R2values for
NEED are higher than those for SERVQUAL. The probability that SQ-NEED performs equally or less than SERVQUAL under these eight categories is (1+8+28)(1/2)8=0.1443, which is not rejected under p≤0.05.
However, for the other eight services that provide intangible actions (the lower part including education, banking, , museums and insurance), seven of the adjusted R2 values for SQ-NEED are higher than those for
SERVQUAL. The probability that SQ-NEED performs equally or less than SERVQUAL under these eight categories is (1+8)(1/2)8=0.0351, which is
rejected under p≤0.05. Therefore, there is significant evidence to show that SQ-NEED performs better than SERVQUAL for services that provide intangible actions in this study.
DISCUSSION
This study derives the service quality content from a definition of service quality and therefore, proposes a service quality measurement from a theory of needs. The approach of this study is based on Maslows theory of needs, which has been widely regarded as one of the most systematic
theories. After conducting the nominal group technique and a field survey, the seven dimensions of SQ-NEED, which includes the dimensions of physiology, safety, belongingness/love, esteem, self-actualization, knowledge/understanding and aesthetics, has been developed in accordance with the definition of service quality. Results also suggest that NEED possesses reasonable reliability and validity. Therefore, SQ-NEED is a need-driven multiple-item scale that marketers can use to improve service quality.
Many studies have explored the contents of service quality over the past years. Among them, the SERVQUAL scale developed by Parasuraman, Zeithaml and Berry [1994] has been regarded as one of the leading instruments. However, some practices in service businesses are not resolved by SERVQUAL. For example, the SERVQUAL model may not explain cause-related marketing, which is one of the most prevalent forms of corporate giving. A customer might spend more when he or she knows the company donates a part of revenues. Similarly, knowing retailers hire some handicapped persons to serve might help customers feel satisfied. Therefore, customers might perceive higher service quality because a business satisfied their self-actualisation needs. From Maslows theory of needs, self-actualisation needs are satisfied when helping others. This suggests SQ-NEED may also be a more appropriate model from this point of view.
Other criticism about SERVQUAL is that it may not be universally applicable across different service industries. This might be caused by the sample industries that they selected to develop the scale. In developing the SERVQUAL scale, Parasuraman, Zeithaml and Berry [1988] selected their respondents from the customers of retail banking, credit card services, appliance repair/maintenance services and a long-distance telephone company. According to the classification proposed by Lovelock [1983], the majority of these services are directed at things and provide tangible actions. Therefore, this study attempted to examine the appropriateness of SERVQUAL and SQ-NEED, which were developed from different approaches, under a classification scheme of services proposed by Lovelock [1983]. Our results suggested that there is significant evidence to show that SQ-NEED performs better than SERVQUAL for those services directed at people and providing intangible actions. We thus conclude that SQ-NEED might be more appropriate under these specific service categories (e.g., education, information services, concerts and museums). The reason might be due to SQ-NEED using more items than SERVQUAL to delineate higher levels of human needs (such as self-actualisation needs, knowledge/ understanding needs and aesthetic needs). Compared to customers of the services directing at things and providing tangible actions, meeting
level needs might be more influential to future behaviours for those customers of businesses providing services directed at people and providing intangible actions. This leads to SQ-NEED, which was developed from Maslows theory of needs and uses more items to delineate higher levels of human needs, performing better under these specific service categories.
Future research can take the following directions. First, e-commerce, or shopping electronically via the Internet, is revolutionising the way that companies do business. Because e-tailers cannot offer face-to-face contact services like physical retailers, e-tailers often provide customer services by personalizing sites, creating opportunities for customisation and providing other added value [Walsh and Godfrey, 2000]. Therefore, future research can be undertaken to revise the SQ-NEED instrument obtained in this study under a physical environment rather than a virtual business environment. Second, future research can link the relationship between the dimensions of SQ-NEED and customer future intentions. It is also necessary to explore the relative importance of these seven dimensions across various service categories and how this relative importance influences a customers future intentions.
Other future research could be undertaken to explore customer perception of service quality and the bonding strategies provided by a business in relationship marketing. Relationship marketing focuses on approaches to build, develop and maintain successful relational exchanges [Morgan and Hunt, 1994]. Based on the existing literature, businesses can build customer relationships by initiating one or several types of bonds. The first is the financial bond, which suggests businesses can enhance customer relationships by delivering financial benefits such as special prices, higher interest rates, and frequent flyer programs [Berry, 1995]. The second is the social bond, which suggests businesses keep customers staying within service firms through friendship [Berry, 1995; Williams, Han and Qualls, 1998]. The third is the structural bond, which suggests businesses provide services that are valuable to customers and not readily available from other sources [Berry, 1995; Williams, Han and Qualls, 1998]. Therefore, it is worthwhile to explore the impacts of these relational bonds on customers perceptions of service quality.
REFERENCES
American Psychological Association, 1974, Standards for Educational and Psychological Tests, Washington, DC: American Psychological Association, pp.2548.
ANSI/ASQC, 1987, Quality Systems Terminology, American National Standards A3-1987, Washington, DC: ANSI/ASQC.
Armstrong, G. and P. Kotler, 2000, Marketing: An Introduction, 5th ed., Upper Saddle River, NJ: Prentice Hall.
Bagozzi, R.P. and Y. Yi, 1988, On the Evaluation of Structural Equation Models, Journal of the Academy of Marketing Science, Vol.16, No.1, pp.7494.
Bentler, P.M., 1990, Comparative Fit Indexes in Structural Models, Psychological Bulletin, Vol.107, No.2, pp.23846.
Berry, L.L., 1995, Relationship Marketing of Services: Growing Interest, Emerging Perspectives, Journal of the Academy of Marketing Science, Vol.23, No.4, pp.23645. Bienstock, C.C., J.T. Mentzer and M.M. Bird, 1997, Measuring Physical Distribution Service
Quality, Journal of the Academy of Marketing Science, Vol.25, No.1, pp.3144. Carman, J.M., 1990, Consumer Perceptions of Service Quality: An Assessment of the
SERVQUAL Dimensions, Journal of Retailing, Vol.66, Spring, pp.3355.
Churchill, G.A., Jr, 1979, A Paradigm for Developing Better Measures of Marketing Constructs, Journal of Marketing Research, Vol.16, No.1, pp.6473.
Crosby, P.B., 1979, Quality is Free: The Art of Making Quality Certain, New York: New American Library.
Cunningham, C.H. and J.A. Wakefield, Jr, 1975, An Empirical Comparison of Maslows and Murrays Systems, Journal of Personality Assessment, Vol.39, No.6, pp.5946.
Dabholkar, P.A., D.I. Thorpe and J.O. Rentz, 1996, A Measure of Service Quality for Retail Stores: Scale Development and Validation, Journal of the Academy of Marketing Science, Vol.24, No.1, pp.316.
Delbecq, A.L., A.H. Van de Ven and D.H. Gustafson, 1975, Group Techniques for Program Planning: A Guide To Nominal Group and Delphi Processes, Glenview, IL: Scott, Foresman and Company.
Doney, P.M. and J.P. Cannon, 1997, An Examination of the Nature of Trust in Buyer-Seller Relationships, Journal of Marketing, Vol.61, April, pp.3551.
Edwards, A.L., 1959, Manual: Edwards Personal Preference Schedule, New York: Psychological Corporation.
Feigenbaum, A.V., 1951, Quality Control: Principles, Practice, and Administration, New York: McGraw-Hill.
Gupta, Y.P. and T.M. Somers, 1992, The Measurement of Manufacturing Flexibility, European Journal of Operational Research, Vol.60, pp.16682.
Hussey, M.K., 1999, Using the Concept of Loss: An Alternative SERVQUAL Measure, The Service Industries Journal, Vol.19, No.4, pp.89101.
Joreskog, K.G. and D. Sorbom, 1993, LISREL 8: Users Reference Guide, Chicago, IL: Scientific Software.
Juran, J.M. and F. Gryna, Jr, 1988, Jurans Quality Control Handbook, 4th ed., New York: McGraw-Hill.
Juran, J.M., F. Gryna, Jr and R.S. Bingham, 1974, Quality Control Handbook, New York: McGraw- Hill.
Kettinger, W.J. and C.C. Lee, 1994, Perceived Service Quality and User Satisfaction with the Information Services Function, Decision Sciences, Vol.25, No.5, pp.73766.
Lin, N.P., H.C. Chiu and Y.C. Hsieh, 2001, Investigating the Relationship Between Service Providers Personality and Customers Perceptions of Service Quality Across Gender, Total Quality Management, Vol.12, No.1, pp.5767.
Lovelock, C.H., 1983, Classifying Services to Gain Strategic Marketing Insights, Journal of Marketing, Vol.47, Summer, pp.920.
Lovelock, C. H., 1996, Services Marketing, 3rd ed., Upper Saddle River, NJ: Prentice Hall. Marsh, H.W., J.R. Balla and R.P. McDonald, 1988, Goodness-of-fit Indexes in Confirmatory
Factor Analysis: The Effect of Sample Size, Psychological Bulletin, Vol.103, No.3, pp.391410.
Maslow, A.H., 1970, Motivation and Personality, 2nd ed., New York: Harper and Row. Maslow, A.H., 1987, Motivation and Personality, 3rd ed., New York: Harper Collins.
McDougall, G.H.G. and T.J. Levesque, 1994, A Revised View of Service Quality Dimensions: An Empirical Investigation, Journal of Professional Services Marketing, Vol.11, No.1, pp.189209.
Mels, G., C. Boshoff and D. Nel, 1997, The Dimensions of Service Quality The Original European Perspective Revisited, Service Industries Journal, Vol.17, No.1, pp.17389.
Mittal, B. and W.M. Lassar, 1996, The Role of Personalization in Service Encounters, Journal of Retailing, Vol.72, Spring, pp.95109.
Morgan, R.M. and S.D. Hunt, 1994, The Commitment-trust Theory of Relationship Marketing, Journal of Marketing, Vol.58, July, pp.2038.
Murray, H.A. et al., 1938, Explorations in Personality: A Clinical and Experimental Study of Fifth Men of College Age, New York: Oxford Press.
Nunnally, J.C., 1967, Psychometric Theory, New York: McGraw-Hill.
Parasuraman, A., V.A. Zeithaml and L.L. Berry, 1985, A Conceptual Model of Service Quality and Its Implications for Future Research, Journal of Marketing, Vol.49, Fall, pp.4150. Parasuraman, A., V.A. Zeithaml and L.L. Berry, 1988, SERVQUAL: A Multiple-Item Scale for
Measuring Consumer Perceptions of Service Quality, Journal of Retailing, Vol.64, Spring, pp.1240.
Parasuraman, A., L.L. Berry and V.A. Zeithaml, 1991, Refinement and Reassessment of the SERVQUAL Scale, Journal of Retailing, Vol.67, Winter, pp.42050.
Parasuraman A., V.A. Zeithaml and L.L. Berry, 1994, Alternative Scales for Measuring Service Quality: A Comparative Assessment Based on Psychometric and Diagnostic Criteria, Journal of Retailing, Vol.70, Autumn, pp.20130.
Reeves, C.A. and D.A. Bednar, 1994, Defining Quality: Alternatives and Implications, Academy of Management Review, Vol.19, No.3, pp.41945.
Robbins, S.P., 1993, Organizational Behavior, Upper Saddle River, NJ: Prentice Hall. Sasser, W.E., R.P. Olsen, Jr and D.D. Wyckoff, 1978, Management of Service Operations: Text,
Cases and Readings, Boston, MA: Allyn and Bacon.
Schumacker, R.E. and R.G. Lomax, 1994, A Beginners Guide To Structural Equation Modeling, Mahway, NJ: Lawrence Erlbaum Associates.
Schvaneveldt, S.J., T. Enkawa and M. Miyakawa, 1991, Consumer Evaluation Perspectives of Service Quality: Evaluation Factors and Two-way Model of Quality, Total Quality Management, Vol.2, No.2, pp.14961.
Segars, A. and V. Grover, 1993, Re-examining Perceived Ease of Use and Usefulness: A Confirmatory Factor Analysis, MIS Quarterly, Vol.17, No.4, pp.51727.
Teas, R.K., 1993, Expectations, Performance Evaluation and Customers Perceptions of Quality, Journal of Marketing, Vol.57, October, pp.1834.
Walsh, J. and S. Godfrey, 2000, The Internet: A New Era in Customer Service, European Management Journal, Vol.18, No.1, pp.8592.
Williams, J.D., S.L. Han and W.J. Qualls, 1998, A Conceptual Model and Study of Cross-cultural Business Relationships, Journal of Business Research, Vol.42, pp.13543. Zimmerman, C.D., 1985, Quality: Key to Service Productivity, Quality Progress, June,
pp.325.
Zeithaml, V.A., Parasuraman, A. and L.L. Berry, 1990, Delivering Quality Service, New York: Free Press.