行政院國家科學委員會專題研究計畫 成果報告
微囊藻毒與蛋白質磷酸酵素間之共價鍵形成的動力學分析
計畫類別: 個別型計畫 計畫編號: NSC92-2311-B-002-103- 執行期間: 92 年 08 月 01 日至 93 年 07 月 31 日 執行單位: 國立臺灣大學漁業科學研究所 計畫主持人: 周宏農 計畫參與人員: 陳逸民、林建智 報告類型: 精簡報告 處理方式: 本計畫可公開查詢微囊藻毒與蛋白質磷酸酵素間之共價鍵形成的動力學分析
摘要
在稍早的研究中,已知微囊藻毒與蛋白質磷酸酵素 PP-1/PP-2A 間會形成共價鍵,導致 兩者永久性的結合,然在其共價鍵結形成動力學方面的研究結果,卻因分析方法及使用毒 素種類的差異而有顯著的不同。在本研究中,嘗試開發基質輔助脫附-飛行時間質譜儀的方 法,用以偵測蛋白質磷酸酵素在與微囊藻毒形成共價鍵結時,所出現分子量加成的訊號, 以此分析 PP-1 與 MCYST-LR 共價鍵形成之動力學。研究結果顯示,共價鍵結是以十分緩 慢的方式形成,每小時形成共價產物的 PP-1 百分比低於 5 %。此與 Craig et al (1996) 的觀 察結果近似,同時支持其用以解釋微囊藻毒與 PP-1 作用之“two-step mechanism” 假說,亦 即毒素先以非共價鍵力量,快速與 PP-1 結合、抑制後,再逐漸形成共價鍵結的說法;共價 鍵結與酵素失活並無直接的關連存在。ABSTRACT
Formation of microcystin-phosphatase adducts formation is a clear indication of microcystin attach on phosphatases. However, the kinetics of microcystin-phosphatase adduct formation has been controversial due to the uses of different microcystin isoforms and measuring methodologies. Here, we used matrix-assisted laser desorption/ionization time-of-flight mass spectrometry (MALDI-TOF MS) to measure the changes in relative intensities of molecular weight signals upon mixing of phosphatase and microcystin, which allowed us to monitor the kinetics of covalent adduct formation. Our data clearly indicated that the shifts of signals upon adduct formation and a slow and steady covalent interaction between MCYST-LR and PP-1c were observed. These observations are in agreement with the results of Craig et al (1996) and support their “two-step mechanism” proposed to elucidate the interaction between PP-1c and microcystins.
一、前言
目前已知會對 PP-1/PP-2A 具有專一抑制活性的天然毒素,除了微囊藻毒之外,尚包括 同樣來自藍綠藻的節球藻毒 (nodularin) (Bagu et al., 1997)、渦鞭毛藻的黑海綿酸 (okadaic acid, OA) (Bialojan et al., 1988; Haystead et al., 1989) 、鰭藻毒 (dinophysis toxin, DTX) (Quilliam and Wright, 1995) 、紅藻的 thyrsiferyl-23-acetate (Matsuzawa et al., 1994) 、放線菌 的 tautomycin (Mackintosh and Klumpp, 1990) 、calyculin (Volter et al., 2001; Wakimoto et al., 2002) 、fostriecin (Walsh et al., 1997) ,以及昆蟲的斑螫素 (cantharidin) (Li and Casida, 1992; Sodeoka et al., 1997; Knapp et al., 1998, McCluskey et al., 2000) ,微囊藻毒是其中唯一會和 phosphatase 形成共價鍵結的毒素 (Bagu et al., 1997)。共價鍵形成的機制,推測為 phosphatase 的 cysteine 所含親核性 (nucleophilic) 的硫基,以 Michael addition 的方式,和微囊藻毒 Mdha 端烯基的碳原子發生反應 (Goldberg et al., 1995; Runnegar et al., 1995)。微囊藻毒與 PP-1c & PP-2Ac 間共價鍵的形成,除可能造成毒素蓄積時間的延長外,還可能造成毒素蓄積量的低 估 (Williams et al., 1997),或是解毒劑於療效上之低落 (Elhanany et al. , 2001),因此有必要 針對微囊藻毒與蛋白質磷酸酵素共價鍵結之動力學進行研究。
共價鍵形成的速率目前還有爭議,Craig et al. (1996) 利用高效液相層析法,分析 in vitro 條件下共價鍵形成的時程,結果發現在反應數小時後,共價產物的含量,以非常緩慢的速 度持續的增加。作者因此將微囊藻毒和 PP-1c 的作用稱為”two-step mechanism”,意指毒素 先以非共價鍵的方式,快速和酵素接合,抑制其活性後,再逐漸產生共價鍵結;共價鍵的 形成與活性抑制之間並無直接的關連。Liu et al. (2000) 以類似 Runnegar et al. (1995) 的免 疫法,分別測試 in vivo 與 in vitro 條件下共價鍵形成的速率,結果發現在 in vitro 條件反應 30 秒後,即有明顯共價產物的出現,而於混合 10 分鐘後,共價鍵的形成即達到飽和。由 此作者認為,共價鍵結是發生於毒素與酵素接觸的一刻,同時認為其與酵素活性的喪失有 密切的關連。此與上述 Craig et al. (1996) 的結果與推論並不一致。
術來分析 PP-1c 與 MCYTS-LR 共價鍵形成速率的研究。和先前分析微囊藻毒的研究一樣, 研究中首先亦針對分析條件,包括樣品濃度、去鹽流程、基質種類、樣品與基質的比例, 以及共結晶形成條件等進行最適化評估後,再正式進行共價鍵形成的分析,以期能獲得足 以進行解析的分析訊號。
二、材料與方法
2-1. 藥品與重要儀器 實驗中所使用的 PP-1c 為來自兔子骨骼肌,並經 E. coli 基因轉殖所生產、純化之蛋白 質單體,由中正大學分生所黃憲斌教授所提供,並以 2.5 mg/ml 的濃度儲存於含 50 %甘油 的緩衝溶液之內。按 Calbiochem 的標準方法,分析所得的酵素比活性為 30000 unit/mg。酵 素反應緩衝液中,包括 p-NPP、bovine serum album (BSA)、dithiothreitol (DTT)、tris-HCl、 MnCl2.2H2O 在內的成分均購自 Sigma (St. Louis, MO, USA)。MALDI-TOF MS 分析前處理, 所使用的離心透析管 Amicon YM-10 購自 Millipore (Bedford, MA, USA)。樣品共結晶 (co-crystallization) 所使用的基質成分 (matrix) 中,sinapicnic acid 購自 HP (Palo Alto, CA, USA, part number G2038A),ferulic acid 配方則是參考 Bornsen et al. (1997) 的方法,以 50 % 的異丙醇水溶液 (v/v) 調配 ferulic acid (Sigma, St. Louis, MO, USA) 成 0.05 g/ml 的濃度而 成。儀器部分,MALDI-TOF MS 的主機為 HP 的 G2025A 型 (Palo Alto, CA, USA),配置有 337 nm 波長的氮氣雷射,以及 G2024A 的 sample prep accessory system,用以乾燥樣品與基 質的混合物。原廠宣稱其具有改善樣品分析效果的能力。
2-2. 樣品製備流程的評估
主要針對基質種類以及樣品塗抹、乾燥的方式等因子,評估在以包括 BSA 水溶液 (2 mg/ml),以及 PP-1c 酵素液在內的兩種樣品進行分析時,分析訊號的良宥。基質種類方面, 針對 sinapicnic acid 商品、自行調配的 ferulic acid,以及額外添加 0.1% TFA 的 ferulic acid
上,或先在 probe 上塗抹少量樣品,待 probe 表面開始出現些許白色結晶顆粒後,再將其餘 樣品塗抹上去的樣品塗抹法進行比較,同時利用顯微鏡,觀察共結晶顆粒的大小與排列的 方式。 G2025A 的探針有三種,本研究採用含有 16 個點樣區 (mesas) 的探針進行分析。 G2025A 對於該探針的設定,是將單一 mesa 表面細分成 70 個雷射擊發區塊後,以手動或 自動模式選取分析區塊,並進行訊號的加成。由過去操作的經驗中,得知以雷射擊發 1∼ 34 區塊時,並無法獲得樣品的訊號,然在對 35∼70 區塊的分析中,雖大致能獲得訊號, 然不同區塊所獲得的訊號大小與品質有明顯的差異存在。因此在操作策略上,是選取 35∼ 70 號區塊,以每區塊分析一次後累加訊號的方法,獲得兼具再現性及較高訊號雜訊比 (S/N ratio) 的訊號。在樣品完全乾燥後,將探針置入 MALDI-TOF MS 機體內,待真空度低於 10-5 torr 後,以 6 µJ 的雷射能量進行分析。 2-3. 共價鍵形成的動力學分析 先後將 555 µl 的緩衝液以及 45 µl 的酵素液,加入含有 30 µg 乾燥 MCYST-LR 的玻璃 瓶內 (PP-1c 與 MCYST-LR 的莫爾數比為 1/15),隨後將樣品置入 30 o C 恆溫槽內開始進行 反應。以和研究一中相同,然不含 BSA 的緩衝液進行實驗。於反應後的第 1、3、6、9、12、 15、18、21、24 及 27 小時期間,分別取出 50 µl 樣品進行分析。首先將樣品置入離心透析 管內,以 15000 rpm 離心 5 min 後,重複加入兩次的 100 µl 去離子水,以 15000 rpm 離心 10 min,將鹽分洗出。隨後進行倒置離心 (“recovery spin”),將 PP-1c 樣品由管內取出,此 時可獲得約 10 µl 的樣品。取其中 2 µl,與含有 0.1 % TFA 的 ferulic acid 基質配方混合後, 取出其中的 0.3 µl 分次塗抹於探針,待其自然乾燥後進行分析。
由於 G2025A 的解析度無法讓 PP-1c 的 [M+H]+ 訊號 (m/z 約 37000) 與共價鍵產物的
[M+H]+訊號 (m/z 約 38000) 達到基線分離的水準,若直接以質譜圖上此兩位置的訊號高
由此,進一步的整理出下列的方程式: PP-1c 實際高度= (5 x (m/z 37000 訊號高度) - m/z 38000 訊號高度) / 4.8 共價產物實際高度 = (m/z 38000 訊號高度 - 0.2 x (m/z 37000 訊號高度)) / 0.96 由兩種成分實際訊號高度的比例隨反應時間的變化,進行共價產物形成動力學的分析。
三、 結果
3-1. 樣品製備流程的評估 研究結果顯示,基質配方對於蛋白質訊號的良宥具有決定性的影響,塗抹與乾燥的方 式亦然。首先在以不同基質配方,分析純水內的 BSA 時,發現 sinapinic acid 配方可獲得優 於 ferulic acid 的訊號 (圖一 A, B),然在分析等體積混合的 PP-1c 與 BSA 樣品時,發現 sinapinic acid 的使用,完全無法測得訊號,然 ferulic acid 仍能測得些許的 BSA 訊號 (圖一 C, D)。由此推測,ferulic acid 對於蛋白質訊號的呈現,較不易受到 PP-1c 樣品內所含甘油 及鹽類的干擾,同時 BSA 相對於 PP-1c 易於呈現訊號。因此在後續的分析中,便選擇以 ferulic acid 為基質配方,同時考量將 BSA 成分於酵素反應的緩衝液配方內剔除,以避免其喧賓奪 主,對於欲偵測之 PP-1c 訊號產生干擾 (圖二)。 由於無法單憑基質配方的改善來測得 PP-1c 的訊號,因此考量加入去鹽的步驟,將 PP-1c 樣品內所有不利於訊號呈現之甘油與鹽類成分去除之後,再行分析。結果發現離心透析後, PP-1c 訊號獲得明顯的改善。在 ferulic acid 配方加入 0.1% TFA 後,再進行分析的結果,發 現 PP-1c 訊號的解析度獲得進一步的提升 (圖三),因此後續便以含有 TFA 的 ferulic acid 配 方,來進行後續共價鍵動力學的研究。在樣品乾燥與塗抹的方式部分,自然乾燥者所獲得之訊號,明顯較真空乾燥時為佳, 而在自然乾燥條件下,分次塗抹所獲得的訊號,遠較一次塗抹時為佳 (圖四) 。在顯微鏡的 觀察下,發現真空乾燥時會出現不具任何晶形之凝聚物,自然乾燥時,則可觀察到明顯的
在 PP-1c 與 MCYST-LR 混合後的第 1、3、6、9、12、15、18、21、24 及 27 小時,所 測得的 MALDI-TOF MS 的質譜訊號如圖六所示。PP-1c 形成共價產物的比例,隨反應時間 變化的關係如圖七所示。由此推估初反應速率接近 5% hr-1 (每小時形成共價產物的 PP-1c 比例),同時隨反應時間的進行而逐漸降低。
四、討論
MALDI-TOF MS 的技術,被視為分析蛋白質分子量技術之一大突破。目前除了廣泛應 用於蛋白質體 (proteomics) 的研究之外 (van Adrichem et al., 1998),其他相關於蛋白質分子 量變化的研究,諸如蛋白質 post-translational modifications 的種類與部位 (Mills et al., 2001) , 蛋 白 質 於 電 泳 前 所 進 行 的 alkylation 反 應 效 率 (Galvani et al., 2001) , acetylcholinesterase 與有機磷化合物的作用 (Elhanany et al., 2001),以及安非他命於頭髮內 殘留的檢測 (Claffey et al., 2001) 等領域等均有應用。本研究初步的構想即來自於此,然在 初步的研究中發現,或許是因為 PP-1c 純質的量太少、溶解度差,加上酵素液內所含鹽類 及甘油雜質的比例極高等因素,造成質譜訊號的難以呈現。雖已知質譜訊號的獲取和樣品 分子離子化及脫附的能力有關,理應可由離子化及脫附理論的研究著手,然由於尚無明確 的理論依據能完整說明整個過程,可能影響分析結果的因子又極多 (karas and kruger, 2003),因此不得不依據傳統 trial and error 試誤法則,針對許多已知能影響訊號的分析條件 一一加以評估與修正。本研究嘗試由基質配方、樣品塗抹及乾燥的方法,以及去鹽方法的 使用與否等因子著手,進行初步的測試。首先實驗結果說明,基質配方確實是影響 PP-1c 質譜訊號良宥的關鍵因子之一。實驗 中所使用的三種基質配方,sinapicnic acid 為常見的商品化配方,ferulic acid 為 Westman et al. (1998) 的研究中,最能降低鹽類雜質干擾程度之配方,而在基質中額外加入 TFA 的作法, 則是參考質譜儀的使用說明,其宣稱能增加部分蛋白質的溶解度,因而改善質譜的訊號。 在分析溶於純水的 BSA 樣品時,sinapicnic acid 配方所能獲得的訊號雖稍優於 ferulic acid,
不同的基質配方之所以對於鹽類雜質干擾的容忍程度不同,除了和基質本身的特性有 關之外,Bornsen et al. (1997) 認為還和基質的溶劑息息相關。作者認為 ferulic acid 配方, 之所以能容忍鹽類雜質的干擾,應和異丙醇/水=1/1 (v/v) 的基質溶劑有關。鹽分與甘油造 成分析訊號低劣的原因,在於其會嚴重干擾蛋白質與基質的共結晶形成 (Westman et al., 1998)。由於配方是基質的飽和溶液,在與樣品混合乾燥,乃至共結晶的過程中,最早析出 的應是基質本身;隨著乾燥的持續,分析物亦隨之析出,進而與基質間形成共結晶。當配 方中含有較多水分時,推測鹽類分子會因較易停留在未乾的溶液內延遲析出,而減緩其對 共結晶的干擾。相較於 ferulic acid 配方,sinapicnic acid 商用品配方的溶劑組成為乙氰/甲 醇/水= 60/36/8 (v/v/v) ,相較於 ferulic acid 配方的含水量極低,因此進一步的推測,含水量 的多寡或許才是真正影響基質對於鹽類雜質干擾容忍程度的因子。 樣品塗抹於 probe 表面及乾燥的方法,則是另一個會影響訊號良宥之關鍵所在。由實 驗的結果推測,此應和共結晶晶形的適切與否有關。真空乾燥時,容易形成分佈不均且晶 形不明顯的塊狀凝集,呈現的分析訊號最差。將全數 0.3 µl 體積的樣品全數點於 probe 上, 待其自然乾燥的作法,將形成許多較粗長、同時分佈均勻度稍差的晶體,呈現的分析訊號 稍佳於前者。分次塗抹後自然乾燥的作法能獲得分佈均勻且細緻的晶形,訊號亦最理想。 由此歸納出,當共結晶的晶形細緻且均勻時,能夠獲得最為理想之訊號,而乾燥、塗抹的 方法對於晶形的良宥會有決定性的影響。Westman et al. (1998) 宣稱在以其所謂” seed layer method “的方法,先在 probe 表面塗上少量基質,待其乾燥之後,再小心塗上分析樣品與基 質混合物的作法,能獲得最理想的訊號,或是其他利用類似真空鍍膜的作法,將樣品與基 質的混合液均勻的噴灑在 probe 上的作法 (Dr Wu, personal communication) ,想必亦為獲取 細緻且均勻的共結晶有關,和本實驗的作法有異曲同工之妙。
共結晶顆粒的大小與均勻度對於樣品訊號影響的規則,不僅適用於蛋白質樣品的分 析,在分析諸如微囊藻毒的小分子時亦同樣適用。因此藉由共結晶顆粒細緻度與均勻度的 改善,或許有助於提升 MALDI-TOF MS 對於微囊藻毒的偵檢極限,實質改善其於藻毒分析 的能力。
卻發現 PP-1c 並未能成功的被吸附或洗出,因此才改用傳統的離心透析法進行去鹽。在以 適當的離心透析管材質,搭配適切的離心力、離心時間以及清洗次數的前提下,能獲得十 分良好的 PP-1c 訊號,然離心透析的操作過程實則須掌握的極為嚴格,無論是稍增或稍減 去離子水的體積、多洗或少洗一次,或以過高、過低的轉速進行清洗等,均不易獲得良好 的訊號。由此歸納出,適切的去鹽為分析 PP-1c 另一個重要的因子。過度的去鹽之所以會 影響 PP-1c 的訊號,推測和 PP-1c 溶解度的降低有關。在無鹽的情況下,幾乎所有蛋白質 的溶解度均會降低,而不溶的蛋白質,會因無法和基質間形成均勻的共結晶而導致分析訊 號的低劣。PP-1c 的溶解度原本就奇差無比 (Dr Huang,personal communication),在接近無 鹽的條件下想必更差,因此相信因此而比其他蛋白質更難獲得理想的訊號。在 ferulic acid 配方內添加少量 TFA 的作法,之所以有助於改善 PP-1c 或其他蛋白質分析訊號的原因,應 和其對蛋白質溶解度的改善有關。此和 van Adrichem et al. (1998) 研究中,在基質內加入少 量介面活性劑後,脂溶性蛋白質的訊號獲得改善的原理類似。而在實驗中,BSA 的訊號之 所有遠比 PP-1c 為理想,可能亦和 BSA 的溶解度較佳有關。
本研究的結果顯示,在 in vitro 的條件下,MCYST-LR 和 PP-1c 之間的作用模式,為毒 素先很快的以非共價鍵的作用力和 PP-1c 接合,造成酵素活性的喪失後,再以十分緩慢的 速率形成共價鍵,此與 Craig et al (1996) 研究結果的推測一致,然與 Liu et al. (2000) 的推 論有極大的差異。Craig et al (1996) 的研究是以 MCYST-LL 與 PP-1c 在 30 o
C 下混合、反應 16 小時後,利用 HPLC 進行分析的結果,發現有接近 65 %的 PP-1c 形成共價產物,此和本 研究在相同溫度下,以 MCYST-LR 進行反應,所測得 60 % 的數據十分近似。Liu et al. (2000) 的作法,則是將 MCYST-LR 在室溫下與 PP-1c 進行反應後,加入介面活性劑並加以煮沸, 將未形成共價鍵的 MCYST-LR 與 PP-1c 分開後進行電泳,隨後以 MCYST-LR 的單株抗體 偵檢是否有 adduct 產物的形成。結果在反應 30 秒後即測出共價鍵產物的出現,而在混合 10 分鐘後共價產物的量即已不再增加。作者因此推測在 in vitro 條件下,毒素與酵素之間共 價鍵結的形成速率極快。Liu et al.的研究結果,推測和酵素免疫法的靈敏度太高有關,以致
五、參考文獻:
Bagu J. R., Sykes B. D., Craig M. M. and Holmes C. F. B., 1997. A molecular basis for different interactions of marine toxins with protein phosphatase-1. J. Biol. Chem., 272: 5087-5097. Bialojan C. and Takai A., 1988. Inhibitory effect of a marine-sponge toxin, okadaic acid, on
protein phosphatases. Biochem. J., 256: 283-290.
Bornsen K. O., Gass M. A. S., Bruin, G. J. M., von Adrichem, J. H. M., Biro, M. C., Kresbach, G. M. and Ehrat, M., 1997. Influence of solvents and detergents on matrix-assisted laser desorption/ionization mass spectrometry measurements of proteins and oligonucleotides.
Rapid Commun. Mass. Spectrom., 11: 603-609.
Claffey D. J. and Ruth J. A., 2001. Amphetamine adducts of melanin intermediates demonstrated by matrix-assisted laser desorption/ionization time-of-flight mass spectrometry. Chem. Res.
Toxicol., 14: 1339-1344.
Elhanany E., Ordentlich A., Dgany O, Kaplan D., Segall Y., Barak R., Velan B. and Shafferman A., 2001. Resolving pathways of interaction of covalent inhibitors with the active site of acetylcholinesterases: MALDI-TOF/MS analysis of various nerve agent phosphyl adducts.
Chem. Res. Toxicol., 14: 912-918.
Erhard M., von Dohren H. and Jungblut P., 1997. Rapid typing and elucidation of new secondary metabolites of intact cyanobacteria using MALDI-TOF mass spectrometry. Nature Biotech., 15: 906-909.
Galvani M., Hamdan M., Herbert B. and Righetti P. G., 2001. Alkylation kinetics of proteins in preparation for two-dimensional maps: a matrix assisted laser desorption/ionization-mass spectrometry investigation. Electrophoresis, 22: 2058-2065.
Goldberg J., Huang H. B., Kwon Y. G., Greengard P., Nairn A. C. and Kuriyan J., 1995. Three-dimensional structure of the catalytic subunit of protein serine/threonine phosphatase-1.
Chem. Rev., 103: 427-439.
Knapp J., Boknik P., Huke S., Luss H., Muller F. U., Muller T., Nacke P., Schmitz W., Vahlensieck U and Neumann J., 1998. The mechanism of action of cantharidin in smooth muscle. Br. J. Pharmacol., 123: 911-919.
Li Y. M. and Casida J. E., 1992. Cantharidin-binding protein: identification as protein phosphatase 2A. Proc. Natl. Acad. Sci. USA, 89: 11867-11870.
Liu B. H., Yu F. Y., Huang X., and Chu F. S., 2000. Monitoring of microcystin-protein phosphatase adduct formation with immunochemical methods. Toxicon, 38: 619-632.
Mackintosh C. and Klumpp S., 1990. Tautomycin from the bacterium Streptomyces verticillatus. Another potent and specific inhibitor of protein phosphatases 1 and 2A. FEBS Lett., 277: 137-140.
Matsuzawa S. I. Suzuki T., Suzuki M., Matsuda A., Kawamura T., Mizuno Y. and Kikuchi K., 1994. Thyrsiferyl-23-acetate is a novel specific inhibitor of protein phosphatase PP2A. FEBS
Lett., 356: 272-274.
McCluskey A., Bowyer M. C., Collins E., Sim A. T. R., Sakoff J. A. and Baldwin M. L., 2000. Anhydride modified cantharidin analogues: synthesis, inhibition of protein phosphatases 1 and 2A and anticancer activity. Bioorg. Med. Chem. Lett., 10: 1687-1690.
Mills P. B., Mills K., Johnson A. W., Clayton P. T. and Winchester B. G., 2001. Analysis by matrix assisted laser desorption/ionization-time of flight mass spectrometry of the post-translational modifications of a1-antitrypsin isoforms separated by two-dimensional polyacrylamide gel electrophoresis. Proteomics, 1: 778-786.
Quilliam M. A. and Wright J. L. C., 1995. Methods for diarrhetic shellfish poisons. In: Manual on
1833-1836.
van Adrichem J. H. M., Bomsen K. O., Conzelmann H., Gass M. A., Eppenberger H., Kresbach G. M., Ehrat M. and Leist C. H., 1998. Investigation of protein patterns in mammalian cells and culture supernatants by matrix-assisted laser desorption / ionization mass spectrometry. Anal.
Chem., 70: 923-930.
Volter K. E., Embrey K. J., Pierens G. K. and Quinn R. J., 2001. A study of the binding requirements of calyculin A and dephosphonocalyculin A with PP1, development of a molecular recognition model for the binding interactions of the okadaic acid class of compounds with PP1. Eur. J. Pharm. Sci., 12: 181-194.
Wakimoto T., Matsunaga S., Takai A. and Fusetani N., 2002. Insight into binding of calyculin A to protein phosphatase 1: isolation of hemicalyculin A and chemical transformation of calyculin A. Chem. Biol., 9: 309-319.
Walsh A. H., Cheng A. and Honkanen R. E., 1997. Fostriecin, an antitumor antibiotic with inhibitory activity against serine/threonine protein phosphatases types 1 (PP1) and 2A (PP2A), is highly selective for PP2A. FEBS Lett., 416: 230-234.
Westman A., Nilsson C. L. and Ekman R., 1998. Matrix-assisted laser desorption/ionization time-of-flight mass spectrometry analysis of protein in human cerebrospinal fluid. Rapid
Commun. Mass. Spectrom., 12: 1092-1098.
Williams D. E., Dawe S. C., Kent M. L., Anderson R. J., Craig M. and Holmes C. F. B., 1997. Bioaccumulation and clearance of microcystins from salt water mussels, Mytilus edulis, and in
圖一、基質成分對於質譜訊號的影響。A、B: BSA 水溶液分別以 sinapicnic acid 及 ferulic acid 基質分析,C、B: BSA 與 PP-1c 的混合液,分別以 sinapicnic acid 及 ferulic acid 基質進行分析 BSA, [M+H]+ BSA, [M+2H]2+ BSA, [M+3H]3+ A D C B
圖二、酵素緩衝液內 BSA 的成分對於 PP-1c 訊號的干擾
圖三、TFA 的有無對於 PP-1c 分析訊號的影響。1 為含 TFA,2 為不含 TFA 時 的分析訊號。 PP-1c, [M+H]+ PP-1c, [M+2H]+ PP-1c, [2M+H]+ BSA, [M+2H]2+ BSA, [M+H]+ PP-1c, [M+H]+ BSA, [M+3H]3+
圖四、樣品塗抹方法的不同對於 PP-1c 訊號的影響。A、分次塗抹,B、一次全數塗 抹 PP-1c, [M+H]+ PP-1c, [M+2H]2+ PP-1c, [2M+H]+ A B
圖五、各種樣品製備流程下所呈現的晶型,A、全數塗抹後真空乾燥者,B、全數塗 抹後自然乾燥,C、分次塗抹後自然乾燥
B A
圖六、共價產物動力學分析中,不同反應時間點所測得之質譜圖 0 3 6 9 12 15 18 21 24 27 m/z 37000 38000 Time (hr)
圖七、 PP-1c 共價產物形成的動力學。 Percent age of adduc t format ion Y (%) = -0.07 X2 + 4.68 X + 0.0264
附件:相關著作
註: 群體計畫 (PPG) 者,不論是否提出各子計畫資料,都必須提出總計畫整合之資料。 若為群體計畫,請勾選本表屬於﹕■ 子計畫;或 □ 總計畫 (請自行整合)。 1.列出貴計畫於本年度中之所有計畫產出於下表,包含已發表或已被接受發表之文獻、已 取得或被接受之專利、擬投稿之手稿 (manuscript) 以及專著等。 2.「計畫產出名稱」欄位:請依「臺灣醫誌」參考文獻方式撰寫﹔ 3.「產出型式」欄位:填寫該產出為國內期刊、國外期刊、專利、手稿或專著等。4.「SCI」欄位:Science Citation Index,若發表之期刊為 SCI 所包含者,請在 欄位上填寫 該期刊當年度之 impact factor。 5.「致謝與否」欄位:請註明該成果產出之致謝單位。若該成果產出有註明國科會資助字 樣者,請以 NSC 註明。 序號 計 畫 產 出 名 稱 產出型式 SCI* 致謝 與否 1.
Chen Y. M., Chou H. N., Bai J. U., Lee T. H. and Huang R., 2005. Comparison of protein phosphatase inhibition assay with the mouse and Artemia toxicity assays in the toxic
Microcystis screening. Aquatic Toxicol., in revision.
國外期刊 是
(2.2) 有
2.
Chen Y. M., Huang R. and Chou H. N., 2004. Application of protein phosphatase 1 inhibition assay and a reversed phase liquid chromatography for the detection of microcystins in algal dietary supplements. J. Food Drug Anal., in press.
國內期刊 是
(0.6) 有
3.
Chen Y. M., Huang, H. B., Lee S. J., Lee, T. H., and Chou, H. N., 2005. Application of MALDI-TOF MS on Monitoring of Microcystin-phosphatase Adduct Formation. Toxicon,
manuscript in preparation.
國外期刊 是
(2.0) 有
4.
Chen, Y. M., Huang R., Huang, H. B., Lee, T. H., and Chou, H. N., 2004. Comparison of protein phosphatase inhibitory activities and acute toxicity of microcystins. 6thICTC, Bergen, Norway.
國外研討
會 有
5.
Chen, Y. M., Huang R., Huang, H. B., Lee, T. H., and Chou, H. N., 2004. Protein phosphatase inhibitory activities and animal toxicities of microcystins. 6th ICTC, Bergen, Norway.
國外研討
會 有
6. 陳逸民,黃穰,周宏農,2004。認識微囊藻毒。藥物食品
Comparison of protein phosphatase inhibition assay with the mouse and Artemia
toxicity assays in the toxic Microcystis screening
Yi-Min Chena,b, Hong-Nong Choua,*, Jeng-Yu Baia, Tzong-Huei Leea1, Rang Huangb
a
Institute of Fisheries Science, National Taiwan University, Taipei 106, Taiwan
b
Institute of Oceanography, National Taiwan University, Taipei 106, Taiwan
*Corresponding author. Hong-Nong Chou Professor and Director Institute of Fisheries Science National Taiwan University 1 Sec. 4, Roosevelt Road Taipei 106, Taiwan
Tel.: +886-2-23639291~125 Fax: +886-2-23629919
E-mail address: [email protected]
1
present address: Tzong-Huei Lee, Graduate Institute of Pharmacognosy Science, Taipei Medical University, Taipei 110, Taiwan
Abstract
The inhibitory activity of microcystins on protein phosphatase 1 (PP1) was applied for the
screening of toxic Microcystis. Activity of protein phosphatase 1 was measured by the
absorption at 405 nm of the p-nitrophenol, the enzyme reaction product of p-nitrophenyl
phosphate. Inhibitory activities were represented by the ratio of p-nitrophenol absorption, with
and without the presence of microcystin-LR or crude extract of Microcystis. Eight strains of M.
aeruginosa, isolated from various aquaculture ponds and water reservoirs in Taiwan have been
cultured for toxicity analysis. Extracts of the cyanobacteria were subjected to the mentioned
enzyme inhibition assay as well as mouse and brine shrimp toxicity assays. Extracts from 200
ng dry cells of the toxic strains were found to be quite enough to observe the inhibition on protein
phosphatase activity. Ranking of the enzyme inhibitory potency of the strains was found almost
in accordance with that in mouse or brine shrimp toxicity assay. A conversion of IC50 from PP1
inhibition activities and LD50 or LC50 from animal toxicities of Microcystis extracts to the
contents of microcystin-LR equivalent was very useful for such comparison. The toxin contents
of microcystin-LR equivalent in M. aeruginosa strains from this conversion agreed well with the
1.
IntroductionBlooms of Microcystis occur worldwide in fresh and brackish water (Hallegraeff, 1993;
Falconer et al., 1999). They usually cause serious environmental hazards, not only forming the
anoxia condition in the water, but also producing toxins. The toxins produced by Microcystis are
hepatotoxic microcystins (Park and Watanabe, 1996), which have been implicated in the death of
livestock (Kaya et al., 1996), aquaculture fish (Anderson et al., 1993) and wild animals (Murphy
et al., 2000), as well as illness (Falconer et al., 1983) and death (Pouria et al., 1998) of human.
The highly toxic effect of microcystins as well as their apparent tumor promoting activity in liver
is suspected the result from their inhibition on protein phosphatase 1 (PP1) and protein
phosphatase 2A (PP2A), known as the major serine/threonine protein phosphatases in eukaryotic
cells (Mackintosh et al., 1990; Nishiwaki-Matsushima et al., 1992; Toivola et al., 1999).
Microcystins are cyclic heptapeptides that share a general structure of
cyclo
-
D-Ala-
L-X-
D-methyl-Asp-
L-Z-
Adda-
D-Glu-
N-methyl-dehydroalanine (Fig. 1), where X and Z represent the single letter abbreviation of variable amino acids inserted in the sequence,and Adda represents 3-amino-9-methoxy-2,6,8- trimethyl-10-phenyldeca-4,6-dienoic acid.
Protein phosphatase inhibition assay using PP1 and PP2A with the radioactive enzyme
substrate has been developed for quantitative analysis of microcystins (Craig et al., 1993;
Lambert et al., 1994). Recently chromatic and fluorescent methods using p-nitrophenyl
phosphate (p-NPP) (An and Carmichael, 1994; Ash et al., 1995; Tubaro et al., 1996; Rivasseau et
al., 1999; Wong et al., 1999), 4-methylumbelliferyl phosphate (4-MUP) and fluorescein
diphosphate (FDP) (Vieytes et al., 1997; Fontal et al., 1999) as enzyme substrates are replacing
radioactive detections in protein phosphatase inhibition assays. In this research we applied the
multi-well microplate and the chromatic methods in PP1 activity analysis to screen the enzyme
inhibition activity of the various strains of Microcystis aeruginosa in comparison with their
toxicities on mice and brine shrimp larvae. Various concentrations of Microcystin-LR were
applied as positive controls in these phosphatase inhibition assay and animal toxicity assay.
Toxin profiles of these M. aeruginosa strains were also analyzed by high performance liquid
chromatography (HPLC) to confirm the relationship between their microcystin content and
animal toxicity.
2. Materials and methods
Eight strains of Microcystis aeruginosa were isolated from freshwater ponds or water
each strain were prepared by mixing 200 mg lyophilized cells in 40 ml methanol with a Vortex
and centrifuged to collect the supernatant. Cell residues were repeated for another two
extractions by 40 ml methanol. All three methanolic extracts were combined and ready for the
preparation of various concentration solutions used in the following assays.
2.1. Mouse toxicity assay
From the ethanolic extract of each M. aeruginosa strain, 14.4, 7.2, 3.6, 1.8, 0.9, 0.45 and
0.225 ml were taken out and transferred into separate vials and evaporated to dryness. These
dry residues were re-suspended in 3 ml saline solution (0.95%) for intra-peritoneal injection of
mice (ICR strain, male, 20±1 g, from Animal Supply of National Taiwan University Hospital,
Taipei, Taiwan), 1 ml each and three duplicates for each dose. This makes seven doses equivalent
to 400, 200, 100, 50, 25, 12.5 and 6.25 mg dry cells per kg mouse for mouse toxicity assay.
Four hours after each injection, the mortality of each dose was recorded (Lee et al., 1999).
Toxicities of each M. aeruginosa strain, represented by LD50,were then calculated by probit
analysis accordingly (Finney, 1963).
Toxin standard MCYST-LR, prepared as in Lee and Chou (2000) was applied as control in
Snowville, UT, USA) one day ahead of the toxicity assay following the method in Lee et al.
(1999). Live larvae were suspended in seawater in a concentration of about 250 individuals per ml and transferred to 96-well-microplates, 50 µl per well. Forty-eight millilitersof the ethanolic extracts from each M. aeruginosa strains were extracted twice with 24 ml n-hexane to remove the
oil soluble components and then evaporated to dryness. Dried residues of each sample were
re-dissolved in 0.5 ml seawater to give a concentration of 160 mg/ml in terms of lyophilized cell
mass. Further dilutions to concentrations of 80, 40, 20, 10 and 5 mg/ml were also prepared for
every strain. Fifty microliters of each sample solutions were added to each well containing 50 µl of larvae suspension, 4 duplicates of each sample. Mortalities of each well in brine shrimp assay were recorded after 24 hr treatment and toxicities of each M. aeruginosa strains,
represented as LC50, were also calculated by probit analysis (Finney, 1963).
Another batch of the same volume of sample extracts were prepared through the same
de-fat procedure as described above and then went through a solid phase extraction (SPE)
operation to remove any components that may interfere the death of brine shrimp caused by
microcystins. The SPE operation used a column of 0.6 cm i.d. that was packed with 0.1 g silica gel (Baker silica gel 40 µm flash chromatography packing, J. T. Baker, Phillipsburg, NJ, USA). Columns were preconditioned with 5 ml of ethyl acetate/isopropanol 4/3 (v/v). De-fatted
re-dissolved in 0.5 ml seawater and then diluted to give concentrations of 160, 80, 40, 20, 10 and
5 mg/ml in terms of lyophilized cell mass separately. Brine shrimp larvae toxicity was thus
performed with these solutions in wells on microplate as described above. Toxicities of each M.
aeruginosa strains were calculated and represented by LC50. These data were compared with
the data obtained from the same assay without SPE operation.
LC50 of toxin standard, MCYST-LR, was also determined as a control in brine shrimp
larvae toxicity assay for methanolic extracts of M. aeruginosa strains. Five concentrations of MCYST-LR, 20, 10, 5, 2 and 1 µg/ml were applied in the same assay.
2.3. Protein Phosphatase 1 inhibition assay
The PP1 inhibition assay used E. coli recombinant protein phosphatase 1 α-isoform of rabbit muscle (Cat. No. 539493, CalBiochem, San Diego, CA, USA), in a buffer solution
containing 50 mM Tris-HCl, pH7.0, 0.1 mM EDTA, 5 mM dithiothreitol, 0.2 mM MnCl2 and
BSA 0.2 mg/ml, following the protocol kindly supported by Dr. Chang (Technical Service,
CalBiochem). Enzyme activity assay used p-nitrophenyl phosphate (p-NPP) as substrate and
detected by the 405 nm absorption of the reaction product p-NP with a SPECTRA Fluor Plus
buffer.
Each concentration of sample extracts (Sam.) including the control (Con.) that contained
no Microcystis extract but methanol of the same ratio in buffer occupied a row of 6 wells separately on a plate. Each well in the row was filled with 100 µl buffer and 50 µl sample solutions. Among the 6 wells in each row, three were added individually with 50 µl enzyme solution and 50 µl buffer as an experiment (Exp.) group in triplication, while the other three were added 100 µl buffer separately as the blank (Blk.) group. Sample solutions were allowed to incubate with the enzyme solutions for 10 min before the adding of 50 µl 250 mM p-NPP substrate solutions to each well to initiate the enzyme reaction. The absorbance at 405 nm was
measured for each well at time zero and time 60 min, and the absorbance difference between
these two measurements was then recorded. Average of the absorbance difference of the
triplicates in each group was applied in the enzyme activity calculation for each sample groups
and control. The term ‘percentage activity of the control’ here is used to describe the remaining
enzyme activity after the sample inhibition and its calculation as followed:
1. Activity of Control = average absorbance difference of Exp. (in Con.) – average
absorbance difference of Blk. (in Con. )
Microcystin-LR solutions were also prepared in a successive dilution and they were 1280,
640, 320, 160, 80, 40, 20, 10 and 5 pg per well in the same enzyme activity assay. The same
percentage activity of control was plotted against the toxin concentrations to reveal the 50%
inhibition (IC50) of the toxin standard to the protein phosphatase activity. The correlation
between the toxin concentration and the percentage activity of control remained was analyzed by
several regression methods provided by Microsoft Excel®, and the best-fitted regression formula
was applied for the calculation of IC50. Protein phosphatase inhibition activities of the
methanolic extracts of various Microcystis strains were also judged by their IC50 through the
same correlation analysis. Microcystin contents in cell masses of different Microcystis strains
thus can be estimated by converting their IC50 in the protein phosphatase inhibition assay to the
amount of MCYST-LR equivalent. The conversion used the ratio of IC50 of MCYST-LR and
the IC50 of Microcystis extract, which is multiplied by a factor of 1000 to represent a value
equivalent to MCYST-LR (in mg) per gram of dried Microcystis cell mass.
An alternative procedure in protein phosphatase inhibition assay was also developed in this
study for direct measurement of MCYST-LR equivalent in Microcystis cell mass. The same
compared and their correlation was judged by the linear regression.
2.4. Correlations among mouse toxicity, Artemia toxicity, and PP1 inhibition assays
To determine whether the toxicities of mice or brine shrimps caused by the methanolic
extract of various Microcystis strains were due to their microcystin contents, we first converted
the LD50 and LC50 in different toxicity assays into toxin contents in these strains and compare the
toxin contents obtained by different assays. The conversion of to the toxin contents of
MCYST-LR equivalent followed the same method as described in protein phosphatase inhibition
assay, using the LD50 and LC50 of toxin standard, MCYST-LR in their respective assays.
2.5. HPLC analysis of different microcystins in Microcystis
An isocratic HPLC with UV absorption at 238 nm was applied for microcystin analysis. A Luna phenyl-hexyl 5 µ column (4.6 x 250 mm, Phenomenex, Torrance, CA, USA) and a mobile phase of 0.01 M ammonium acetate/acetonitrile = 75/25, flow rate 1 ml/min were used for
a complete separation of different microcystins. From the mentioned methanolic extracts of
Microcystis, 2.4 ml were brought to dryness by N2 stream and re-dissolved in 0.3 ml ethyl
acetate/isopropanol = 4/3 (v/v). These solutions went through an SPE sample preparation
[D-Asp3]MCYST-FR, and [D-Asp3]MCYST-WR (Fig. 1), previously purified and identified by
Lee et al. (1998) were used to identify the different microcystins in Microcystis. Quantitative
determination of microcystins was based on the calibration curve of MCYST-LR within the range of 0.9 µg and 1 ng.
3. Results
3.1. Mouse toxicity assay
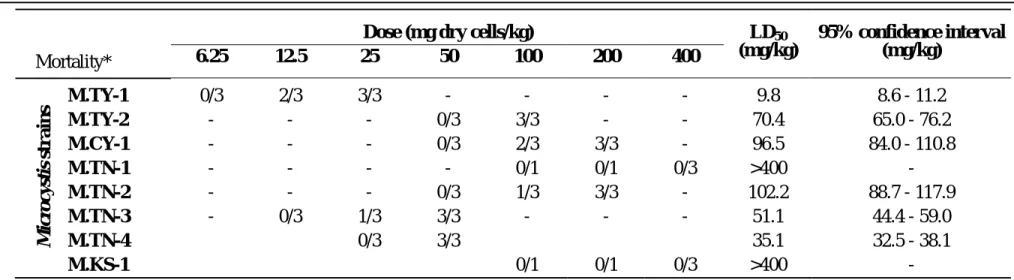
Table 1 shows the results of mouse toxicity assay of MCYST-LR and extracts of various
Microcystis strains. Probit analysis revealed the LD50 of MCYST-LR to be 46.9 µg/kg with the 95% confidence interval of 42.4-51.9 µg/kg. Methanolic extracts of various Microcystis strains also showed different toxicities against mice, and their LD50 were within the range of 9.8-102.2
mg dry cells/kg of mouse, except strains of M.TN-1 and M.KS-1. These two strains were
regarded as nontoxic due to the zero death of mice even after intra-peritoneal injections of extract
equivalent to 400 mg cell mass, the highest dose in this experiment. Ranking of the toxic strains
based on their potency of toxicity against mice was listed as follows,
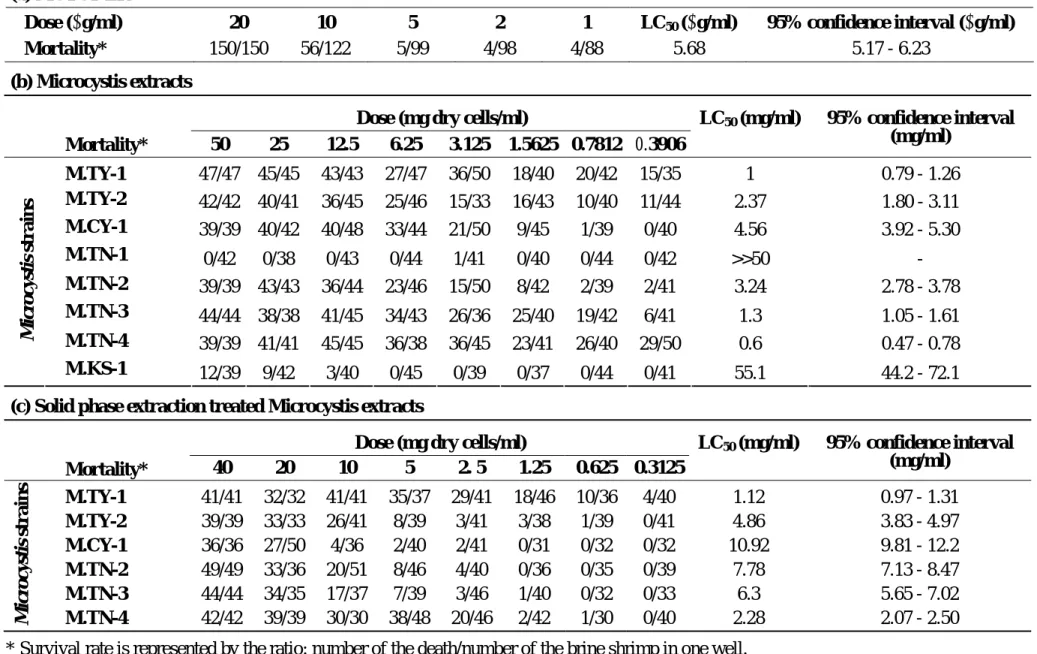
on Artemia larvae. Probit analysis showed the LC50 of MCYST-LR at 5.68 µg/ml with 95% confidence interval between 5.17-6.23 µg/ml. Extract of various Microcystis strains also showed different toxicities from 0.6 mg to 4.5 mg cells equivalent per ml. Although strain
M.KS-1 showed some toxicity to brine shrimp larvae at concentration above 12.5 mg cell mass
equivalent/ml, it is regarded as non-toxic as strain M.TN-1. Further purification by solid phase
extraction on the de-fatted methanolic extracts of Microcystis showed a reduction of the toxicity
of the extracts when they were applied for the same Artemia toxicity assay (Table 2). Solid
phase extraction was designed to remove the non-polar component and save the microcystins. It
is apparent that the methanolic extract of Microcystis contains components other than
microcystins that may kill brine shrimp larvae or reinforce the toxicity of microcystins on brine
shrimp. Ranking of the toxic strains of Microcystis according to their toxicities against brine
shrimp larvae was listed as follows, M.TY-1>M.TN-4>M.TY-2>M.TN-3>M.TN-2>M.CY-1. The
ranking may be slightly different without SPE treatment (Table 2). However, if we divided
these six strains into 3 groups of the toxic, less toxic and least toxic, two strains in one group, we
could find the consistency in the ranking of groups, in both Artemia and mouse toxicity assay
(Table 3).
using the natural logarithm function that best fit the curve of the toxin standard (R2=0.97) was
then established. From this curve IC50 of MCYST-LR was determined to be 0.13 ng/ml. Similar
calculations have been applied for the corresponding curves of various Microcystis extracts and
their IC50 were determined as 25.0 ng/ml (M.TY-1), 198.5 ng/ml (M.TY-2), 241.0 ng/ml
(M.CY-1), 457.5 ng/ml (M.TN-2), 196.9 ng/ml (M.TN-3), and 129.5 ng/ml (M.TN-4) (Fig. 2).
3.4. Correlations among mouse toxicity, Artemia toxicity, and PP1 inhibition assays
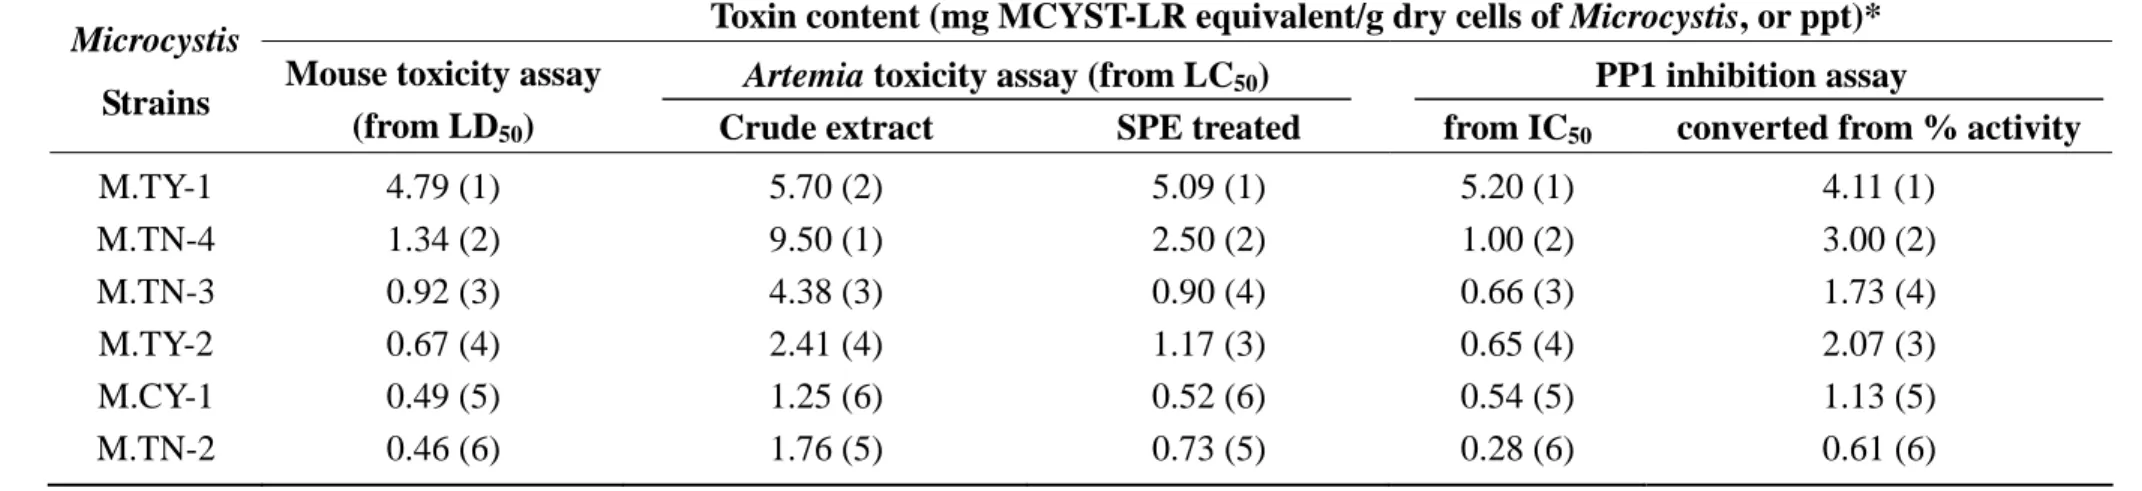
Toxin contents of various Microcystis strains, in a form of MCYST-LR equivalent, those
were converted from LD50 and LC50 in different assay methods were listed in Table 3.
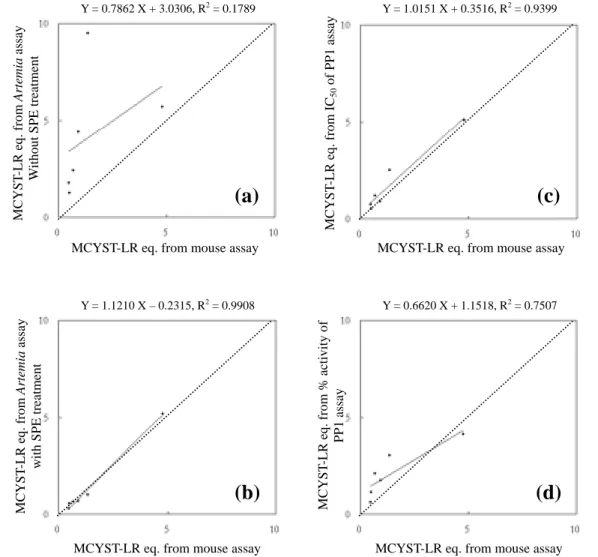
Correlation charts showing the toxin contents obtained from different assays were presented in
Fig. 3. It is obvious that the toxin content in the methanolic extracts without SPE treatment is
much higher from brine shrimp toxicity assay than those from mouse toxicity, and the regression
line diverges from the diagonal line a lot (Fig. 3A). However, with the SPE sample preparation
the toxin contents in various Microcystis strains obtained from Artemia toxicity assay were close
to those from mouse toxicity assay with slight overestimation (Fig. 3B). Toxin contents
converted from IC50 of PP1 inhibition assay showed much agreement with those converted from
both mouse and brine shrimp toxicity were related to their protein phosphatase 1 inhibition
caused by the microcystins in Microcystis. However some other toxic effects from other
components in Microcystis may be exist, especially in the death of brine shrimp larvae.
3.5. HPLC analysis of microcystins in various strains
From HPLC analysis, a calibration line, y = 830.9x + 4608.3 (R2=0.9939, where y: peak
area, x: MCYST-LR in ng) of MCYST-LR within the range of 0.9 µg and 1 ng was obtained from HPLC analysis, and the HPLC chromatograms of microcystins of various Microcystis strains
were presented in Fig. 4. There was no identifiable microcystins could be found in the same
profile of nontoxic M.TN-1 and M.KS-1, therefore their chromatograms were excluded here.
Nevertheless, those strains showed toxicity to mice and brine shrimp larvae were found to contain
various microcystins (Fig. 4). It was found that strain M.TY-1 contained MCYST-LR mainly,
which was more than 85% of its microcystin composition. Quantitative analysis from the
calibration curve of MCYST-LR (Fig. 4) revealed the content of MCYST-LR in M.TY-1 was 4.75
ppt. Since there existed other minor microcystins, such as [Dha7]MCYST-LR and
[D-Asp3]MCYST-LR (unpublished data) that were not clearly distinguishable in this experiment,
the actual MCYST-LR equivalent of M.TY-1 considering the conversion from the toxicity of the
available at this time, it is not possible to calculate the total toxicity in different strains from
HPLC analysis.
4. Discussion
There were two major objectives of this research, one is to determine whether the toxicities
of Microcystis against mice or brine shrimp larvae are due to the protein phosphatase inhibition
activity of microcystins, and another one is to evaluate the sensitivity and accuracy of these two
toxicity assays and protein phosphatase inhibition assay. It has been reported that the LC50 of
MCYST-LR on Artemia salina is 5±0.2 µg/ml (48 hr treatment) (Vezie et al., 1996). We also reported an LC50 of 22.3 µg/ml of MCYST-LR (Lee, et al., 1999). In this experiment we obtained a value of 5.68 µg/ml for the LC50 of MCYST-LR in a 24 hr treatment. It was found the brine shrimp eggs used for hatching in both experiments were of the same batch and the
hatching rate of this durable egg package had decreased from 90% in 1998 to 30% in 2002. It
was speculated the older eggs have a poor viability, so do the larvae from aged eggs. Hence a
less LC50 of MCYST-LR or in other word, more sensitive while using larvae from aged eggs in
the Artemia toxicity assay. The age of the eggs should be controlled while comparing the LC50
preparation procedure of SPE for HPLC analysis was very useful for the removal of interfering
substances in the methanolic extract of Microcystis. With the same conversion of LD50 to the
toxin content of MCYST-LR equivalent in mouse toxicity assay, it was found that the toxin
content obtained from mouse assay had a better correlation with the toxin content obtained from
Artemia assay with SPE sample preparation than the toxin content obtained from Artemia assay
without SPE sample preparation (Fig. 3a, b).
Similar conversion was also applied for IC50 of different Microcystis extracts in PP1
inhibition assay, and a very good correlation between the toxin contents obtained from mouse
toxicity assay and PP1 inhibition was observed. This result indicated that the mouse toxicity
caused by microcystins was directly related to their inhibitions on the protein phosphatase 1
without any other toxic effects from microcystins or other unknown components. It has been
reported that the death of mouse is due to the massive hepatic haemorrhage as a result of the liver
cytoskeleton disruption caused by the protein phosphorylation imbalance from inhibition of
serine/threonine protein phosphatase 1 and 2A by accumulated microcystin in liver (Falconer et
al., 1981; Eriksson et al., 1990; Honkanen et al., 1990). However, in the Artemia toxicity assay,
the death of brine shrimp larvae may be also from protein phosphatase 1 inhibition of
were observed to exert toxic effect on brine shrimps. It has been reported that long-chain
unsaturated fatty acids are Na+/K+-ATPase inhibitors in brine shrimps (Morohashi et al., 1991).
Bury et al. (1998) also reported that long chain fatty acids in Microcystis aeruginosa were the
cause of fish death due to their potent inhibitory effects on fish gill Na+/K+-ATPase. We
speculate similar components that may kill brine shrimp larvae or intensify the toxicity of
microcystins are in our Microcystis strains when brine shrimps were immersed in the solutions of
Microcystis extract, and these components can be removed by SPE sample treatment, especially
in the strains of M.TN-4 and M.TN-3 (Table 3). Hence, there would be a better correlation
between the Artemia and mouse toxicity, if the Microcystis extracts went through the SPE
procedure before adding to the assay media.
Our practice of PP1 inhibition assay has proven itself a fast and reliable method for
quantitative analysis of microcystin when comparing the results from PP1 inhibition assay with
the results from other methods (Table 3). Toxin contents obtained as MCYST-LR equivalent
were quite different from the data obtained by our previous ELISA analysis (Yu et al., 2002). It
was realized that strains of Microcystis might not maintain their toxin content in different batches
per well. So, an alternate methodology has been designed and tested. Instead of testing the
sample in series concentrations to obtain the IC50 for toxin content conversion, we applied the
quantity of extract equivalent to 200 ng drycells per well in this PP1 assay. From its percentage
activity of control MCYST-LR equivalent of the sample was converted based on the regression
curve showing the correlation of percentage activity of control and the dose of pure MCYST-LR
standard (Fig 2). It was found that such a conversion might give accurate data when the sample
concentration was adjusted to have a percentage activity of control falling within the range of
40% to 80%.
Although the detection limit of the PP1 assay applied in the study can reach 5 pg/well for
pure MCYST-LR, same power is only equivalent to 25 ppm when 200 ng dry cell/well was applied. The sensitivity is beyond the action limit of 1.0 µg MCLR/g AFA regulated by the State of Oregon Department of Agriculture (MCLR: microcystin-LR, AFA: Aphanizomenon
flos-aquae a cyanobacteria food supplement) (Schaeffer et al., 1999). Increasing cell amount or
the related algal food supplement has been tried in PP1 assay in order to reach the needed 1 ppm
toxin level for positive detection. However, components other than MCYST in samples might
interfere with the detection or nonspecifically deactivate PP1 activity that gave false positive results. It was observed when extract of 60 µg or higher dry cell equivalent was applied in one
analysis, unpublished data), an amount up to 250 µg dry cell equivalent per well was proven to be free from the non-MCYST inhibition. The detection sensitivity then can reach to 20 ppb, equal
or higher than the sensitivity of ELISA (Yu et al., 2002).
Another phenomenon is also observed while comparing the non-toxic samples with the
control, the absorbance of 405 nm from the product of PP1 reaction was slightly enhanced in the
tests of nontoxic Microcystis extract or algal food supplement. Similar observation was also
reported by Honkanen et al. (1996), in which PP-2A was applied on the detection of okadaic acid
contained in mussels. The increase of absorbance was speculated to be from some unknown
phosphatase activators indigenous to samples or trace components that gave absorption at 405 nm.
Basically the inherited phosphatases should have been excluded from the list of causing agents,
since the samples were extracted with methanol and then cleaned by solid phase extraction.
These types of activation may influence the sensitivity and accuracy of PP1 inhibition assay, and
need to be eliminated by some clean-up procedures.
Acknoweldgement
This work was supported in part by grants (NSC92-2311-B002-103, and NSC91-2323-B002-009
Anderson, R.J., Luu, H.A., Chen, D.X.X., Holmes, C.F.B., Kent, M.L., Blanc, M.L., ‘Max’ Taylor F.J.R., Williams, D. E., 1993. Chemical and biological evidence links microcystins to salmon ‘Netpen liver disease’. Toxicon 31, 1315-1323.
Ash, C., Mackintosh, C., Mackintosh, R., Fricker, C.R., 1995. Use of a protein phosphatase inhibition test for the detection of cyanobacterial toxins in water. Water Sci. Tech. 31, 51-53.
Bury, N.R., Codd, G.A., Wendelaar Bonga, S.E., Flik, G., 1998. Fatty acids from the
cyanobacterium Microcystis aeruginosa with potent inhibitory effects on fish gill
Na+/K+-ATPase activity. J. Exp. Biol. 201, 81-89.
Carmichael, W.W., Beasely, V., Bunner, D.L., Eloff, J.N., Falconer, I., Gorham, P., Harada, K.I.,
Krishnamurthy, T., Yu, M.J., Moore, R.E., Rinehart, K., Runnegar, M., Skulberg, O.M.,
Watanabe, M., 1988. Naming of cyclic heptapeptide toxins of cyanobacteria (blue-green
algae). Toxicon 26, 971-973.
Craig, M., McCready, T.L., Luu, H.A., Smillie, M.A., Dubord, P., Holmes, C.F.B., 1993.
Identification and characterization of hydrophilic microcystins in Canadian freshwater.
Toxicon 31, 1541-1549.
poisoning by the blue-green alga Microcystis aeruginosa. Aust. J. Biol. Sci. 34, 179-187.
Falconer, I.R., Beresford, A.M., Runnegar, M.T.C., 1983. Evidence of liver damage by toxin from
a bloom of the blue-green algae. Med. J. Austral. 1, 511-514.
Falconer, I.R., 1999. An overview of problems caused by toxic blue-green algae (cyanobacteria)
in drinking and recreational water. Environ. Toxicol. 14, 5-12.
Finney, D.J., 1963. Probit analysis (rev. ed.). Cambridge Univ. Press, Londen.
Fontal, O.I., Vieytes, M.R., Baptista, J.M.V., Louzao, M.C., Botana, L.M., 1999. A fluorencent
microplate assay for microcystin-LR. Anal. Biochem. 269, 289-296.
Hallegraeff, G.M., 1993. A review of harmful algal blooms and their apparent global increase.
Phycologia 32, 79-99.
Honkanen, R.E., Zwiller, J., Moore, R.E., Daily, S.L., Khatra, B.S., Dukelow, M., Boynton, A.L.,
1990. Characterization of microcystin-LR, a potent inhibitor of type 1 and type 2A protein
phosphatases. J. Biol. Chem. 265, 19041-19404.
Honkanen, R.E., Stapleton, J.D., Bryan, D.E., Abercrombie, J., 1996. Development of a protein
phosphatase-based assay for the detection of phosphatase inhibitors in crude whole cell and
Lambert, T.W., Boland, M.P., Holmes, C.F.B., Hrudey, S.E., 1994. Quantification of hepatotoxins
in water at environmentally relevant concentrations with the protein phosphatase bioassay.
Environ. Sci. Technol. 29, 753-755.
Lee, T.H., Chen, Y.M., Chou, H.N., 1998. First report of microcystins in Taiwan. Toxicon 36,
247-255.
Lee, T.H., Chen, Y.M., Chou, H.N., 1999. Toxicity assay of cyanobacterial strains using Artemia
salina in comparison with the mouse bioassay. Acta Zool. Taiwanica 10, 1-9.
Lee, T.H., Chou. H.N., 2000. Isolation and identification of seven microcystins from a cultured M.
TN-2 strain of Microcystis aeruginosa. Bot. Bull. Acad. Sin. 41, 1987-2002.
Mackintosh, C., Beattie, K.A., Klumpp, C., Cohen, C., Codd, G.A., 1990. Cyanobacterial
microcystin-LR is a potent and specific inhibitor of protein phosphatase 1 and 2A from both
animals and higher plants. FEBS Lett. 264, 187-192.
Morohashi, M., Tsuchiya, K., Mita, T., Kawamura, M., 1991. Identification of sodium potassium
ATPase inhibitor in brine shrimp Artemia salina as long-chain fatty acids. J. Comp. Physiol.
(B) 161, 69-72.
Murphy, T., Lawson, A., Nalewajko, C., Murkin, H., Ross, L., Oguma, K., Mclntyre, T., 2000.
Nishiwaki-Matsushima, R., Ohta, T., Nishiwaki, S., Suganuma, M., Kohyama, K., Ishikawa, T.,
Carmichael, W.W., Fujiki, H., 1992. Liver tumor promotion by the cyanobacterial cyclic
peptide toxin microcystin-LR. Cancer Oncol. 118, 420-424.
Park, H.D., Watanabe, M.F., 1996. Toxic Microcystis in eutrophic lakes. In: Watanabe M.F.,
Harada K.I., Carmichael W.W., Fujiki H. (Eds), Toxic Microcystis. CRC Press, New York,
pp. 57-77.
Pouria, S., de Andrade, A., Barbosa, J., Cavalcanti, R. L., Barreto, V.T.S., Ward, C.J., Preiser, W.,
Poon, G.K., Neild, G.H., Codd, G.A., 1998. Fatal microcystin intoxication in haemodialysis
unit in Caruaru, Brazil. Lancet 352, 21-26.
Rivasseau, C., Racaud, P., Deguin, A., Hennion, M.C., 1999. Evaluation of an ELISA kit for the
monitoring of microcystins (cyanobacterial toxins) in water and algae environmental
samples. Environ. Sci. Technol. 33, 1520-1527.
Schaeffer, D.J., Malpas, P.B., Barton, L.L., 1999. Risk assessment of microcystin in dietary
Aphanizomenon flos-aquae. Ecotoxicol. Environ. Safety 44, 73-80.
Toivola, D.M., Eriksson, J.E., 1999. Toxins afffecting cell signalling and alternation of
cyanobacterial strains using Artemia salina and Microtox assays compared with mouse
bioassay results. Phycologia 35, 198-202.
Vieytes, M.R., Fontal, O.I., Leira, F., Baptista,J. Sousa M.V.D., Botana, L. M., 1997. A
fluorescent microplate assay for diarrheic shellfish toxins. Anal. Biochem. 248, 258-264.
Wong, B.S.F., Lam, P.K.S., Xu, L., Zhang, Y., Richardson, B.J., 1999. A colorimetric assay for
screening microcystin class compounds in aquatic system. Chemosphere 38, 1113-1122.
Yu, F.Y., Liu, B.H., Chou, H.N., Chu, F.S., 2002. Development of a sensitive ELISA for the
determination of microcystins in algae. J. Agri Food Chem. 50, 4176-4182.
microcystin X Z R1 R2
MCYST-LR Leu Arg CH3 CH3
MCYST-RR Arg Arg CH3 CH3
MCYST-FR Phe Arg CH3 CH3
H 7 Mdha or Dha 6 D-Glu 5 Adda 1 D-Ala 3 D-MeAsp or D-Asp H 2 4 O CH2 H H H HN N NH HN X N N Z NH H H COOH H3C H3C H H H H3C COOH OCH3 H H CH3 O H O O O O O R2 R1
[D-Asp3]MCYST-WR Trp Arg H CH3
IC50 = 457.5 ng/ml M.TN-2 IC50 = 25.0 ng/ml M.TY-1 IC50 = 198.5 ng/ml M.TY-2 IC50 = 196.9 ng/ml M.TN-3 IC50 = 241.0 ng/ml M.CY-1 IC50 = 129.5 ng/ml M.TN-4 MCYST-LR IC50 = 0.13 ng/ml
Fig. 3. Correlations between mouse toxicity assay and other assays using the toxin content of MCYST-LR equivalent converted from the LD50 in mouse assay, LC50 in Artemia
assay and IC and percentage activity of control in protein phosphatase 1 inhibition
Y = 0.7862 X + 3.0306, R2 = 0.1789
MCYST-LR eq. from mouse assay
M C Y S T -LR eq. from Artemia as sa y W ithout SPE tr eatment
(a)
Y = 1.0151 X + 0.3516, R2 = 0.9399MCYST-LR eq. from mouse assay
M C Y S T -LR eq. from IC 50 of PP1 a ssa y
(c)
Y = 1.1210 X – 0.2315, R2 = 0.9908MCYST-LR eq. from mouse assay
M C Y S T -LR eq. from Artemia as say with SPE tr eat m ent
(b)
Y = 0.6620 X + 1.1518, R2 = 0.7507MCYST-LR eq. from mouse assay
M C Y S T -LR eq. from % activity of PP1 a ssa y
(d)
Fig. 4. HPLC analysis of microcystins in toxic Microcystis aeruginosa strains, M.TY-1, M.TY-2, M.CY-1, M.TN-2, M.TN-3, and M.TN-4, revealing MCYST-LR (LR), MCYST-FR (FR), MCYST-RR (RR), MCYST-WR (WR), MCYST-RA (RA), [D-Asp3]MCYST-LR ([Asp]LR), [D-Asp3]MCYST-FR ([Asp]FR),
LR LR LR LR RR RR RR RR LR LR RR WR WR WR WR [Dha]LR, [Asp]LR
Retention time (min) FR FR FR [Dha]LR, [Asp]LR [Asp]FR [Asp]FR [Asp]FR [Asp]WR RA, [Asp]WR [Asp]WR [Dha]LR, [Asp]LR M.TY-1 M.TY-2 M.TN-4 M.TN-3 M.TN-2 M.CY-1
Table 1. Mouse toxicity assays of (a) MCYST-LR, and (b) Microcystis strains. (a) MCYST-LR
Dose (µg/kg) 200 100 50 37.5 25 12.5 LD50 (µg/kg) 95% confidence interval (µg/kg)
Mortality* 6/6 6/6 6/6 0/6 0/6 0/6 46.9 42.4 - 51.9
(b) Microcystis strains
Dose (mg dry cells/kg)
Mortality* 6.25 12.5 25 50 100 200 400 LD50 (mg/kg) 95% confidence interval (mg/kg) M.TY-1 0/3 2/3 3/3 - - - - 9.8 8.6 - 11.2 M.TY-2 - - - 0/3 3/3 - - 70.4 65.0 - 76.2 M.CY-1 - - - 0/3 2/3 3/3 - 96.5 84.0 - 110.8 M.TN-1 - - - - 0/1 0/1 0/3 >400 - M.TN-2 - - - 0/3 1/3 3/3 - 102.2 88.7 - 117.9 tis strains
Table 2. Artemia toxicity assays of (a) MCYST-LR, (b) Microcystis extracts, (c) Solid phase extraction treated Microcystis extracts. (a) MCYST-LR
Dose (µg/ml) 20 10 5 2 1 LC50 (µg/ml) 95% confidence interval (µg/ml)
Mortality* 150/150 56/122 5/99 4/98 4/88 5.68 5.17 - 6.23
(b) Microcystis extracts
Dose (mg dry cells/ml)
Mortality* 50 25 12.5 6.25 3.125 1.5625 0.7812 0.3906 LC50 (mg/ml) 95% confidence interval (mg/ml) M.TY-1 47/47 45/45 43/43 27/47 36/50 18/40 20/42 15/35 1 0.79 - 1.26 M.TY-2 42/42 40/41 36/45 25/46 15/33 16/43 10/40 11/44 2.37 1.80 - 3.11 M.CY-1 39/39 40/42 40/48 33/44 21/50 9/45 1/39 0/40 4.56 3.92 - 5.30 M.TN-1 0/42 0/38 0/43 0/44 1/41 0/40 0/44 0/42 >>50 - M.TN-2 39/39 43/43 36/44 23/46 15/50 8/42 2/39 2/41 3.24 2.78 - 3.78 M.TN-3 44/44 38/38 41/45 34/43 26/36 25/40 19/42 6/41 1.3 1.05 - 1.61 M.TN-4 39/39 41/41 45/45 36/38 36/45 23/41 26/40 29/50 0.6 0.47 - 0.78 Micr ocys tis strains M.KS-1 12/39 9/42 3/40 0/45 0/39 0/37 0/44 0/41 55.1 44.2 - 72.1 (c) Solid phase extraction treated Microcystis extracts
Dose (mg dry cells/ml)
Mortality* 40 20 10 5 2. 5 1.25 0.625 0.3125
LC50 (mg/ml) 95% confidence interval
Table 3. Toxin contents, in MCYST-LR equivalent, of various Microcystis strains converted from LD50, LC50, and IC50 in mouse toxicity
assay, Artemia toxicity assay, and protein phosphatase 1 (PP1) inhibition assay respectively.
Toxin content (mg MCYST-LR equivalent/g dry cells of Microcystis, or ppt)*
Artemia toxicity assay (from LC50) PP1 inhibition assay
Microcystis
Strains Mouse toxicity assay
(from LD50) Crude extract SPE treated from IC50 converted from % activity
M.TY-1 4.79 (1) 5.70 (2) 5.09 (1) 5.20 (1) 4.11 (1) M.TN-4 1.34 (2) 9.50 (1) 2.50 (2) 1.00 (2) 3.00 (2) M.TN-3 0.92 (3) 4.38 (3) 0.90 (4) 0.66 (3) 1.73 (4) M.TY-2 0.67 (4) 2.41 (4) 1.17 (3) 0.65 (4) 2.07 (3) M.CY-1 0.49 (5) 1.25 (6) 0.52 (6) 0.54 (5) 1.13 (5) M.TN-2 0.46 (6) 1.76 (5) 0.73 (5) 0.28 (6) 0.61 (6)
行政院國家科學委員會補助國內專家學者出席國際學術會議報告
93 年 7 月 13 日 報 告 人 姓 名周 宏 農
服務機構 及 職 稱 國立臺灣大學漁業科學研究所 教授兼所長 會 議 時間 地點 93 年 6 月 19 日至 93 年 6 月 29 日 挪威 卑爾根 本 會 核 定 補 助 文 號 臺會合字第 0930024596 號 會 議 名 稱 (中文) 第六屆有毒藍綠菌國際研討會(英文)
6th International Conference on Toxic Cyanobacteria
發表論文題目
(中文) 1. 比較不同微囊藻毒的蛋白質磷酸酵素抑制活性與及性毒性之差異 2. 微囊藻毒之蛋白質磷酸酵素抑制活性與動物毒性
(英文) 1. Comparison of protein phosphatase inhibitory activities and acute toxicity of microcystins.
2. Protein phosphatase inhibitory activities and animal toxicities of microcystins
報告內容應包括下列各項: 一、參加會議經過 二、與會心得 三、考察參觀活動(無是項活動者省略) 四、建議 五、攜回資料名稱及內容 六、其他
一、參加會議經過
第 6 屆的 ICTC 由挪威卑爾根大學 (the University of Bergen) 主辦,時間訂於 93 年 6 月 21∼27 日。與會期間有來自世界各地 35 個國家的 205 位研究人員的參與,外 加 103 個口頭報告以及 100 篇海報的發表。由於今年的第十八屆國際海藻研討會 International Seaweed Symposium 亦在卑爾根是舉行,時間為 6 月 20∼25 日,加以轉機 航班問題,故不得不提早一天出發,十九日晚上十時到達後,日光尚存,一切夜間活動 才開始。第二天下午方為有毒藍綠菌之會議的報到,早上就赴海藻研討會的開幕式與主 要演講,同時也會見些在海藻領域的國際友人,趁機看了些學術海報論文,爾後因毒藍 綠菌議程精彩緊湊,竟再也無暇參加海藻會議的學術討論。 毒藍綠菌會議於週一晚上的接待酒會前,邀請 Prof. Skulberg 作了一個藍綠菌與藍 綠菌毒研究的回顧與未來發展的報告,雖是走馬看花,但也瞭解到人類文明發展所帶來 水體優養化,造成藍綠菌的水華問題,加以化學、基因體學的發展,套用在藍綠菌毒素 與產毒機制上的研究,另一項則是如何應用所知於水華管理與保護水源,特別是飲用水 的安全。 會議時程安排緊湊,原安排在週四的單日旅遊,因發表論文太多而另安排報告討 論,讓大部分與會者仍然堅持於會場。主辦單位所安排的海報講解於午餐與晚餐時間, 除延長午、晚餐時間外,也提供簡單餐飲,而能夠整天足不出戶的留守在校園內建築的 會議廳,會議廳外為圖書館區的大廊,配備多台電腦連上網路,供與會者隨時可與家中 工作聯繫。由於週四部分與會者的觀光遊覽取消,故將週六半天的演講往前挪移至週二 至週五的討論議程中,空出週六自由活動。另外在週三、週五晚上安排了大會接峰與惜 別晚宴,享受挪威豐富的海鮮水產品。 整整四天會議的主軸包括演講或海報內容,分成八大議題,茲分別摘述如下: 議題一、一個世界觀的毒藍綠菌 Toxic Cyanobacteria -A World View
微囊藻毒是所有已知藍綠藻毒素中,對於飲用水安全危害最為嚴重的一種。其主要 的毒源生物 – 銅綠微囊藻 (Microcystis aeruginosa) 在全球各地包括美洲、亞洲、非洲、 歐洲及紐澳等地的地表水體內均十分常見,甚至形成藻華,其中中國可能為微囊藻毒危
![Fig. 4. HPLC analysis of microcystins in toxic Microcystis aeruginosa strains, M.TY-1, M.TY-2, M.CY-1, M.TN-2, M.TN-3, and M.TN-4, revealing MCYST-LR (LR), MCYST-FR (FR), MCYST-RR (RR), MCYST-WR (WR), MCYST-RA (RA), [ D -Asp 3 ]MCYST-LR ([Asp]LR), [ D -](https://thumb-ap.123doks.com/thumbv2/9libinfo/8856018.243802/48.892.116.692.122.725/analysis-microcystins-microcystis-aeruginosa-strains-revealing-mcyst-mcyst.webp)