DOI: 10.6245/JLIS.2017.432/727
應用關鍵字差異分析於立法委員選舉
得票率預測之研究
林應龍 元智大學資訊管理學系博士生 E-mail: [email protected] 禹良治 元智大學資訊管理學系副教授 E-mail: [email protected] 關鍵詞:差異分析;選舉;機械學習;自然語言處理;視覺化【摘要】
為探討臺灣立法委員選舉與網路新聞之關係及是否可使用網路新聞進行預測,我們使用2002 年1 月 1 日至 2009 年 12 月 31 日之 udn 網路新聞文本進行模型設計及訓練,以 2008 年立法委 員選舉得票率預測 2012 年立法委員選舉得票率,並將實際得票率及預測得票率進行差異分析, 觀察其相關性。而在視覺化部份,我們使用候選人詞彙差集和交集之社群網路圖呈現,快速呈現 候選人特色。由於實際得票率影響變因十分複雜,在本研究中分析結果最佳平均絕對誤差約7%、 相關係數約 0.5,預測結果雖非十分準確,但其作為其中一類網路意見,用以補充電話民調,仍 具有參考價值。本研究之主要貢獻在於應用自然語言處理及機器學習建構立法委員得票率之模型, 說明如何處理稀疏矩陣及特徵選取之問題,最後我們說明情感分析的進一步應用,期許未來能有 效從網路文本中提取有用資料以建構不同應用模型。研究目的及資料來源
自前美國總統歐巴馬利用網路社群媒體 Twitter 之網路輿情調整選舉策略並成功於 2008 年當選後,政治人物已廣泛利用網路社群媒體宣揚政策,經營政治形象,基於網路社群媒體 對於政治人物之評論會影響選舉結果的假設下,亦有以Twitter 進行情感分析並以描述統計模 型進行選舉預測之研究(Choy, 2012)。根據《We are social》的報告,2017 年亞太地區 41 億 人中有18 億人為活躍網路使用者,相較於 2016 年成長了 15%,網路作為民眾獲取資訊管道 之重要性持續增長,為研究臺灣網路社群媒體之資料是否能預測政治人物之選舉得票率,我們使用R 語言作為研究工具,以 udn 網路新聞資料(資料區間為 2002 年 1 月 1 日至 2009 年 12 月 31 日),研究是否可建立使用網路新聞文本資料預測立法委員選舉結果的模型,並探討 如何增加預測效能,及資料來源對於預測結果的影響。 在資料的選擇上,因現今臺灣的網路輿情來源眾多,包含網路新聞、社群媒體(如Facebook、 Twitter)及網路論壇(如 Mobile01、PTT)等,但考量社群媒體及網路論壇之雜訊眾多,包 含評論者進行惡意攻擊、反諷或與主題無關之評論,且可能包含圖片、符號、連結等,在資 料處理上之難度較高,反觀網路新聞多為單一作者以純文字撰寫,分析難度較低,因此在初 步挑選網路新聞進行實驗,而網路社群媒體透過轉載傳統媒體之主題較易形成趨勢(Asur, 2011),說明網路新聞雖非代表全部網路社群媒體意見,但對於網路社群媒體有一定影響,在 未來我們亦將納入各網路社群媒體進行探討。另因臺灣立法委員選舉自2008 年起立法委員改 採「單一選區兩票制」(游清鑫,2008),與過往選舉制度不同,得票率無法與 2004 年之選舉 相較,且受限於資料,因此使用2008 年立法委員得票率進行訓練,以 2012 年立法委員實際 得票率及模型預測得票率進行差異分析。
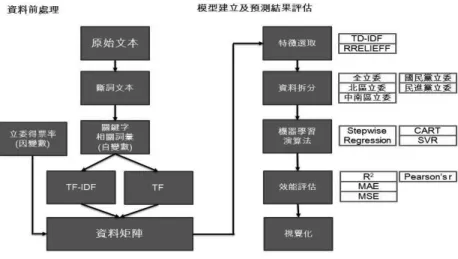
研究方法及流程
以預測真實為使用網路新聞報導進行分析,必須對文本進行自然語言處理,先將文本以 中研院中文斷詞系統(Chinese Knowledge and Information Processing, CKIP)進行斷詞,接著 使用立法委員候選人作為關鍵字進行搜尋,將前後各十個字詞擷取出來,將不同字詞在每個 立法委員候選人鄰近的計數作為模型的自變數,立法委員候選人的得票率作為模型的因變數, 建立資料矩陣以進行訓練及驗證,即探討文本經過自然語言處理後,以處理結果代表文本, 探討其對於立委得票率之多元迴歸關係,方法類似Bitvai & Cohn(2015)使用卷積神經網路 分析文本並預測真實世界的某些現象。稀疏矩陣
經過前述前處理所建立資料矩陣會是稀疏矩陣的型態,斷詞結果包含大量無意義雜訊, 一個完整的文本通常含有數字、中英夾雜的句子或難以斷詞的網路用語,當斷詞錯誤時就會 產生計數結果極少的特徵,而這些特徵對於模型而言是一種雜訊,需要進行清理及篩選,因 此我們使用停用詞(Stop Words)、特徵選取(Feature Selection)等方法對稀疏矩陣進行降維, 優點在於可減少模型訓練時所耗費之計算資源及時間,並增進特徵代表性進而改善模型預測 效能。 停用詞篩選 為增加資料代表性,減少雜訊對於模型之干擾,在自然語言處理的步驟,常會使用停用詞 清單進行過濾,所謂停用詞指的是對模型無用的詞彙,如語助詞(的、了、嗎、喔)、介詞(從、 於、與、及)等,停用詞的特性在文本中出現機率高、重複次數多但無法呈現文本間的差異。 本研究中我們人工挑選出停用詞及斷詞錯誤結果,納入停用詞清單(約1,000 個詞彙)。 特徵選取 即便我們於自然語言處理過程中已使用停用詞進行初步過濾,資料矩陣仍超過 3,000 個 特徵,在這樣高維度的資料中仍充滿許多雜訊,Chandrashekar & Sahin(2014)已說明在機器 學習的任務中並非特徵越多越好,特徵過多除了會增加運算時間亦會導致預測效能下降,因 此需要使用特徵選取方法取出重要的特徵改善前揭問題,這裡我們使用TF-IDF 及 ReliefF 等 特徵選取方法。 TF-IDF 在資訊檢索領域屬較為流行的演算法,可用於挑選重要詞彙或停用詞,觀念為調 整詞彙的權重,當文本中詞彙出現的頻率增加則重要性增加,當整個語料庫中詞彙出現的頻 率增加則重要性減少,前者稱為詞頻(Term Frequency),後者稱為逆向文件頻率(Inverse Document Frequency),在兩者相乘後即為 TF-IDF 值,TF-IDF 越大其重要性越高有,雖然當 TF 極大時,IDF 難以有效調整權重,且 IDF 高未必代表詞彙不重要等缺點,但仍有學者持續 提出TF-IDF 改善方法(Paik, 2013)。在大量特徵下進行特徵選取時,容易發生耗時過久甚至 記憶體不足等問題,而此即為TF-IDF 不可忽略的優點,簡易且計算快速,Lin et al.(2016) 亦曾利用TF-IDF 結合 cat swarm optimization(CSO)改善 particle swarm optimization(PSO)。
Relief 為特徵選取的演算法,可檢測特徵間的依賴關係,其經 Zhou & Wang(2015)實 驗後證實能改善SVM 的預測效能,因此我們挑選此演算法作為特徵選取方法之一。Relief 之 觀念在於隨機挑選一個資料後,將最近的同類型資料稱為Near Hit、不同類型資料稱為 Near Miss,權重值為加上 Near Miss 減去 Near Hit,直至所有的資料計算完成,其權重值強化資料 差異性,而ReliefF 改良 Relief,採 k-nearest 的方式減少計算次數,這裡我們使用的是 RReliefF (Regressional ReliefF),使用於迴歸模型,其概念與 ReliefF 同。
綜上,我們為了避免維度詛咒(curse of dimensionality),設計結合 TF-IDF 及 RreliefF, 利用兩者之優點將資料矩陣降到400 個特徵以下,並觀察設計不同特徵數量及特徵選取方法 組合下的模型預測效能。 資料拆分及描述統計 為探索研究使用之文本資料並解釋模型效能的結果,我們設計將資料依立法委員黨派(國 民黨、民進黨)、選舉地區(北區、中南區)拆分,討論地區、黨派是否影響模型學習及預測, 觀察拆分後資料之得票率離散程度,並進一步討論資料來源之限制及影響。 機器學習 機器學習是人工智慧的分支之一,其依據學習方法可分為監督式學習、非監督式學習及半 監督式學習,本研究使用監督式學習,將實際得票率作為因變數,文本詞彙作為自變數,以逐 步迴歸(Step-wise Regression)、分類與迴歸樹(Classification and Regression Trees, CART)及 支援向量迴歸(Support Vector Regression, SVR)等演算法建立模型,並使用 MAE(Mean Absolute Error)及 MSE(Mean Square Error)衡量實際得票率及預測得票率的差異,當 MAE 及MSE 越小時,代表預測得票率與實際得票率越相近。 差異分析 為確認預測得票率與實際得票率之相關,我們對兩者計算相關係數(Correlation)及決定 係數(Coefficient of Determination),以決定係數觀察其兩者間的線性關係,決定係數為 0 到 1 之間的值,越接近 1 則兩者間越相關,而相關係數用以觀察兩者間是正相關或負相關,相 關係數是-1 至 1 之間的值,當相關係數為 0 時,兩者不相關,相關係數越接近 1 則為正相關 程度越高,越接近-1 則負相關程度越高。在本研究中相關係數及決定係數越接近 1 代表模型 預測結果越好。 視覺化分析 最後我們將MAE 視覺化以觀察在不同特徵數量不同模型的預測結果,並探討詞彙交集、 差集的視覺化,立法委員候選人之間的詞彙交集為共同特徵,差集則為個人特徵,在視覺化 呈現下可否快速分辨出立法候選人之特色。
實驗設計
本研究訓練資料之因變數為2008 年立委候選人選舉得票率,自變數為 2002 年 1 月 1 日 累計至2008 年 1 月 12 日(2008 年立法委員選舉日)各候選人之詞彙,測試資料之因變數為 2012 立委候選人選舉得票率,因受限於可用之資料區間,自變數為 2002 年 1 月 1 日累計至 2009 年 12 月 31 日各候選人之詞彙。特徵選取設計 為測試特徵選取對於模型預測效能的影響,我們設計以不同特徵選取方法取出自變數, 為避免特徵數量過多令計算時間過長,設計篩選特徵數量至400 以下,方法如表 1 所示。 表1 特徵選取之代號與設計說明 代號 特徵選取設計 說明 t1 TF 以詞頻作為特徵選取方法,挑選出400、300、200、100、70、50、30 等七種 特徵數量 t2 TF + RReliefF 先以詞頻進行初步特徵選取,縮減至700 個特徵,再以 RReliefF 挑選出 400、 300、200、100、70、50、30 等七種特徵數量 t3 TF-IDF 以TF-IDF 作為特徵選取方法,挑選出 400、300、200、100、70、50、30 等 七種特徵數量
t4 TF-IDF + RReliefF 先以TF-IDF 進行初步特徵選取,縮減至 700 個特徵,再以 RReliefF 挑選出 400、300、200、100、70、50、30 等七種特徵數量 資料拆分設計 為觀察不同黨派、地區對於模型預測效能的影響,進行資料拆分設計,而為避免因拆分 使資料不平衡或筆數過少,資料拆分時以平衡為原則,如表2 所示。 表2 資料拆分之代號與設計說明 代號 資料拆分設計 說明 m1 全部立法委員資料 2008 年 145 筆、2012 年 134 筆 m2 北區立法委員資料 包含基隆市、台北市、新北市、桃園市、新竹縣、新竹市、苗栗縣等縣市, 2008 年 60 筆、2012 年 58 筆 m3 中、南區立法委員資料 包含臺中市、南投縣、彰化縣、雲林縣、嘉義縣、嘉義市、臺南市、高雄市、 屏東縣等縣市,2008 年 68 筆、2012 年 62 筆 m4 國民黨立法委員資料 2008 年 73 筆、2012 年 66 筆 m5 民進黨立法委員資料 2008 年 62 筆、2012 年 62 筆
研究結果與討論
在前揭流程及實驗設計說明後,我們呈現實驗的結果,除展示模型預測效能外,說明可 能的影響原因,最後我們將較佳的預測結果與實際得票率進行差異分析,解釋預測得票率與 實際得票率之相關性,探討可能影響因素及詞彙交、差集視覺化之應用。 逐步迴歸模型效能 逐步迴歸演算法會對特徵進行F 檢定,挑出顯著的特徵逐步加入迴歸模型,但其因需檢 定顯著才挑選特徵,在文本資料組成的稀疏矩陣中,單一特徵較難以達到顯著,致無法建構 模型或預測結果不如預期,在本研究的實驗設計組合中最佳MAE 約在 8.8%(詳如表 3),較 分類與迴歸樹及支援向量迴歸差。表3 逐步迴歸模型效能(取平均效能最佳前 5)
Feature
Selection Features m1 m2 m3 m4 m5 Average
t1 30 9.785639 8.879295 15.17459 10.45947 12.05064 11.26993 t3 30 9.322761 12.2583 15.08345 9.713192 10.46599 11.36874 t2 30 9.29666 10.40841 15.07143 11.20599 17.16534 12.62957 t4 30 20.54551 14.36091 10.25718 9.663144 9.0264 12.77063 t4 50 27.39741 22.70767 9.491984 11.29967 16.55809 17.49097 分類與迴歸樹模型效能 分類與迴歸樹是為決策樹的一種,其使用吉尼不純度(Gini Impurity)或資訊增益 (Information Gain)挑選特徵作為分類依據,其為非線性模型且會優先挑選有用的特徵,在本 實驗中發生乏適(Underfitting)情形,預測結果皆為某一固定立法委員得票率,造成預測結果 不準確且難以區別,實驗設計組合中最佳MAE 約在 7.5%(詳如表 4),較支援向量迴歸差。 表4 分類及迴歸樹模型效能(取平均效能最佳前 5) Feature
Selection Features m1 m2 m3 m4 m5 Average
t2 50 8.396938 8.016536 8.172071 7.903178 8.398665 8.177478 t2 30 7.554767 7.647519 7.952489 9.621651 8.256912 8.206667 t3 400 7.57558 8.289144 6.924532 8.325473 10.10066 8.243079 t3 300 7.57558 8.289144 6.924532 8.325473 10.10066 8.243079 t4 30 7.678803 7.541428 7.698267 9.188667 9.149652 8.251363 支援向量迴歸模型效能 支援向量機在自然語言處理領域中占有重要之地位,其概念係在高維空間建構一個超平 面,在分類任務中求超平面能最大化區隔不同類別及最大間隔,在迴歸任務中求超平面能最 多命中且及最小間隔,因其適用高維度空間,且能較佳處理稀疏矩陣之問題,通常模型預測 效能較佳。在本實驗中亦支持前揭論述,預測效能較逐步迴歸及分類與迴歸樹佳,在實驗設 計組合中最佳MAE 約在 6.4%(如表 5)。在觀察三種機器學習演算法對於本實驗設計的結果 後,以支援向量迴歸之預測得票率與實際得票率之誤差最小,支援向量迴歸模型於本實驗中 表現最佳,故後續將以支援向量迴歸進行討論。 表5 支援向量迴歸模型效能(取平均效能最佳前 5) Feature
Selection Features m1 m2 m3 m4 m5 Average
t3 50 7.364192 6.649438 6.816352 8.981333 8.065815 7.575426 t2 30 7.335302 6.963616 6.844172 8.893444 8.670932 7.741493 t3 400 7.057405 7.299085 6.583871 9.064854 8.735637 7.748171 t4 30 7.316163 7.162592 6.4341 8.906615 8.928733 7.749641 t3 50 7.364192 6.649438 6.816352 8.981333 8.065815 7.575426
為觀察支援向量迴歸在不同實驗設計的MAE 差異,將 SVR 模型之特徵數量作為 X 軸、 MAE 作為 Y 軸進行視覺化,因不同特徵數量及不同特徵選取方法所能解釋原始資料的程度 不一,以趨勢線可觀察其模型預測得票率與實際得票率MAE 趨勢,我們希望 MAE 越小越好, 說明預測得票率與實際得票率的誤差越小。 在不同特徵選取下觀察不同資料拆分的MAE 視覺化(如圖 1),可以觀察出 MAE 優劣 依序為m3(中、南部立委) > m1(全部立委) > m2(北部立委) > m5(民進黨立委) > m4 (國民黨立委),這部分我們認為是資料本身特性所致,如表6,使用標準差觀察資料離散程 度,當標準差較大時資料離散程度較大,因本實驗中資料筆數較少,對於迴歸模型影響較大。 圖2 支援向量迴歸預測效能視覺化-不同特徵選取設計比較 表6 支援向量迴歸模型效能(為特徵選取及資料拆分等兩種實驗設計組成之 MAE 矩陣) 種類 2008 平均 得票率(࢞ഥ) 2012 平均 得票率(࢞ഥ) 得票率絕對 誤差(|࢞ഥെ ࢞ഥ|) 2008 標準差(ો) 2012 標準差(ો) 國民黨 53.74675676 46.93586667 6.81089009 10.1777966 10.21203801 民進黨 41.28075758 46.15057143 4.86981385 7.664448291 9.600536129 北區 48.97442623 47.21446154 1.75996469 12.64597413 9.856620296 中、南區 47.50246575 47.995 0.49253425 8.616724658 8.970591702
圖3 支援向量迴歸預測效能視覺化-不同資料拆分設計比較
而在不同資料拆分下觀察不同特徵選取的 MAE 視覺化(如圖 2),t1(詞頻)、t2(詞頻 +RRelirefF)預測結果波動幅度較大,因其使用詞頻進行初步篩選,取出的特徵較難以代表資料, 而t3(TF-IDF)、t4(TF-IDF+ RRelirefF)預測結果則波動幅度較小,如單純使用 MAE 評估時 以詞頻的結果模型預測效能較佳(如表7),但其相關係數及決定係數均較低,迴歸模型預測得 票率與實際得票率相關性低,難以解釋實際情形,在加入相關係數及決定係數考量後並非最佳。
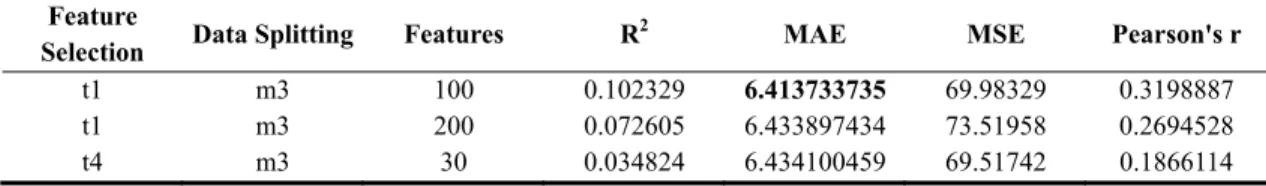
表7 支援向量迴歸模型效能以 MAE 排序前 3
Feature
Selection Data Splitting Features R
2 MAE MSE Pearson's r
t1 m3 100 0.102329 6.413733735 69.98329 0.3198887 t1 m3 200 0.072605 6.433897434 73.51958 0.2694528 t4 m3 30 0.034824 6.434100459 69.51742 0.1866114 在所有實驗結果中,相關係數t4(TF-IDF+RRelirefF)在相關係數之表現較佳(如表 8), 最高的相關係數約為0.5,且 MAE 保持在約 7%,我們認為這個特徵選取的方式較為合適, 其中又以在特徵數為200 時有最佳結果。 表8 支援向量迴歸模型效能以相關係數排序前 3 Feature
Selection Data Splitting Features R
2 MAE MSE Pearson's r
t4 m1 200 0.255237157 6.990325545 79.22051654 0.50521
t4 m1 70 0.227591229 6.963475302 82.37822171 0.4770652 t4 m1 100 0.215735267 7.130578693 83.56922901 0.4644731
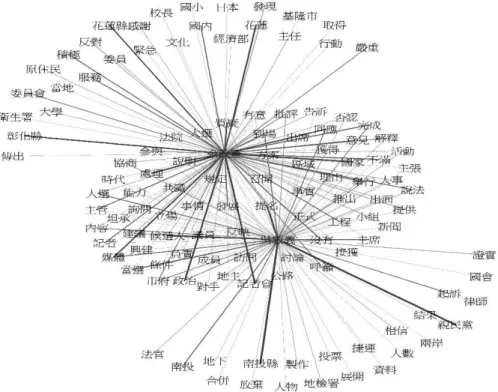
詞彙交集和差集視覺化應用 為觀察不同立法委員候選人的特色,我們使用社群網絡圖的交集和差集進行視覺化,交 集部分為兩個後選人間共同的特徵,以連結權重作為連結線條寬度及顏色的依據,權重越高 的線條寬度越高且顏色越深。 舉圖3 為例,余政憲與吳敦義同為政治人物,其在 2002 年 1 月 1 日至 2009 年 12 月 31 日的新聞詞彙中,吳敦義之差集詞彙與南投縣及親民黨有較強連結,回顧資料區間之新聞, 曾有親民黨中選會委員爆料吳敦義於2007 年有關說之嫌之政治事件;而余政憲之差集詞彙與 花蓮縣及花蓮有較強連結,同樣回顧資料區間之新聞,余政憲曾於2003 年任內政部長期間為 遏阻賄選,於花蓮縣要求警方實施24 小時路檢,遭質疑為侵犯人權之政治事件。而本例中交 集詞彙無有趣結果。 詞彙交、差集視覺化可應用於觀察不同立法委員候選人間的差異或共通,並經由詞彙重 新找回被淡忘的政治事件,供一般民眾快速了解政治人物的特色。而在社群網絡視覺化中為 能有效傳遞重要資訊,必須進行簡化(Dunne & Shneiderman, 2013),因此本文中結合前揭特 徵選取的應用,縮減特徵數量,呈現重要辭彙的差異。
資料來源及數量對於模型之影響 因在本研究中僅使用2002 年 1 月 1 日至 2009 年 12 月 31 日的 udn 網路文本,從前揭描 述中我們可得知模型對北區立委及國民黨立委有較差的預測效能,可能的影響為 2008 年及 2012 年的立委選舉結果國民黨與民進黨的得票率及標準差之差異,資料的離散程度影響模型 預測效能,另因網路新聞媒體之報導可能非完全公正(彭賢恩,2008),在有偏頗的狀況下使 用的詞彙會有差異,致預測時有高估或低估之情形發生,未來可透過多個網路新聞媒體或社 群媒體增加資料來源進行平衡,減低單一資料來源的偏誤。 結論 目前立委選舉得票率之預測主要以電話民調作為參考,而電話抽樣會因樣本涵蓋率及選 擇等問題,如抽樣的時間、地區及年齡等皆會影響結果,導致預測產生誤差(洪永泰,2006), 且電話民調成本高昂。另近來選舉結果常與預測結果產生較大的出入,部分原因可能因低估 網路族群的意見及力量,未能將網路族群的意見納入預測所致,如2014 年著名的太陽花學運 係透過網路即時號召,可見網路對於政治的影響力遽增,另2014 年縣市長選舉亦受網路族群 的評論所影響,臺北市長候選人柯文哲即透過社群媒體經營及網路行銷成功當選,故於今日 我們無法再輕忽網路族群意見,必須積極考量網路輿情帶來的影響。 網路族群的意見,除於特定平台進行網路問卷調查外,使用網路輿情分析獲取之資訊亦 可做為參考(呂建億,2015),與傳統電話民調互補以修正偏誤(俞振華,2012)。本研究使用 udn 網路新聞經過自然語言處理及機器學習建構選舉得票率之預測模型,在預測結果的表現 上平均絕對誤差約為7%,雖非十分準確,但其顯示網路族群意見探勘之可能性,未來在納入 不同資料來源後可進一步減少偏誤對模型之影響,而最後呈現分析結果部分,除了預測得票 率外,亦可透過視覺化進一步探討候選人的特色,應用詞彙交、差集之社群網絡可提供民眾 一個快速的分辨依據。未來如進一步納入情感分析(Sentiment Analysis)延伸本研究,可用 以強化模型預測效能,並針對詞彙的正、負情感、社群網絡圖中詞彙之情感標記及對於立法 委員候選人之情感正負,從網路文本中探勘出之有價值之參考。 最後本研究主要貢獻在於應用自然語言處理及機器學習建構立法委員候選人得票率之模 型,處理文本資料稀疏矩陣之問題,探討特徵選取對模型結果的影響,並以詞彙交、差集社 群網絡視覺化輔助辨別立法委員候選人特色。
參考文獻
Asur, S., Huberman, B. A., Szabo, G., & Wang, C. (2011, July). Trends in social media: Persistence and decay. In ICWSM.
Bitvai, Z., & Cohn, T. (2015). Non-Linear Text Regression with a Deep Convolutional Neural Network. In ACL (2), 180-185.
Choy, M., Cheong, M., Laik, M. N., & Shung, K. P. (2012). US presidential election 2012 prediction using census corrected Twitter model. arXiv preprint, Retrieved from arXiv:1211.0938.
Chandrashekar, G., & Sahin, F. (2014). A survey on feature selection methods. Computers & Electrical
Engineering, 40(1), 16-28.
Dunne, C., & Shneiderman, B. (2013, April). Motif simplification: improving network visualization readability with fan, connector, and clique glyphs. In Proceedings of the SIGCHI Conference on Human Factors in
Computing Systems, 3247-3256. ACM.
Lin, K. C., Zhang, K. Y., Huang, Y. H., Hung, J. C., & Yen, N. (2016). Feature selection based on an improved cat swarm optimization algorithm for big data classification. The Journal of Supercomputing, 72(8), 3210-3221. Paik, J. H. (2013, July). A novel TF-IDF weighting scheme for effective ranking. In Proceedings of the 36th
international ACM SIGIR conference on Research and development in information retrieval (pp. 343-352). ACM.
Zhou, X., & Wang, J. (2015). Feature selection for image classification based on a new ranking criterion.
Journal of Computer and Communications, 3(03), 74.
呂建億(2015)。民眾對政府輿情分析方法之信任研究-民意調查與網路輿情分析的比較(碩士論文)。 國立政治大學公共行政學系,臺北市。
【Jian-Yi Lu (2015). Citizens trust for public opinion survey methods by government - a comparative study of public opinion analysis by telephone and internet (Master’s thesis, Department of Public Administration, National Chengchi University, Taipei).】
洪永泰(2006)。調查的挑戰:瞎子摸的是什麼象?研考雙月刊,30(4),39-48。
【Yung-Tai Hung (2006). Which parts of an elephant that the blind feels: a challenge to opinion surveys in Taiwan. Yánkǎo shuāng yuèkān, 30(4), 39-48.】
俞振華(2012)。網路民意調查偏誤的評估及修正機制(科技部專題研究計畫,NSC 100-2410-H-004-114- SSS)。國立政治大學,臺北市。
【Chen-Hua Yu(2012). Exploring adjustment for web survey estimation bias. (Kējìbù zhuāntí yánjiū jìhuà, NSC 100-2410-H-004-114-SSS). National Chengchi University, Taipei.】
游清鑫(2008)。論單一選區兩票制及其對 2007 年立法委員選舉之影響(科技部專題研究計畫,NSC 95-2414-H-004-052-SSS)。國立政治大學,臺北市。
【Ching-Hsin Yu (2008). On single member district with proportional representation system and its implications to legislative elections in 2007. (Kējìbù zhuāntí yánjiū jìhuà, NSC 95-2414-H-004-052-SSS). National Chengchi University, Taipei.】
彭賢恩、張郁敏(2008)。政治置入性新聞對新聞可信度之影響,新聞學研究,95,55-110。
【Xian-En Peng, Yuhmiin Chang (2008). The influence of political product placements on news credibility. mass communication reaserch, 95, 55-110.】
A Study of Keyword Difference Analysis for
Prediction of Legislative Elections
Ying-Lung Lin
Ph. D. Student, Department of Information Management, Yuan Ze University, Taiwan (R.O.C.)
E-mail: [email protected]
Liang-Chih Yu
Associate Professor, Department of Information Management, Yuan Ze University, Taiwan (R.O.C.)
E-mail: [email protected]
Keywords: Difference Analysis; Election; Machine Learning; Natural Language Processing; Visualization
【Abstract】
The relationship between Taiwan’s national legislative election results and web‐based news is explored through multiple regression models applied to news content taken from the online version of one of Taiwan’s major daily newspapers from January 1, 2002 to December 31, 2009. The 2008 election results were used as training data, while that of 2012 was used for testing to evaluate the predictive value of online news content for election results. The best results featured an MAE of about 7% with a Pearson correlation coefficient of about 0.5. Although these results lack precision, they can still serve as a reference for online political opinion. The models are constructed using natural language processing and machine learning, and address the sparse matrix problem with feature selection. Future work will integrate sentiment analysis to improve model performance.
【Long Abstract】
Research Purpose
Since the 2008 United States presidential election, social media has emerged as a critical political tool for both campaigns and policy making. Hypothesizing that that online user comments can affect election results, Choy (2012) found that Twitter comments have predictive value for election outcomes. DOI: 10.6245/JLIS.2017.432/727
According to the report of “We are social” organization, in 2017 the Asia-Pacific area have 18 billion active network users, growing up 15% compare with 2016. It shows the importance how people get the information from networks. To test whether social media comments can predict the election support rate for politicians in Taiwan, we use R language as research tool and use news articles from the UDN web site (data period since 2002/1/1 to 2009/12/31) as raw data. The study seeks to determine whether web-based news can be used to build models to predict legislative election results, and how to improve predictive performance of such models and the impact from data.
Research Methods
Prior to analysis, web-based news content must be subjected to natural language processing, with CKIP used to segment words within each text, and isolate words within ten words before or after the names of individual legislative candidates, wherein each unique word was treated as an independent variable. We then constructed a bag of words model, use the support rate for legislative candidates as the dependent variable. This matrix can be trained and tested by multiple regression algorithms to validate the relation between legislators’ election support rate and mentions in web-based news articles.
Feature Selection
The bag of words model represents a sparse matrix which contain significant amounts of meaningless noise. The word segmentation step usually encounters words in the source text which are difficult to identify such as digits, Chinese and English mixing words or Internet buzzwords. This noisy data must be filtered using stop word and feature selection methods. Thus reducing the number of features can reduce computation resource and time requirements while improving prediction performance.
A list of approximately 1,000 stop words was identified including interjections, prepositions and uncommon words. The resulting data still included more than 3,000 features and was still excessively noisy, so we used the TF-IDF and RReliefF feature selection methods to bring the total number of features below 400.
Term frequency – Inverse document frequency (TF-IDF) is well-known algorithm used in information retrieval. The frequency with which a word appears in a single document is referred to as term frequency, and the frequency with which word appear in all documents is called document frequency. The main idea is that a higher term frequency indicates that this term is more important, but a higher document frequency higher represent that this term isn’t important, like adpositions. TF-IDF can quick statics the weight of words, but it still suffers from a shortcoming in that too high a term frequency will cause difficulty balancing the inverse term frequency. Also, inverse document frequency doesn’t completely
indicate low importance, sometimes, it filter some important terms.
RReliefF is an improvement of the Relief algorithm for regression, using k nearest neighbor to calculate the importance of the feature. Initially let the weight of the feature be zero, then pick a random instance and find the nearest instance by Euclidean distance. If the class of the nearest instance is the same as the random instance, this is called a ‘near hit’. If the class is different, it is called a ‘near miss’. The weight of the feature is updated, increasing based on a near hit’ and decreasing based on a ‘near miss’. This algorithm helps us to select features which approximate in feature space.
Machine Learning
We use machine learning algorithms to build a multiple regression model, using the election support rate as the dependent variable and the pre-processed bag of words matrix as the independent variable. A step-wise regression, is used with classification and regression trees along with a support vector regression to allow the model to learn from our data. We use the mean square error to measure the difference between actual election support rate and predicted election support rate. A mean square error is close to 0 indicates high correlation between predicted and actual results. Furthermore, we find that the correlation coefficient between the actual and predicted results forms a linear relationship. Following analysis we propose a visualization method using common terms and word complementarity to quickly identify specific legislative candidates.
Experimental Design
This study limited by our raw data, we split data from 2002/1/1 to 2008/1/12 as train set, and use all data from 2002/1/1 to 2009/12/31 as test set. Four feature selection methods were evaluated for performance. To determine whether the data characteristics affect the model, we split the data into 4 different sets according to constituency and and party affiliation.
Experiment Results
In the experiment, the step-wise regression algorithm fails to build the model because of the character of the sparse matrix. Classification and regression tree algorithms produce underfitting in training, and all predict the same value in testing. Support vector regression uses feature space to find the hyperplane with a minimum-margin of data to deal with the sparse matrix problem, and shows better performance in our study. Best prediction performance was achieved using the support vector regression with TF-IDF and RReliefF feature selection with 200 features, with an MAE of about 7% and a correlation coefficient of about 0.5. In addition, prediction performance was influenced by the election support rate based on
different constituencies and party affiliation.
About the visualization result, we regard the complement of words can distinguish legislator and raise memories of historical events. But how to approximately show the visualization results in large data? Feature engineering can be applied to select representative words.
Conclusion
We hope our study can improve the traditional telephone poll, use web news or social media comments be additional opinion source, fix the error that telephone poll doesn’t represent population, and reduce the cost of telephone poll. In recent years, the telephone poll result is decrease the accuracy of actual opinion, it’s because the younger generation tendency to use network as tool to receive and deliver information, the telephone poll usually ignore this part. In Taiwan, the Sunflower Movement use network to convene member quickly, the Taipei mayor election also impact by social media comment. It shows that, the importance of network increase as time goes on, we can’t ignore that, must consider the impact actively.
This study uses NLP and machine learning techniques to extract information from web-based articles as comments. The support vector regression model produces predictions with an MAE of about 7% and a correlation of about 0.5. While these results are not particularly robust, they provide directions for future work for text mining of online comments.