國
立
交
通
大
學
資訊科學與工程研究所
碩
士
論
文
一個雲端計算平台上針對互動式工作流程應用
的最小負載分配法之動態資源供應架構
A Framework of Dynamic Resource Provisioning Based on
Least Load Dispatching Method for Interactive Workflow
Applications on Cloud Computing Platform
研 究 生:周暉禎
指導教授:王豐堅 教授
一個雲端計算平台上針對互動式工作流程應用的
最小負載分配法之動態資源供應架構
A Framework of Dynamic Resource Provisioning Based on
Least Load Dispatching Method for Interactive Workflow Applications
on Cloud Computing Platform
研 究 生:周暉禎 Student:Hui-Zhen Zhou
指導教授:王豐堅 Advisor:Feng-Jian Wang
國 立 交 通 大 學
資 訊 科 學 與 工 程 研 究 所
碩 士 論 文
A ThesisSubmitted to Institute of Computer Science and Engineering College of Computer Science
National Chiao Tung University in partial Fulfillment of the Requirements
for the Degree of Master
in
Computer Science
September 2009
Hsinchu, Taiwan, Republic of China
I
一個雲端計算平台上針對互動式工作流程應用
的最小負載分配法之動態資源供應架構
研究生: 周暉禎 指導教授: 王豐堅 博士 國立交通大學 資訊科學與工程研究所 新竹市大學路 1001 號 碩士論文摘要
藉由雲端計算 “用多少計算資源算多少錢” 的原則,應用程式提供者有著更 實惠的計算資源消費方式。而在這樣的平台上,對於互動式工作流程的應用,尚 有確保服務品質的問題待解決,例如:計算資源分配、動態資源供應等。本篇論 文提出一互動式工作流程於雲端計算上的架構。透過模擬方式,我們為互動式工 作流程應用在請求分派上,估算各種負載評判度量,並找出最有效用且達到負載 平衡的度量為剩餘工作量(Remaining tasks)。我們也提出一用來動態供應資源 的 REM_DRP 自動控制器,以有效地及時應變動態的工作量。對於應用提供者, 實驗結果說明在最低的資源成本下,本架構在動態負載中能對請求的服務提供較 短的回應時間。 關鍵字: 互動式工作流程,雲端計算,資源分配,負載平衡,動態資源供應。II
A Framework of Dynamic Resource
Provisioning Based on Least Load Dispatching
Method for Interactive Workflow Applications
on Cloud Computing Platform
Student: Hui-Zhen Zhou Advisor: Feng-Jian Wang Institute of Computer Science and Engineering
National Chiao Tung University
1001 University Road, Hsinchu, Taiwan 300, ROC
Abstract
Cloud computing opens new opportunities for application providers because with the policy “add as needed and pay as used” they can economize the cost consumption for computing resources. In cloud environments, issues such as resource allocation and dynamic resource provisioning based on users’ Qos constraints are yet to be addressed for interactive workflow applications. In this thesis, we propose a framework for interactive workflow applications on the cloud platform. Using simulation, workload estimation for interactive workflows is investigated comprehensively, and the most effective load metric, remaining tasks, for load balancing dispatching is presented. The proposed REM_DRP, as an auto-scaling algorithm to automate resource provisioning, provides an in-time reaction to dynamic workloads. Experimental results show that this framework offers application providers better maintenance of QoS-satisfied response time under time-varying workload, at the minimum cost of resource usage.
Keywords: Interactive Workflow, Cloud Computing, Resource Allocation, Load Balancing, Dynamic Resource Provisioning.
III
誌謝
本篇論文得以完成首先要感謝的是我的指導教授王豐堅博士,在兩年的期間 的傳道授業解惑讓我在軟體工程技術、工作流程技術、格網計算,以及對於雲端 計算領域能夠深入瞭解,並且獲得許多豐富的知識和經驗。另外,也非常感謝口 試委員鍾葉青博士、張西亞博士及黃國展博士的寶貴意見,補足我論文的不足之 處。 其次,本篇論文要特別感謝博士班的靜慧學姊、懷中學長給予許多指導與建 議,並且讓我在遇到許多瓶頸時能夠幫助我突破難關,不管是專業上的建議、研 究的技巧和文章的撰寫,都非常感謝學姊學長不斷的指教,得以順利完成論文。 最後,感謝這段期間家人給予我不虞匱乏的念書環境,並且支持我專心的念 書與研究。除此之外,也要感謝好朋友沛君、淯琪、伯昇、正乾、瑞燾的鼓勵, 以及實驗夥伴志強、尚昱、士維、培書的勉勵,也特別謝謝口試時給我祈禱打氣 的人。由於大家的一路陪伴才得以順利渡過這段研究生的歲月。IV
Table of Contents
1 Introduction ………...1 2 Related Work………..…4 2.1 Related Work……….4 2.2 GridSim Toolkit……….7 2.3 QuID………..93 A scalable computing framework for Interactive Workflow Applications on the Cloud……….11
4 Least Load Dispatching for Workload Balancing……….18
4.1 Load Metrics…..………..18
4.2 Simulation Environment………..20
4.3 Simulation Setup………..24
4.4 Performance Evaluation………...27
5 Dynamic Resource Provisioning………...32
5.1 REM_DRP Algorithm………...…..32
5.2 Simulation Setup………..34
5.3 Performance Evaluation………...36
6 Conclusions and Future Work………...41
V
List of Figures
Figure 1: Cloud computing environment ………..2
Figure 2.1: Architecture of a 3-tier internet application [12] ………7
Figure 2.2: Simulation environment ……….7
Figure 2.3: A flow diagram in GridSim based simulations [33] ………..8
Figure 2.4: Entity communication model via the Input and Output entities [33] …….9
Figure 3.1: The diagram of the framework ……….12
Figure 3.2: An example of multiple workflow instances running on a resource …....15
Figure 3.3: Cooperation among the Resource Allocator, the Resource Manager, and the DRP Manager……….15
Figure 4.1: Workload parameters upon resource execution ………18
Figure 4.2: Average response time for each load metric ……….27
Figure 4.3: Stability and degree of load balancing for each load metric ………27
Figure 4.4: Average response time for each load metric ……….28
Figure 4.5: Stability and degree of load balancing for each load metric ………28
Figure 4.6: Different scales of measurement interval for the response time metric ...30
Figure 4.7: Performance gained from the policy “don’t always dispatch requests to the least loaded resource.” ………31
Figure 5.1: illustration of dynamic workloads………...33
Figure 5.2: REM_DRP in experiment 1, 16 resources available ………...….39
Figure 5.3: QuID in experiment 1, 16 resources available ………..39
Figure 5.4: REM_DRP in experiment 2, 50 resources available ………40
VI
List of Tables
Table 4.1: Simulation entities ………22 Table 4.2: Simulation parameters ………..23 Table 4.3: Workflow model ………...24 Table 4.4: Simulation setup in homogeneous and heterogeneous environment ……25 Table 5.1: Simulation parameters ………..35 Table 5.2: Parameters of REM_DRP and QuID……….35 Table 5.3: Performance of different utilization rate measurement intervals ………..36 Table 5.4: Performance of different utilizations ……….36 Table 5.5: Simulation results………...38
1
Chapter 1 Introduction
Cloud computing [20] has become the most-mentioned computing environment
and some cloud computing service providers have began to provide commercial
services, such as Amazon’s EC2 [22], where users are charged according to the
amount of computing resources they actually use. With the power and flexibility of
cloud computing, companies around the world may realize their objectives effectively,
especially in both technical and economic aspects.
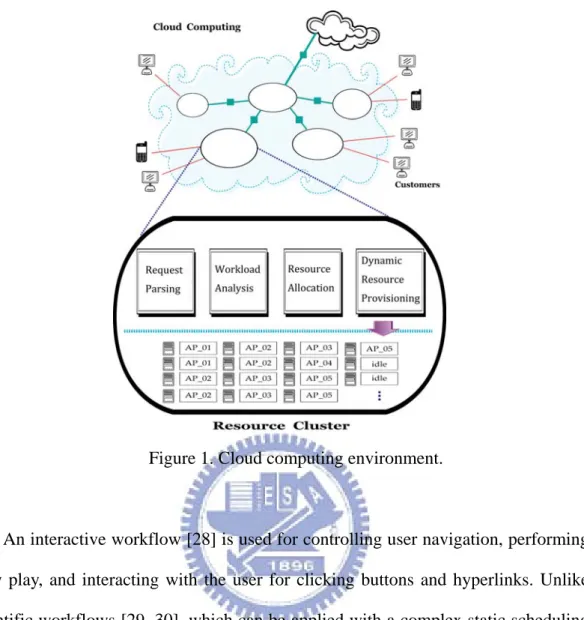
Figure 1 illustrates a possible cloud computing scenario where the cloud consists
of multiple clusters located at different places worldwide for providing different users
with resources near them. Users need rent, instead of buying the computing resources.
Applications are plugged into the cloud and acquire computing services as they want
without knowing where the resources are located. Users pay for resources they
actually use without any huge hardware/software investment in advance. The cloud
computing service providers make the profits by providing high-quality services
through efficiently allocating the resources on demand. In this thesis, we present a
framework handling the execution of interactive workflow applications on a cloud
2
Figure 1. Cloud computing environment.
An interactive workflow [28] is used for controlling user navigation, performing
view play, and interacting with the user for clicking buttons and hyperlinks. Unlike
scientific workflows [29, 30], which can be applied with a complex static scheduling
to minimize the makespan [31, 32], interactive workflows are involved with human
interactions and mainly consider the factors such as response time, stability and
security, etc. Thus, the computational behaviors in interactive workflows are more
similar to those in web-based applications than those in scientific workflows.
In such a scenario, application developers are asked to accomplish two goals
simultaneously: minimized user response time and minimized resource usage cost.
The activities to accomplish both goals maybe conflict. For example, user response
3
reduced by using fewer resources. Since the workload of an application service
usually varies with time, a dynamic resource provisioning mechanism may help to
achieve the goal instead. To deal with the issue, this thesis proposes a dynamic
resource provisioning manager REM_DRP ( REMaining tasks based Dynamic
Resource Provisioning ) . REM_DRP provides scalable processing power with
dynamic resource provisioning mechanisms, where the number of servers used is
dynamically adapted to the time-varying incoming request workload. To evaluate our
framework and mechanisms, we applied GridSim [24] to simulate the cloud
environment. In the simulation, the workload estimation for interactive workflows is
investigated comprehensively. To evaluate the performance of REM_DRP, we
compare it with the QuID [4], is a dynamic resource provisioning approach proposed
recently.
The remainder of the thesis is organized as follows. Chapter 2 presents literature
survey related to our work. Chapter 3 describes our scalable framework for interactive
workflow applications on the cloud. Chapter 4 presents dispatching methods for
workload balancing, our simulation environment, and experimental results. Chapter 5
presents our dynamic resource provisioning algorithm and its performance evaluation.
4
Chapter 2 Related Work
2.1 Related work
The appearance of cloud computing revolutionizes how organizations operate
and people work. However, new challenges are introduced while companies benefit
from the planning flexibility in technical and economic aspects. Harold et al. [20]
address some challenges and opportunities of automated control in cloud computing.
In accordance with the cloud computing context, they present a proportional
thresholding mechanism to enhance stability for feedback controllers. In utility
computing, a similar feedback control policy for adaptive resource provisioning is
discussed in [21]. They both dynamically adjust the resource shares in individual tiers
in order to meet the QoS requirement for multi-tier web applications, whereas our
approach aims for interactive workflow applications.
Cloud computing is an emerging platform for distributed and parallel processing.
In general, job scheduling in a parallel or distributed system may entail two parts of
work. The first part of work mainly determines the execution sequence for the jobs
waiting in the queue. The second part chooses an appropriate resource for allocating
the job selected by the first part of work, therefore sometimes is called resource
allocation. Job scheduling in parallel or distributed systems is a well-known
NP-complete problem [26]. So, many heuristics-based [1, 16] or AI-based [5]
algorithms have been proposed and most of them require meticulous system
monitoring to get workload information for calculations. The objectives of resource
5
QoS targets or to maximize the throughput in a fixed-number resource cluster. Many
studies for resource allocation have been presented recently [2-13].
Our work on request dispatching is related to several previous research efforts on
optimizing resources utilization and load balancing for an application. Kaushik et al
[3] devise an approach called ReDAL(Request Distribution for the Application Layer)
for distributing requests across a cluster of web application servers. In their approach,
a running resource is characterized lightly-loaded or heavily-loaded state. To balance
the load among resources, ReDAL augment the traditional session-affinity based
schemes [25] with techniques such as load measurement for state monitoring, least
loaded dispatching for requests, and a capacity reservation scheme for the near-future
expected load. Lior et al. [6] present a proportional share scheduler for fair resource
allocation of homogeneous nodes in a cluster. It maintains fair resource allocation
dynamically by preemptive process migration. Under SOA, BangYu et al. [7] propose
a dynamic resource allocation scheme for workflow-based composite services.
Through estimating the future workload of each service and the given service
transition probabilities(TPC-W [23]), they use performance matrixes to maximize the number of requests completed under limited resources.
To enable load management across resource clusters, Marcos and Buyya [9]
propose a cost-aware resource exchange mechanism. The mechanism takes into
account the economic compensation of resource providers and considers the cost for
one Grid to acquire computational resources from another. By using request
redirection across Grids and the ‘submit to the least loaded resource’ policy at the
6
among all the resources. The work in [10] develops a heuristic-based switching
algorithm to allocate the resources in different server pools to applications
dynamically. Several examples of switching policies are proposed in [18, 19]. Their
policies focus on workload balancing among limited clusters while ours concentrate
on how to dynamically provision an adequate amount of resources to an application at
runtime.
In the context of the dynamic resource provisioning, S. Ranjan et al. [13]
introduce three mechanisms for web clusters. The first mechanism, QuID [4],
optimizes the performance within a cluster by dynamically allocating servers
on-demand. The second, WARD [8], is a request redirection mechanism across the
clusters. The third one is a cluster decision algorithm that selects QuID or WARD
under different workload conditions. For multi-tier internet applications, Bhuvan et al.
[12] propose a provisioning technique which employs two methods that operate at two
different time scales: predictive provisioning at the time-scale of hours or days, and
reactive provisioning at time scales of minutes to respond to a peak load. As shown in
Figure 2.1 [12], they model a multi-tier application as a network of queues where each
queue at a tier represents a server, and the queues from a tier feed into the next tier.
Given the request arrival rate and per-tier response time, the number of servers needed
at each tier is computed individually by the proposed algorithm. While the above
techniques are aimed for multi-tier web applications, our work in this thesis targets at
7
Figure 2.1. Architecture of a 3-tier internet application. [12]
2.2 GridSim toolkit
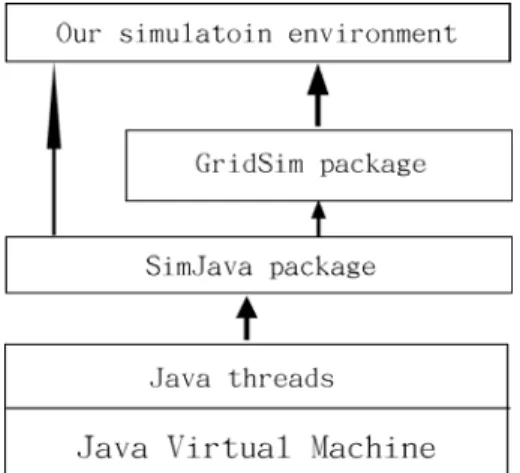
In this section, we briefly introduce the GridSim toolkit. We use GridSim [24] as
the simulation environment for conducting the experiments in this thesis. GridSim is
a discrete event simulator built on top of the simulation package SimJava [27] and can
be used to model and simulate various entities in parallel and distributed computing
environments. The Simjava package provides the basic discrete event simulation
infrastructure for the entire simulation environment. GridSim controls all the entities,
delivers the events, and advances the simulation time. As Figure 2.2 shows, our
simulation environment is constructed by instantiating entities which are the instances
of classes extended from the classes in GridSim API and SimJava API.
8
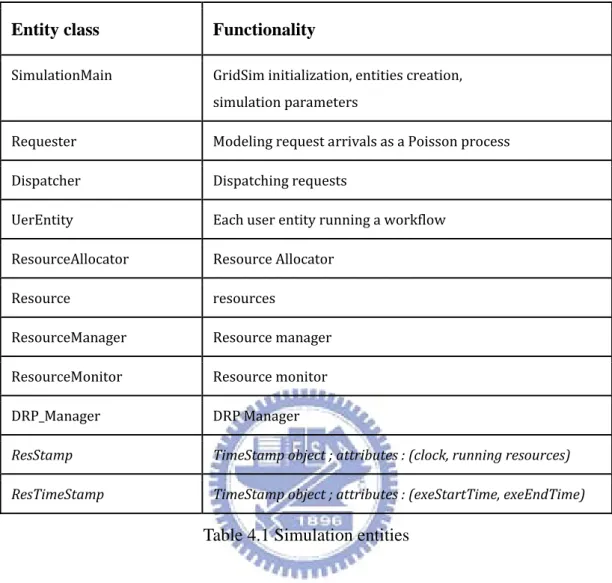
Our simulation entity classes are listed in Table 4.1. Each entity in the simulation
environment is running in its own thread, executing the body() method that handles
events. Once an entity is created, its Input and Output entities are created
automatically by GridSim. As shown in Figure 2.2 [33], six entities are connected
together via their Input and Output entities, and can communicate with each other by
sending and receiving event objects.
Fig. 2.3. A flow diagram in GridSim based simulations. [33]
Figure 2.4 [33] describes the flow of information transmitted between entities via
their Input and Output entities. Entity A sends an event or data objects to entity B via
the send() method. The parameters of send() specify the information such as the
originator, event type, the destination, the transmitted data, etc. The delivery of the
data object will be handled by GridSim. A central object Sim_system of SimJava
maintains a timestamp ordered queue of future events. It pops events off the queue,
advances the simulation time accordingly. Finally, entity B receives this object by the
9
Fig. 2.4. Entity communication model via the Input and Output entities. [33]
2.3 QuID
In this section, we briefly introduce QuID in [4].
Given parameters as follows:
z N, current number of servers
z X, the number of task completions in the previous measurement interval
z A, the number of task arrivals in the previous measurement interval
z U, U =(U1+U2+U3+ +... UN) /N, where U is the utilization rate of resource i i
z α, the target utilization rate
In QuID, the required number of resources for the next interval, N’, is defined based
on the following equations.
/
D U X= (2.1)
' max( , ) *
10
' * '/
N = ⎡⎢N U α⎤⎥ (2.3)
QuID is a utilization-targeted algorithm. It first computes the average utilization
demand per completion with (2.1). Secondly, the normalized utilization for the next
interval is obtained by (2.2). Finally, it computes the upper bound on the number of
resources needed to achieve the target utilizationαby (2.3). IfN'> , QuID initiates N
11
Chapter 3 A scalable computing framework for Interactive
Workflow Applications on the Cloud
This chapter presents a scalable framework for interactive workflow applications
on the cloud computing platform. The framework deals with the scenario that an
interactive workflow application, hosted on a cloud computing platform, runs many
workflow instances simultaneously according to the incoming user requests. Since the
amount of incoming requests changes with time and the cloud platform is a
pay-per-use service, the application has to dynamically manage the resources it uses
to maintain acceptable response time and reduce the total cost of resource
consumption under various workloads.
In the framework, each resource, representing a distinct computing server, is
capable of processing multiple interactive workflow requests. Prior to ready for
service, the required data and workflow definitions have to be deployed to the
resources in some way, e.g. the Amazon machine image(AMI)of Amazon EC2 [22].
An AMI, to be dynamically deployed in the Amazon Elastic Compute Cloud, is a
pre-built package of software containing applications, libraries, data and associated
configuration settings.
To efficiently utilize resources, there are two key issues considered in the
framework. The first is finding the least loaded resource for dispatching incoming
requests. The second issue deals with dynamic resource provisioning(DRP)for
adaptively handling dynamic workloads. With resource state monitoring, each
12
load dispatching algorithm [2] is more effective than algorithms without the feedback
loop which are easier to implement using only the information in the client requests.
The idea of least load dispatching is a greedy approach that assumes the least loaded
resource becomes idle first and thus produces the shortest request response. Therefore,
the effectiveness of least load dispatching largely depends on how to accurately
capture the computing load on each resource. To find the most effective load metric,
several candidate load metrics are proposed and evaluated with simulation studies,
which will be presented in chapter 4. Our strategy for dynamic resource provisioning
is presented in chapter 5. The policy will be compared with the one in [4]. In the
dynamic resource provisioning strategy, the most effective load metric evaluated for
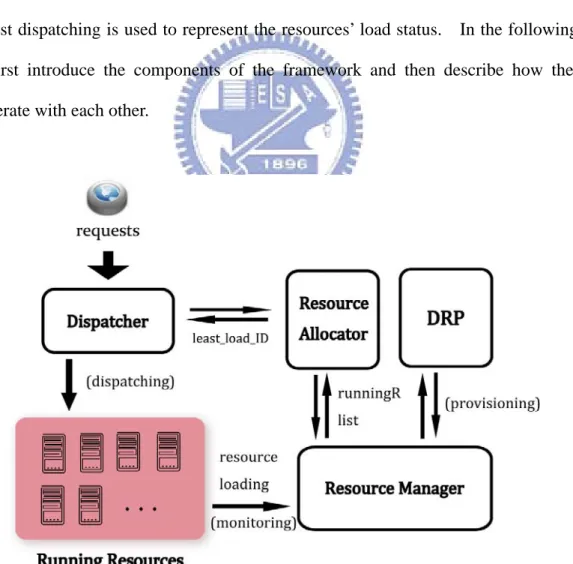
request dispatching is used to represent the resources’ load status. In the following,
we first introduce the components of the framework and then describe how they
cooperate with each other.
13
Fig.XXX shows an overview of the framework in handling user requests for an
interactive workflow application running on a resource cloud. The architecture
consists of four main components Dispatcher, Resource Allocator, Dynamic Resource
Provisioning Manager(DRP), and Resource Manager. The major capabilities of each
component are listed as bellow:
Dispatcher
z Receiving requests of workflow enactment.
z Fetching the ID of the least loaded resource from the Resource
Allocator.
z Initiating an instance of the corresponding workflow definition on the least loaded resource according to the request.
z Dispatching each workflow enactment request to the least loaded resource.
Resource Allocator
z Retrieving the running resources list and their latest load information from the Resource Manager.
z Finding the least loaded resource according to the load information among running resources.
z Informing the Dispatcher the least loaded resource ID. Dynamic Resource Provisioning Manager
z Retrieving the running resources list and their latest load information from the Resource Manager.
z Based on REM_DRP, determining Rnext , the number of running resources for the next time interval.
14
z Initiating a resource provisioning request to the Resource Manager whenRnext is not equal to the current number of running resources. Resource Manager
z Monitoring the state of the resource pool: running resources, suspended resources, idle resources.
z Adding or releasing running resources when receiving a resource provisioning request.
When a user sends a workflow enactment request to the system, Dispatcher
serves as the front-end guard of the entire system. According to the request,
Dispatcher initializes and puts a workflow instance on the resource with the least load,
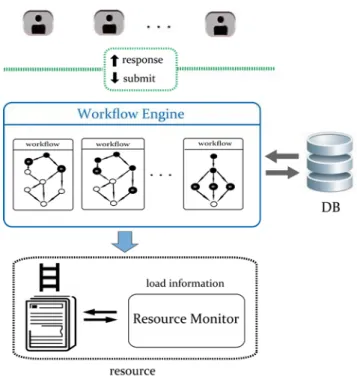
returned by Resource Allocator. Consequently, as shown in Fig.3.2, when the user
interacts with a workflow instance, corresponding events are triggered during user
navigation, and designated tasks in the workflow are submitted to the workflow
engine on the resource for execution. During interaction, the workflow instance
responds the execution results to the user and stores the results into the database. We
apply a session affinity based scheme, that all subsequent requests at a workflow are
handled by the same application server. Tasks on a resource are executed in a
15
Fig. 3.2. An example of multiple workflow instances running on a resource.
Fig. 3.3 depicts how Resource Manager interacts with the Resource Allocator
and the DRP.
Fig. 3.3. Cooperation among the Resource Allocator, the Resource Manager, and
16
Resource Manager is an entity similar to the Grid Information Service(GIS)
which is responsible for grid resource registration and services discovery in a typical
grid environment [34]. As shown in Fig.3.2, Resource Monitor on each resource is
responsible for monitoring and recording the resource’s load status. Resource
Manager combines all state monitors to monitor the state of each resource, and stores
load metrics such as tasks waiting queue length, response time, arrival rate, task queue
waiting time, resource utilization, etc. Based on the load information, Resource
Allocator can identify the least loaded resource and passes the ID of that resource to
Dispatcher. Additionally, the Resource Manager also complies with the decision made
by the DRP. For each schedule interval, the DRP fetches the load information from
the Resource Manager, diagnoses the state of running resources, and initiates requests
to the Resource Manager to acquire or release resources whenever needed.
In the resource pool, all the resources are classified into three groups according
to their status: running, suspended, idling. In the running group, the resources can
accept new workflow enactment requests. When making a dispatching decision,
Resource Allocator considers the load information of running resources only. The
number of running resources is determined by the DRP. If DRP asks Resource
Manager to release resources, Resource Manager shifts designated running resources
into the suspended group in a last-in-first-out order. Resources in the suspended group
take no more workflow enactment requests while serving the existing workflow
instances. They are shifted into the idle group after all its workflow instances are done.
On the contrary, when more resources are needed, Resource Manager can select
resources from either the suspended group or idle group. The difference between the
17
get ready as running resources, while the suspended resources needn't. A resource
preparing time is typically the time to initialize the workflow engine or for booting the
operating system [13]. Therefore, Resource Manager first reinstates resources from
the suspended group since they can be used immediately. If no resources are available
in the suspended group, Resource Manager has to wait the selected idle resources for
18
Chapter 4 Least Load Dispatching for Workload Balancing
For interactive workflows, which are stateful session-based applications, the
observed response time is the major concern to the served clients. To ensure that
stable and acceptable response times are continuously met, the policy must be fair
enough, e.g., the workload is load-balanced among the available resources. However,
resource allocation for interactive workflows is different from that for scientific
workflows which can be applied with a complex static mapping. Moreover, the load
metric of resources is hard to evaluate. So, to comprehensively explore the workload
of each resource upon dispatching, several candidate load metrics are proposed and
compared. Our approach for workload balancing is based on the least loaded policy
which is state-aware and assumes to use no dedicated resources. The last condition
indicates that our approach is resource-blind and suitable in a heterogeneous
environment.
4.1 Load Metrics
19
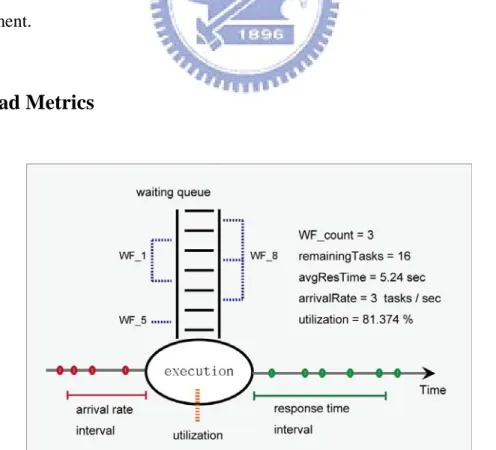
Fig. 4.1 shows the workload parameters of a resource when users’ workflows are
executed concurrently. Each workload parameter is defined as follows:
1)Arrival rate
The arrival rate of a resource is the number of new tasks arriving at the
resource’s waiting queue within a time-interval. If the arrival rate increases, the
queue length increases based on queueing theory so does the response time of a
task.
2)Average response time
Let rij be the response time that the task j of workflow i executed on
resource R within a time-interval monitored. Then the average response time of R
can be obtained by average r
( )
ij , where rij is the sum of (1) transmission time ofthe request to the resource, (2) waiting time for the instantiated task in the waiting
queue of R, (3) processing time of the task at resource R, and (4) transmission time
of the result back to the user.
3)Remaining tasks
A task in an interactive workflow is executed only when all its preceding tasks
for the input condition complete and the instantiation event is triggered. The
number of remaining tasks of a resource can be defined as all unexecuted tasks for
workflows served. Since the information of task number of a workflow can be
retrieved from a workflow repository, we might use the number of remaining tasks
20 4)WF counts
The number of workflows served at a resource.
5)Utilization rate
The utilization rate of a resource can be defined as the percentage of the time
spent for tasks execution within a time-interval. Unlike the above metrics,
utilization rate has a limited applicable range. It is an effective load metric only
when its value is below 100%. On heavily loaded systems, the utilization rate is at
most 100%, therefore it can not effectively distinguish different load levels further.
Utilization rate is thus excluded in the following experimental comparisons.
4.2 Simulation environment
The details of GridSim toolkit are introduced in Chapter 2. In the following we
briefly introduce the entities for the simulations in this thesis and describe how they
operate. The major entities in our simulation environment are listed in Table. 4.1. The
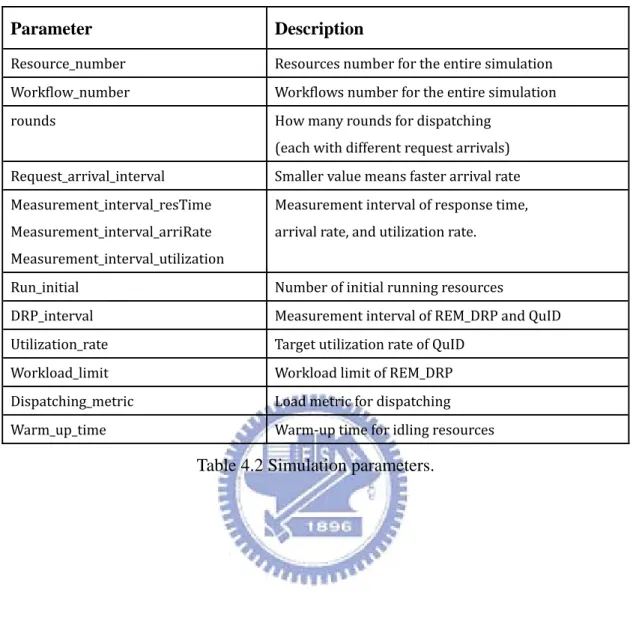
parameters for configuring a simulation case, as listed in Table 4.2, are set in the
SimulationMain class. When the simulation environment extended from GridSim
package is initiated, all entities and their corresponding Input and Output entities are
instantiated. Whenever an entity is instantiated, it waits for events and takes
appropriate actions according to the event type.
The Requester entity issues events to Dispatcher entity to simulate incoming
21
with rate X, which is a configurable parameter in our simulation environment. When
Dispatcher entity receives the event, it retrieves the ID of the least leaded resource
from ResourceAllocator entity and dispatches a UserEntity to the resource for running
a randomly generated workflow. Each UserEntity corresponds to a workflow
execution. A UserEntity suspends itself to simulate a user thinking time between
contiguous tasks in the workflow. A UserEntity submits a task to the resource only
when all its preceding tasks have finished execution. The memory used by a
UserEntity is released when all tasks in the workflow are completed.
For each resource, ResourceManager entity specifies a corresponding
ResourceMonitor entity to record the execution information for each task, such as
submission time, waiting time, execution start time, finish time, etc.
ResourceManager entity maintains three resource lists: running list, suspended list,
idling list. Each list is a linked list containing resource ID’s. ResourceManager entity
manipulates the lists according to the provisioning requests from DRP_Manager entity.
ResourceAllocator entity retrieves load information about each resource from
ResourceManager entity to find the least loaded resource for request dispatching.
DRP_Manager, with the help of ResourceManager, periodically diagnoses the total
load of all running resources for decision making on dynamic resource adjustment.
The simulation continues until no more events are generated and all generated events
have been processed. After the simulation finishes, the simulation report is stored in
22
Entity class Functionality
SimulationMain GridSim initialization, entities creation, simulation parameters Requester Modeling request arrivals as a Poisson process Dispatcher Dispatching requests UerEntity Each user entity running a workflow ResourceAllocator Resource Allocator Resource resources ResourceManager Resource manager ResourceMonitor Resource monitor DRP_Manager DRP Manager ResStamp TimeStamp object ; attributes : (clock, running resources) ResTimeStamp TimeStamp object ; attributes : (exeStartTime, exeEndTime)
23 Parameter Description Resource_number Resources number for the entire simulation Workflow_number Workflows number for the entire simulation rounds How many rounds for dispatching (each with different request arrivals) Request_arrival_interval Smaller value means faster arrival rate Measurement_interval_resTime Measurement_interval_arriRate Measurement_interval_utilization Measurement interval of response time, arrival rate, and utilization rate. Run_initial Number of initial running resources DRP_interval Measurement interval of REM_DRP and QuID Utilization_rate Target utilization rate of QuID Workload_limit Workload limit of REM_DRP Dispatching_metric Load metric for dispatching Warm_up_time Warm‐up time for idling resources
24
Workflow tasks are modeled as Gridlet objects and executed on GridSim
resources. A Gridlet object contains all the information related to a task and the
execution details such as the task length, the size of input and output files, the task
originator, etc. Task execution time and user thinking time are generated from the
negative exponential distributions with the mean values of 3 seconds and 7 seconds
respectively based on the TPC benchmark [23]. The Transaction Processing
Performance Council (TPC) defines transaction processing and database benchmarks
and delivers trusted results to the industry. TPC-W is a benchmark for Web
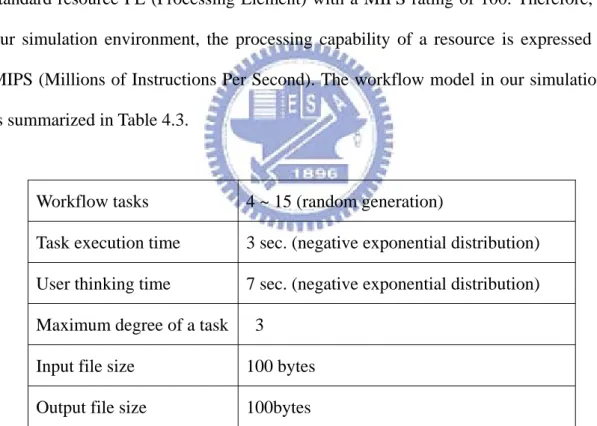
applications. The task length is expressed in terms of the time it takes to run on a
standard resource PE (Processing Element) with a MIPS rating of 100. Therefore, in
our simulation environment, the processing capability of a resource is expressed in
MIPS (Millions of Instructions Per Second). The workflow model in our simulations
is summarized in Table 4.3.
Workflow tasks 4 ~ 15 (random generation)
Task execution time 3 sec. (negative exponential distribution)
User thinking time 7 sec. (negative exponential distribution)
Maximum degree of a task 3
Input file size 100 bytes
Output file size 100bytes
Table 4.3 Workflow model.
4.3 Simulation Setup
25
the results. The parameters used to configure the simulation environment are listed in
Table 4.4. We model request arrivals at the resource cluster with a Poisson distribution
of rate 2.2 and 2.0 in the homogeneous and the heterogeneous environments
respectively. The task execution time and user thinking time are generated according
to the TPC-W benchmark for Web workloads. In all our simulations, the measurement
interval for obtaining the request arrivals and the average response time are listed in
Table 4.4. In the heterogeneous environment, there are six 100-MIPS resources, six
200-MIPS resources, and four 400-MIPS resources. The resource cluster is
inter-connected by 100Mbps. The measurement intervals of arrival rate and response
time are decided by running a series of simulations of 900 workflows using various
arrival rate and response time measurement intervals. The values in Table 4.4 deliver
the shortest average response time in the simulations. We also include random
selection and the Round-Robin load balancing algorithm in the experiments for
performance comparison.
Homogeneous Heterogeneous
Request arrival interval 2.2 (Poisson distribution) 2.0 (Poisson distribution) Task execution time 3 sec. (negative exponential distribution) 3sec. (negative exponential distribution) User thinking time 7 sec. (negative exponential distribution) 7 sec. (negative exponential distribution) Arrival rate measurement interval 35 sec. 60 sec. Response time measurement interval 15 sec. 15 sec. computing speed 100 MIPS * 16 100 MIPS * 6, 200 MIPS * 6, 400 MIPS * 4.
26
To evaluate the effectiveness of each load metric, we define two performance
metrics: the degree of load balancing and stability. Both of them are mainly calculated
based on the task response times through the entire simulation.
Let
z avg() be the mean of a set of numbers.
z dev() be the standard deviation of a set of numbers.
z Rij denote the average response time of resource i between time j−5and j . (The value of the average response time is calculated every 5 second through the entire simulation.)
z dj =dev R( ij), for all running resources at time j.
j
d denotes the degree of load balancing among resources at time j.
Thus, the degree of load balancing and stability of the entire simulation can be
obtained by the following equations. Since they are mainly calculated based on the
standard derivation of response times, smaller value indicates better performance.
The degree of load balancing = avg(dj | j = 5, 10, 15 …end of simulation).
27
4.4 Performance Evaluation
Homogeneous environment
Figure 4.2 Average response time for each load metric.
Heterogen Figure 4 neous envir Figure 4.4 4.5 Stabili ronment Average r
ity and degr
28 response tim ree of load b me for each balancing fo load metric
for each load c.
29
Simulation results, depicted in Fig. 4.2~4.5, show that Round-Robin does not
perform well, especially in the heterogeneous environment. The following discusses
the performance of other metrics.
Arrival rate and response time are the most frequently used load metrics in web
applications. The former performs better than the latter in the homogeneous
environment while the result is contrary in the heterogeneous environment. The two
metrics are based on information collected in the past. Sometimes, past information
cannot accurately predict the future workload. Moreover, as shown in Figure 4.6,
these time-interval based metrics have a potential problem that it’s hard to find a
perfect interval for collecting an appropriate amount of load information. Once an
interval is decided, any load variation outside the interval is ignored.
Obviously, the remaining tasks metric outperforms the others and is a good
indicator of possible further workload for interactive workflow applications in both
homogeneous and heterogeneous environments. The remaining tasks metric not only
gives a more detailed load information than the WF counts do but also seizes the
counteraction between request arrivals and completed tasks. Our simulation can
conclude that a desirable basis for determining load might be the number of
30
31
For least load dispatching, all arriving requests will be sent to the same least
loaded resource between two workload updates. This may overload the resource and
lead to poor performance. To alleviate the potential problem, we modify the least load
dispatching as follows. Upon request dispatching, if the least loaded resource is the
same as the one in the preceding dispatching, the system dispatches the request to the
secondly least loaded resource instead. Figure 4.7 shows that the modified least load
dispatching outperforms the original one.
Fig. 4.7 Performance gained from the policy “don’t always dispatch requests to the
32
Chapter 5 Dynamic Resource Provisioning
In traditional server hosting environments, each application is equipped with a
fixed amount of resources. Since the amount of incoming requests usually changes
with time, the request response time may be poor. Today, cloud computing allows
customer applications to be deployed efficiently and economically: add as needed and
pay as used. The applications running on the cloud computing platform have to
dynamically adjust the amount of resources for use in order to achieve acceptable
performance at the minimum costs. QuID [4] is recently proposed as such a dynamic
resource provisioning (DRP) approach. In this chapter, we propose an auto-scaling
algorithm denoted as REM_DRP (REMaining tasks based DRP) to dynamically
provide an adequate amount of resources to an application. In the following, we
introduce the idea behind our approach. Performance evaluations are presented in
section 5.3.
5.1 REM_DRP Algorithm
REM_DRP is assumed to work on a homogeneous cloud platform which
contains all resources at the same speed. To maintain acceptable response time, in
REM_DRP, each resource is configured with a workload limit Rw and a threshold
value for the entire system is Rw*|R|, where |R| is the number of running resources.
The workload limit on each resource is based on the load metric of remaining tasks
described in Chapter 4. When the total system workload exceeds the threshold value,
the system would deploy additional resources to share the workload. On the other
33
some resources to reduce the costs of resource usage. We also define equation 5.1 and
5.2 to compute the number of resource(s) to be added or removed in each decision
respectively, where T is the workload limit on each resource represented by the
number of tasks. ( ) / more R =⎡⎢ RemainingTasks Threshold− T ⎤⎥ (5.1) ( ) / less R =⎢⎣ Threshold−RemainingTasks T⎥⎦ (5.2)
Figure 5.1 illustration of dynamic workloads
Figure 5.1 is an example to describe how REM_DRP work. We mark three
different conditions of workload in Figure 5.1. Zones A and B are examples whose
number of remaining tasks of the running resources exceed the implicit threshold,
while zone C is the contrary. In REM_DRP, the system is asked to add resources in
Zone A if the arrivals exceed the completions but not in zone B since the workload is
declining. Zone C characterizes that the running resources are underutilized and the
unnecessary resources are removed regardless of the number of arrivals or
completions. A decision making algorithm in REM_DRP is defined as follows to
34 Decision Making Algorithm
Input: |R|=current number of running resources;
|rem|: remaining tasks of all running resources;
|ari| = the number of task arrivals for all resources in the previous measurement interval; |done| = the number of completed tasks for all resources in the previous measurement interval; T = workload limit on each resource (number of tasks).
Output : |R’|: the required number of resources for the next interval
1 if |rem| > ( |R| * T)
2 if |done| < |ari|
3 get Rmore by equation (5.1) 4 |R’| = |R| + Rmore
5 else
6 |R’| = |R|
7 else if |rem| < ( |R| * T )
8 get Rless by equation (5.2) 9 |R’| = |R|−Rless
10 else
11 |R’| = |R|
The QuID algorithm is introduced in Chapter 2. Before comparing their performance,
we illustrate the simulation setup.
35
To compare the effectiveness for REM_DRP and QuID, there were two
experiments conducted. There are at most 16 resources available in the first
experiment and 50 resources in the second. In both experiments, three workloads of
different arrival rates are run. Remaining tasks metric is used for dispatching.
Moreover, the warm-up time of idling resources is 20 seconds and 4 resources are
assumed to be ready for accepting requests at the beginning of experiments.
Simulation parameters are summarized in Table 5.1.
Simulation parameters Experiment 1 Experiment 2
Total resources 16 50 3 rounds (workflows) { 300, 400, 200 } Request arrival interval { 3.5, 2.5, 4.5 } Initial/minimum running resources 4 Warm‐up time 20 sec. Load metric for dispatching Remaining tasks metric Table 5.1 Simulation parameters
Parameters of REM_DRP and QuID are listed in Table 5.2. Parameters of QuID are
chosen based on a series of simulations as shown in Table 5.3, 5.4.
REM_DRP QuID
Measurement interval 3 sec. 60 sec. Utilization rate 75%
36 (Utilization rate = 75%)
Interval (sec.) 30 45 60 75 90 120
response time 19.2 21.52 13.31 21.42 18.63 52.29
resources 10 11.79 12.63 12.91 12.09 12.69 Table 5.3 Performance of different utilization rate measurement intervals.
(measurement interval = 60)
Utilization (%) 50 65 75 85 90
response time 18.65 15.85 13.31 29.37 30.82
resources 14.61 12.71 12.63 11.44 11.15 Table 5.4 Performance of different utilizations.
In the experimental results, the average resource usage Ravg is computed by the following equation:
( )
avg i
R =avg r , i = 1,2,3,4 … end of simulation.
i
r
denotes the number of running resources at time i. The unit of time is second.5.3 Performance Evaluation
Experimental results are summarized in Table 5.5. Figure 5.2 -5.5 show the
details of variations on response time and resource usage during the experiments. For
REM_DRP, the workload limit on each resource is set to 9 tasks in the very beginning.
The value 9 was determined by simulation studies on the performance of various
37
others when there is a wider range for resource amount determination as in
experiment 2. For comparison with QuID, in experiment 1, where at most 16
resources are available, REM_DRP has shorter response time than QuID by 31%, but
0.63 resource more in resource usage. In experiment 2, REM_DRP outperforms QuID
in both response time and resource usage. Comparing with the static provisioning
approach, let the target response time be 8.2 seconds, REM_DRP requires roughly
11.96 resources in average while static provisioning requires 16 resources. From
another aspect, let the resources usage be 12 for economic reasons, REM_DRP
provides an average response time of 8.3 seconds and static provisioning provides
22.36 seconds. REM_DRP is two times quicker. However, since REM_DRP set
resources dynamically, it may use more than 12 resources sometimes.
Utilization rate is used in QuID for measuring the workload on each resource.
One potential drawback of utilization rate for DRP is that when utilization rate
reaches 100%, it cannot effectively calculate the amount of resources to increase.
Moreover, utilization rate is a time-interval based measurement, such as arrival rate
and average response time. Therefore, it is a crucial issue to determine an appropriate
measurement interval. However, this is difficult. As shown in Table 5.3, response time
and resource usage are not monotonically increasing or decreasing with the
38
Static provisioning Dynamic resource provisioning Experiment 1 : 4 ~ 16 resources Experiment 2 : 4 ~ 50 resources Fixed 16 Resources Fixed 12
Resources REM_DRP QuID REM_DRP QuID Avg. response time (sec.) 8.2 22.36 9.03 13.1 8.3 13.31 Avg. resource usage 16 12 12.2 11.57 11.96 12.63
39
Figure 5.2. REM_DRP in experiment 1, 16 resources available.
40
Figure 5.4. REM_DRP in experiment 2, 50 resources available.
41
Chapter 6 Conclusions and future work
Applications require the capability of adjusting the amount of deployed resources
dynamically in order to take benefits of the pay-only-what-you-consume policy on the
cloud platform. This thesis proposes a framework for developing interactive workflow
applications on the cloud platform. Currently many server applications adjust the
amount of resources at runtime manually. The framework in this thesis allows
applications to automatically manage the amount of resources according to the system
workload. It offers application providers the benefits of maintaining QoS-satisfied
response time under time-varying workload at the minimum cost of resource usage.
The framework mainly deals with two issues: dynamic request dispatching and
resource provisioning. For dynamic request dispatching, an improved least load
dispatching approach is proposed which adopts a load metric of remaining tasks based
on the characteristics of interactive workflow applications. Experimental results based
on simulations indicate that remaining tasks can achieve better dispatching
performance with arrival rate and response time which are commonly used in existing
dispatching methods.
For dynamic resource provisioning, REM_DRP is proposed as a feedback
controller to automate resource provision by taking advantage of the characteristics of
interactive workflow applications. Experimental results show that REM_DRP
outperforms static provisioning and the utilization rate based QuID approach in both
42
The interactive workflow applications in this thesis are assumed to be in the form
of directed acyclic graphs. A possible future extension of our framework is to handle
more complicated types of interactive workflows such as those containing loops or
conditional branches. Another future direction is to deal with multi-tier web
43
References
[1] F. Dong and S. G. Akl. Scheduling Algorithms for Grid Computing: State of the Art and Open Problems. Technical Report 2006-504, School of Computing, Queen’s University, Kingston, Ontario, January 2006.
[2] K. H. Yeung and K. W. Suen. Least load dispatching algorithm for parallel web server nodes. IEE Proceedings of Communications, 149 (2003)
[3] K. Dutta, A. Datta, D. VanderMeer, H. Thomas, and K. Ramamritham. ReDAL: An Efficient and Practical Request Distribution Technique for Application Server Clusters. IEEE transactions on Parallel and Distributed Systems, 18(11):1516–1527, 2007.
[4] S. Ranjan, J.Rolia, H.Fu, and R. Knightly. QoS-Driven Server Migration for Internet Data Centers. In Proceedings of the Tenth International Workshop on Quality of Service, Miami, FL. 2002.
[5] Aram Galstyan, Karl Czajkowski and Kristina Lerman. Resource Allocation in the Grid with Learning Agents,” Journal of Grid Computing 3(1–2):91 –100, 2005
[6] L. Amar, A. Barak, E. Levy, and M. Okun. An On-line Algorithm for Fair-Share Node Allocations in a Cluster. In Proceeding of International Symposium on Cluster Computing and the Grid, 2007, pp. 83-91.
[7] B. Wu, C.-H. Chi, Z. Chen, M. Gu, and J. Sun. Workflow-based resource allocation to optimize overall performance of composite services. Future Generation Computer Systems, 25(3):199-212, 2009.
[8] S. Ranjan, R. Karrer, and E. Knightly. Wide Area Redirection of Dynamic Content in Internet Data Centers. In IEEE INFOCOM, HongKong, 2004.
[9] MD de Assuncao and R. Buyya. A Cost-Aware Resource Exchange Mechanism for Load Management across Grids. 14th IEEE International Conference on Parallel and Distributed Systems, 2008.
44
[10] A.P. Chester, J.W.J. Xue, L. He, and S.A. Jarvis. A System for Dynamic Server Allocation in Application Server Clusters. IEEE International Symposium on Parallel and Distributed Processing with Applications. 2008.
[11] E-K. Byun, J-W. Jang, W. Jung, and J-S. Kim. A Dynamic Grid Services Deployment Mechanism for On-Demand Resource Provisioning. In Proceedings of Cluster Computing and the Grid, 2005.
[12] B Urgaonkar, P Shenoy, A Chandra, P Goyal, and T. Wood. Agile Dynamic Provisioning of Multi-Tier Internet Applications. ACM Transactions on Autonomous and Adaptive Systems, Vol. 3, No. 1, Article 1, March 2008.
[13] S. Ranjan and E. Knightly. High-Performance Resource Allocation and Request Redirection Algorithms for Web Clusters. IEEE Transactions On Parallel And Distributed Systems, Vol. 19, No. 9, September 2008.
[14] Foster, I. and Kesselman, C. (eds.). The Grid: Blueprint for a New Computing Infrastructure. Morgan Kaufmann, 1999.
[15] J. Yu, R. Buyya, and C.K. Tham. A Cost-based Scheduling of Scientific Workflow Applications on Utility Grids. In 1st IEEE International Conference on e-Science and Grid Computing, Melbourne, Australia, Dec. 5-8, 2005.
[16] M. Rahman, S. Venugopal, and R. Buyya. A dynamic critical path algorithm for scheduling scientific workflow applications on global grids. In Proceedings of the 3rd IEEE International Conference on e-Science and Grid Computing, Bangalore, India, 2007.
[17] Y. Yan and B. Chapman. Scientific workflow scheduling in computational grids Planning, reservation, and data/network-awareness. IEEE International Conference on Grid Computing, 2007
[18] J. Palmer and I. Mitrani. Optimal and heuristic policies for dynamic server allocation. Journal of Parallel and Distributed Computing, 65(10):1204–1211, 2005.
[19] J. Slegers, I. Mitriani, and N. Thomas. Evaluating the optimal server allocation policy for clusters with on/off sources. ELSEVIER, Performance Evaluation 66
45 (2009) 453-467
[20] H. Lim, S. Babu, J. Chase, and S. Parekh. Automated Control in Cloud Computing: Challenges and Opportunities. Proceedings of the 1st workshop on Automated control for datacenters and clouds, 2009.
[21] P Padala, KG Shin, X Zhu, M Uysal, Z Wang, S. Singhal, A. Merchant, and K. Salem. Adaptive control of virtualized resources in utility computing environments. Proceedings of the 2nd ACM SIGOPS/EuroSys European Conference on Computer Systems, 2007
[22] Amazon Elastic Compute Cloud (EC2). http://aws.amazon.com/ec2/.
[23] TPC-W: Transaction Processing Council . http://www.tpc.org/tpcw/default.asp, Standard Specification Version 1.8, http://www.tpc.org/tpcw/spec/tpcw_V1.8.pdf
[24] Anthony Sulistio, Uros Cibej, Srikumar Venugopal, Borut Robic and Rajkumar Buyya A Toolkit for Modelling and Simulating Data Grids: An Extension to GridSim, Concurrency and Computation: Practice and Experience (CCPE), Online ISSN: 1532-0634, Printed ISSN: 1532-0626, 20(13): 1591-1609, Wiley Press, New York, USA, Sep. 2008.
[25] V. Cardellini, E. Casalicchio, M. Colajanni, and P. Yu, The state of the art in locally distributed web-server systems. IBM Research Division, Tech. Rep. C22209 (W0110-048), October 2001.
[26] Garey, M. and Johnson, D. Computers and Intractability. A Guide to the Theory of NP-Completeness.(ISBN: 0716710447)W.H.Freeman & Co Ltd, April 1979.
[27] Fred Howell and Ross McNab (1998) "simjava: a discrete event simulation package for Java with applications in computer systems modelling", in proc. First International Conference on Web-based Modelling and Simulation, San Diego CA, Society for Computer Simulation, Jan 1998.
[28] Siebel Business Process Framework,
http://download.oracle.com/docs/cd/B40099_02/books/BPFWorkflow/booktitle.ht ml
46
[29] S. Ludtke, P. Baldwin, and W. Chiu. “EMAN: Semiautomated Software for High Resolution Single-Particle Reconstructions”. J. Struct. Biol, (128): 82-97, 1999.
[30] G. Singh, E. Deelman, and G. Bruce Berriman et al. “Montage: a Grid Enabled Image Mosaic Service for the National Virtual Observatory”. Astronomical Data Analysis Software and Systems (ADASS), (13), 2003.
[31] Y. Zhang, C. Koelbel, and K. Kennedy. “Relative Performance of Scheduling Algorithms in Grid Environments”. In 7th IEEE International Symposium on Cluster Computing and the Grid (CCGrid 2007).
[32] Mandal, K. Kennedy, C. Koelbel, G. Marin, J. Mellor-Crummey, B. Liu, and L. Johnsson. “Scheduling Strategies for Mapping Application workflows onto the Gird”. In 14th IEEE Symposium on High Performance Distributed Computing (HPDC 14), pp. 125-134, 2005.
[33] Rajkumar Buyya and Manzur Murshed, GridSim: A Toolkit for the Modeling and Simulation of Distributed Resource Management and Scheduling for Grid
Computing, The Journal of Concurrency and Computation: Practice and
Experience (CCPE), Volume 14, Issue 13-15, Wiley Press, Nov.-Dec., 2002.
[34] Foster and C. Kesselman. Globus: A metacomputing infrastructure toolkit. Intl. Journal of Supercomputing Applications, 11(2):115–128, 1997.
![Fig. 2.3. A flow diagram in GridSim based simulations. [33]](https://thumb-ap.123doks.com/thumbv2/9libinfo/8026205.161140/16.892.260.630.405.718/fig-flow-diagram-gridsim-based-simulations.webp)
![Fig. 2.4. Entity communication model via the Input and Output entities. [33]](https://thumb-ap.123doks.com/thumbv2/9libinfo/8026205.161140/17.892.237.658.166.454/fig-entity-communication-model-input-output-entities.webp)