國 立 交 通 大 學
電子工程學系 電子研究所碩士班
碩
士
論
文
以視訊為基礎之多點式觸控人機介面系統
Vision-Based Multi-touch Human Computer
Interface
研 究 生:許庭瑋
指導教授:王聖智 博士
以視訊為基礎之多點式觸控人機介面系統
Vision-Based Multi-touch Human Computer Interface
研 究 生:許庭瑋 Student:Wei-Ting Hsu
指導教授:王聖智博士 Advisor:Dr. Sheng-Jyh Wang
國 立 交 通 大 學
電子工程學系 電子研究所碩士班
碩 士 論 文
A Thesis
Submitted to Department of Electronics Engineering & Institute of Electronics
College of Electrical and Computer Engineering
National Chiao Tung University
in partial Fulfillment of the Requirements
for the Degree of Master
in
Electronics Engineering Oct 2009
Hsinchu, Taiwan, Republic of China
以電腦視覺為基礎之多點式觸控人機介面
研究生:許庭瑋 指導教授:王聖智 博士
國立交通大學
電子工程學系 電子研究所碩士班
摘要
在本論文中,我們提出一建立於電腦視覺,可適用於任意物體的
新式的多點式觸控人機介面,且系統的外觀厚度遠小於現行的電腦視
覺觸控系統。我們的系統架構於兩組水平及俯視的攝影機和固定的邊
框。當物體接觸螢幕時,水平攝影機得到接觸物體的影像。將兩水平
攝影機所得到的物體位置投影回 3D 座標系,即可得到物體存在的可
能位置。透過俯視攝影機分析各個可能位子是否存在物體的可能性,
並尋找最有可能的物體位置組合。最後將結果傳送至應用程式端。為
了加速在尋找可能位置的時間,我們使用 Viterbi 演算法和變異係數
分析排序。
Vision-Based Multi-touch Human Computer
Interface
Student: Wei-Ting Hsu Advisor: Dr. Sheng-Jyh Wang
Department of Electronics Engineering, Institute of Electronics
National Chiao Tung University
Abstract
This thesis proposes a new computer vision based multi-touch human
computer interface with any type of objects. The thickness of this system
is much smaller than that of the most popular existing technologies, FTIR
and DI. To detect the touch position, our system consists of a rim upon
the edge of screen, one pair of horizontal cameras and one pair of tilted
cameras. First, the possible positions of objects would be enumerated by
the foreground in the horizontal views. Then, each position would be
projected to the tilted views, and analyzed with the information from
tilted cameras. Finally, the positions of existing objects can be separated
by the proposed arrangement algorithm, and can be sent to applications
by TUIO protocol. To speed up the arrangement process, Viterbi
algorithm and variance-dependent arrangement are also applied in this
work.
誌謝
感謝 王聖智老師從大三到碩二期間給予的耐心指導,除了在課業上
的知識還有在思考方式上,以及待人接物的方式。並感謝實驗室的伙
伴們,在研究時的互相討論並在需要幫助時給予協助。我也要感謝我
的家人,因為有他們的支持,讓我可以安心地在學業上努力。最後,
還是老話一句,要感謝的人太多了,那就謝天吧。
Contents
Chapter 1. Introduction ... 1
Chapter 2. Background-Multi-touch system ... 3
2.1. Resistive touch screens ... 3
2.2. Capacitive Touch Screen Technology ... 4
2.3. Surface Acoustic Wave (SAW) Technology ... 5
2.4. Traditional Infra-red Touch Screen ... 6
2.5. Purely Vision Based System ... 7
2.5.1. Tracking in 3D space ... 7
2.5.2. Overhead Camera... 7
2.5.3. Frustrated Total Internal Reflection (FTIR) ... 8
2.5.4. Diffused Illumination (DI) ... 10
2.5.5. Diffused Surface Illumination (DSI) ... 11
2.5.6. ThinSight... 12
Chapter 3. System Requirements of Multi-Touch Screen ... 13
3.1. Functional Requirements ... 13 3.1.1. Detection ... 13 3.1.2. Identification ... 13 3.1.3. Tracking ... 14 3.2. Non-Functional Requirements ... 14 3.2.1. Volume ... 14 3.2.2. Screen Material ... 14 3.2.3. Latency ... 15 3.2.4. Resolution ... 15 3.2.5. Stability ... 16
Chapter 4. Proposed Method ... 17
4.1. Hardware Description ... 17
4.2. Algorithm ... 21
4.2.1. System Initialization ... 21
4.2.2. Foreground Detection in horizontal view ... 22
4.2.3. List Possible Position ... 24
4.2.4. Analysis of Possible Position ... 24
4.2.5. Emulation Possible Position ... 31
4.2.6. Grade Integration ... 32
4.2.7. Possible Position Arrangement ... 36
4.2.8. Output data ... 45
Chapter 6. Conclusion and Future Work ... 52 Reference ... 53
List of Figures
Figure 1-1: Screen of Control Application in Windows 7[1] ... 1
Figure 2-1: Resistive touch screen[6] ... 3
Figure 2-2: 4-corner Surface Capacitive Touch Screen[7] ... 4
Figure 2-3: Projected Capacitive ... 5
Figure 2-4 :Surface acoustic wave touch screen[8] ... 6
Figure 2-5 :Infra-red Touch Screen ... 6
Figure 2-6: Operator screen of Akira Utsumi system ... 7
Figure 2-7: C-State system... 8
Figure 2-8: FTIR Structure ... 9
Figure 2-9: FTIR system ... 10
Figure 2-10: Structure of DI system ... 11
Figure 2-11: System structure of DSI ... 12
Figure 2-12: ThinSight system ... 12
Figure 3-1 :The experiment results from Michotte[19] ... 15
Figure: 4-1 Image from horizontal view ... 18
Figure 4-2 Image from tilted view ... 19
Figure 4-3: Example of real and ghost produced by multi-object ... 20
Figure 4-4 :Proposed System Structure ... 21
Figure 4-5 : Compare horizontal view with tilted view ... 22
Figure 4-5 : System flow chart... 22
Figure 4-7 : Foreground separation in horizontal view ... 23
Figure 4-7 : Example of background subtraction ... 24
Figure 4-9 : Diagram of possible position Analysis... 25
Figure 4-10 :Diagram of sub-region analysis ... 26
Figure 4-11 : Similarity Function... 27
Figure 4-12 : Processing of similarity re-weight ... 29
Figure 4-13 : Example of possible position tracking ... 31
Figure 4-14 : Example of foreground occlusion in horizontal view ... 32
Figure 4-15 : Example of sub-region overlaping ... 33
Figure 4-10 : Exapmle of non-uniform foreground ... 34
Figure 4-10 : Diagram of possible position analysis ... 36
Figure 4-17 : Example of arrangement step ... 37
Figure 4-18 : Commonality of different arrangement ... 38
Figure 4-19 : Example of transformed arrangement tree ... 39
Figure 4-21 : Example of arrangement with Viterbi algorithm ... 40
Figure 4-23: Compare the original arrangement and best select arrangement
... 43
Figure 4-23 : Example of variance-include arrangement ... 43
Figure 4-24 : Viterbi algorithm with variance-include ... 44
Figure 4-25 : Example of arrangement in occlusion situation ... 45
Figure 4-26 : Example of using TUIO protocol in DI system ... 46
Figure 5-1 :Experiment Equpment... 47
Figure 5-2 Different screen contends of experiments ... 48
Chapter 1. I
NTRODUCTION
Multi-touch systems are very popular in recent years, and Windows 7 even sets the multi-touch as a standard user input interface. With multi-touch interfaces, users can operate applications in a more intuitive and faster manner. Hence, it is not surprising the large scale multi-touch screen would have great demand. In general, the multi-touch systems could be classified into resistive, capacitive, SAW (surface acoustic wave) and vision based system. Though resistive and capacitive based systems are the commonest and well-known, those systems are not proper to be applied to large-size screen due to the cost and durability issues.
Figure 1-1: Screen of Control Application in Windows 7[1]
While the manufacture processing of low cost CCDs are more matured in recent years, many new vision-based multi-touch systems are developed for large-scale touch screen, such as FTIR[2] and DI (SURFACE)[3] . However, both FTIR and DI need larger space to set up. Hence, products of FTIR and DI are often desk-like. In addition, the screen materials of FTIR and DI are also limited the purpose and image quality.
In this thesis, we propose a new vision based multi-touch system which sets the horizontal and tilted cameras on the edge of screen and can solve preceding issues of FTIR and DI.
background separation, and possible positions are listed. Then, images from tilted cameras are analyzed, and confidences of each possible position are calculated by various methods. After we get the information of each possible position, we would find the arrangement of exist objects that mostly happen. Finally, the object positions would be sent to multi-touch application with the TUIO[4] protocol.
This thesis is organized as follows. In Chapter2, we introduce the techniques of touch screen. In Chapter3 and Chapter 4, we describe the requirements and algorithm of our system, respectively. Experimental methods and results are shown in Chapter5. Finally, we will make a brief conclusion in Chapter6.
Chapter 2. B
ACKGROUND
-M
ULTI
-
TOU
CH SYSTEM
Multi-touch denotes a set of user interface systems, which allow user to control system by using fingers or objects at the same time. Although multi-touch system has been studied since 1982 [5], the high price and slow computation make the technique be stored only in lab. However, the technique has become well-known few years ago due to the success of Apple IPhone and the advent of many different multi-touch hardware and software system.
2.1. R
ESISTIVE TOUCH SCREENS
The resistive touch screen has two opposing layers, both coated with resistive material and separated by air gap. Two sheets would be pressed together when one of them is touched. Then, the electric current would flow from one sheet to the other. In order to lift transmittance of the layer, indium tin oxide (ITO) is often used as the material of layers. For some large scale and low cost situation, thin copper line is another option of build conductive layer.
Resistive touch screen can work with any normal object, and the low cost makes it popular among merchandise. Nevertheless, it can be damaged by sharp objects, and has only 75% optical transparency due to the multi-layer sensor.
Figure 2-1: Resistive touch screen[6]
2.2. C
APACITIVE
T
OUCH
S
CREEN
T
ECHNOLOGY
The basic idea of capacitive touch screen is detecting the “touch” - The “touch” is bought by voltage changes when humans contact. As the approaching of human fingers, the mutual capacitance would be modified. Then we can analysis the touching position by detecting the voltage change volume.
There are two types of capacitance based touch - surface capacitance and projected capacitance.
Surface capacitive touch surface consist of a uniform conductive coated on a glass layer. ITO is often used as the material of screen owing to its conductor and transparent. The sensor would be set up on the corner or edge of screen. When human finger touch the screen, the controller would measure the voltage change from the corner/edge and estimate the exact position of touch.
The projected capacitive touch surface measures the voltage change value by the thin wires installed in x and y direction between two protective glasses. Because the wire grid is much transparent than the layer, the light transmission rate is better. Moreover, projected capacitance technology doesn’t lose its accuracy. On the other hand, the multi-touch sensor can be easily build based on projected capacitive touch surface, while the cost of projected capacitive touch surface is much higher because of
the complex of mechanical.
Figure 2-3: Projected Capacitive
The light transmit rate of capacitive touch screen is almost 90%, which is much better than resistive technology. However, the capacitive touch screen is only activated by the touch of human finger or conductor; gloved finger or pen would bring none effect. Hence, it’s applications to medical place or dust-free room would be inappropriate. Because the capacitive touch screen measures small amount of current, the accuracy is easy to effect by dust, humidity and ground voltage. But the cost is the major disadvantage of capacitive based system.
2.3. S
URFACE
A
COUSTIC
W
AVE
(SAW)
T
ECHNOLOGY
The Surface Acoustic Wave technology is based on two transducers (transmitting and receiving) placed for the both of X and Y axis (or the corner) on the touch panel. The acoustic wave is spread across the screen by bouncing off reflector arrays along the edges of the overlay. When a finger touches the screen, the waves would be absorbed, cause the received signal changed, make the controllers measure the signal and convert the signal to position.
Compared to resistive and capacitive technologies, the screen with SAW technique is much clarity and has higher light transmission because its panel is made by glass. Having no layers, the panel has the highest durability. However, the system cannot work with sharp or hard objects (like pen), and the touch screen cannot be completely sealable, and thus it cannot work with large amounts of dirt, dust and
water.
Figure 2-4 :Surface acoustic wave touch screen[8]
2.4. T
RADITIONAL
I
NFRA
-
RED
T
OUCH
S
CREEN
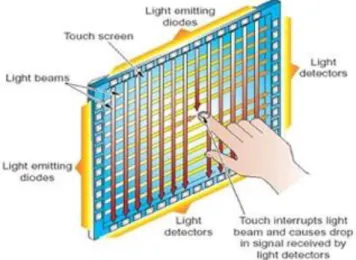
Traditional Infra-red screen composes pair of IR-emitter and IR-receiver along X and Y axis. When object touches the screen, the infrared light is broken. Controllers can calculus the object position by the information received from X-Y axis. It does not incorporate any kind of screen and also not overlapped. Thus it would not affect the brightness and clarity. Some manufactures are designed to independent part of screen. The other advantage is that the system can be designed for extra-large screen.
2.5. P
URELY
V
ISION
B
ASED
S
YSTEM
Unlike the technique describe previously, the pure vision based systems rely on CDD camera instead of special sensor. In most algorithms, different size of screen and situation are more flexible.
2.5.1. Tracking in 3D space
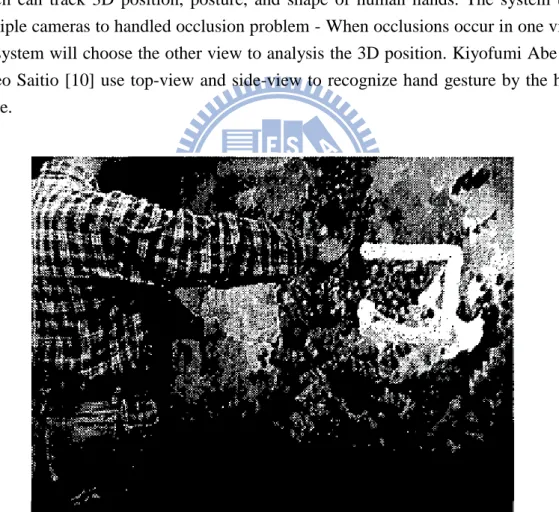
In 1999, Akira Utsumi and Jun Ohya proposed a multi-camera based system[9], which can track 3D position, posture, and shape of human hands. The system uses multiple cameras to handled occlusion problem - When occlusions occur in one view; the system will choose the other view to analysis the 3D position. Kiyofumi Abe and Hideo Saitio [10] use top-view and side-view to recognize hand gesture by the hand shape.
Figure 2-6: Operator screen of Akira Utsumi system
2.5.2. Overhead Camera
Using camera on the top to analysis hands on the table is an intuition. The overhead camera can be used to convert an arbitrary surface into an interactive one.
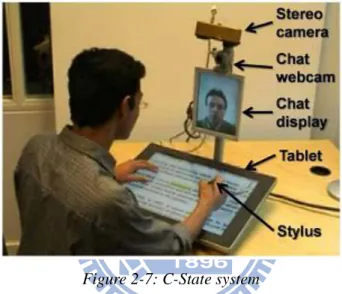
Jelien Letessier proposed a system based on background subtraction and object shape filter to separate the finger top from background[11]. But the system cannot detect the depth of object, which is the major drawback of overhead single camera system. Visual Touchpad by Shahzad Malik and Joe Laszlo uses two cameras instead of one to detect the depth and position of finger top[12], and defines multiple gestures to control system. With high-precision fingertip detects, C-State[13] uses stereo camera instead of normal camera to estimate the height of fingertip. The fingertip detect algorithm is based on machine learning methods and a geometric finger model, so it can be “trained” to work under different physical setting. The system can sense touch with a precision of 2-3mm.
Figure 2-7: C-State system
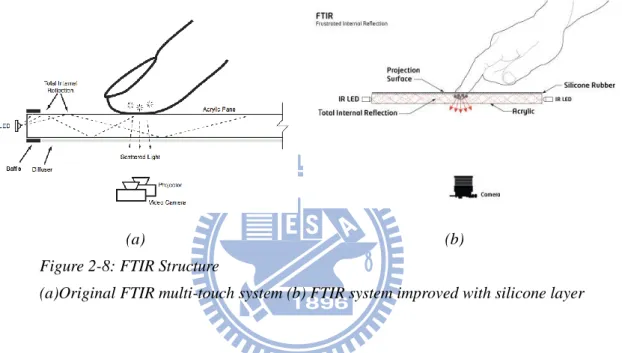
2.5.3. Frustrated Total Internal Reflection (FTIR)
FTIR is a touch system which uses total internal reflection to separate touch object from background. Total internal reflection is an optical phenomenon, which occurs when a ray of light strikes a boundary between two medium with an angle larger than the critical angle respect to the other medium. If the refractive index is lower than other side, the light will be reflected inside the original medium.
The FTIR[2] system is mounted an array of infrared LED’s at the edges of an acrylic sheet and camera with IR bandpass filter. If the acrylic is not touched, the infrared will be reflected in the acrylic sheet. On the other hand, if the acrylic is touched by a finger on the surface, the total internal reflection will be “frustrated”, and which causes the light to scatter from the acrylic at the touch position. Then, the camera can sense the scattered infrared to compute the touch position. The system only has to detect the light blob and count the center.
Because the FTIR is detected by the touching of objects on acrylic plan, the touch/un-touch detection is much more precise than other vision based touch detect system. Compared with the previous system, the FTIR system is more flexibility and scalable. The first reason is that the camera is mounted under the table, so it’s free to worry that user may shade the screen; the other reason is that the camera’s resolution can be lower than other systems which need precision features to reconstruct 3D position. Furthermore, projector with IR bandpass filter can be setup under the acrylic pane to make the FTIR touch-panel become real touch-screen.
(a) (b)
Figure 2-8: FTIR Structure
(a)Original FTIR multi-touch system (b) FTIR system improved with silicone layer
The disadvantage of FTIR is that the touch object has to be soft to contact the acrylic pane with enough size, and the error rate may be rose due to the dust, oil and sweat. One possible solution is adding a silicone layer upper the acrylic player - The silicone layer not only can project the acrylic pane but also can make the small object scatter more infrared to detected, though it would make the light throw rate lower. The other way to solve the noise from dust and oil is using the adaptive threshold (Hyosum Kime[14]) instead of fixed threshold in foreground separation.
(a) (b) Figure 2-9: FTIR system
(a)Appearance of FTIR screen (b) example of using multi-touch interface
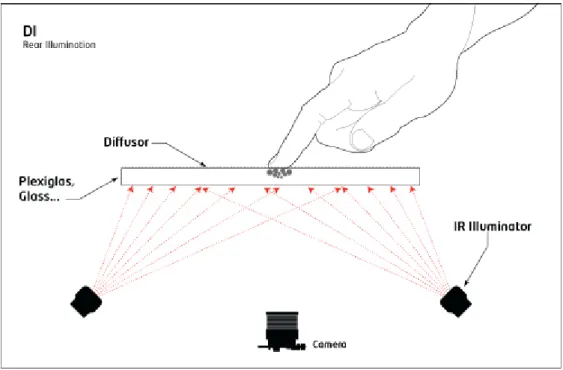
2.5.4. Diffused Illumination (DI)
Diffused Illumination system[3] is a similar system compared with FTIR in computer vision algorithm. The difference between two systems is that DI set up infrared light from non-interactive side instead of edge of surface. This will cause the active side to be brighter with infrared, and the camera than choose the bright area as touch object. As FTIR system, the screen is also built by projector behind the surface, but in order to avoid affect the image from infrared light, the projector will be set up with IR-bandpass filter. Unlike the FTIR performance critical of the surface material, the DI system can choose any transparent surface to be the touch and projection screen.
The major advantage of DI system is that it can sense not only “touch” object, but also “hover” object, which is near the screen but has no direct contact. Further, because DI relies on “seeing” the object, it’s able to recognize markers or artifacts placed on the screen though it will also make the system more computation consumption. Furthermore, the infrared light is spread by camera below table, and thus the infrared light may not be even. So the calibration should also consider the physical infrared light illumination.
Figure 2-10: Structure of DI system
2.5.5. Diffused Surface Illumination (DSI)
To make even distribution of infrared light on the screen in DI system, Tim Roth[15] proposed the adaptive structure based on the special acrylic - plexiglass endlighten. The material is acrylic, incorporating many small particles that act as tiny mirror. When infrared light the edge of acrylic, the light will be redirected and spread across the surface, and the spread is more even then the direct irradiation on the surface. Nevertheless, the image from DSI system has less contrast compared to normal DI system - the surface material also redirects the infrared light from object to camera.
Figure 2-11: System structure of DSI
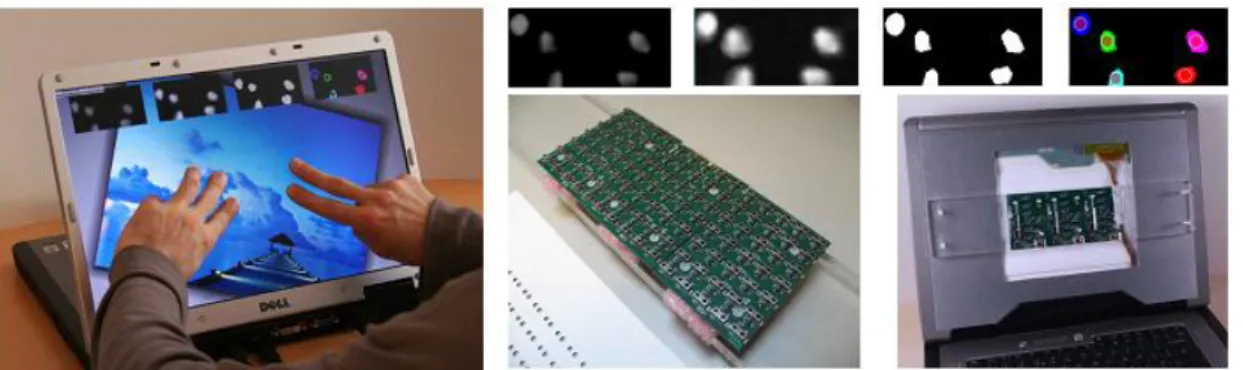
2.5.6. ThinSight
The ThinSight[16] is a technique using vision-based touch system with LCD screen. The idea is to create a matrix of IR transceivers behind the LCD panel. Each transceiver consists of IR emitter and detector. When object touches the screen, the IR detector can detect the IR light reflecting from object. Though each emitter and detector can only cover small region by creating a matrix of transceivers, it’s possible to cover the entire surface area of the LCD screen. The resolution and accuracy depends on the density of transceivers. The IR detector and emitter can also be used to communication with other devices with IR transceiver, for example, remove control or mobile phone.
Chapter 3.
S
YSTEM
R
EQUIREMENTS
OF
M
ULTI
-T
OUCH
S
CREEN
In this section, we will define several requirements for our real-time human-computer interactive device. Those requirements would guide hardware and algorithm of our system.
3.1. F
UNCTIONAL
R
EQUIREMENTS
The function requirements describe the ability of our multi-touch system, those requirements were discussed in [17, 18].
3.1.1. Detection
The basic function of our system is to detect whether the screen is pressed and where the object is. The objects could be fingers, hands, or pens. The time of the object touches the screen should be robust and the place interactive with system should be easily identified for users. If multiple objects are interactive with the screen, the system should be able to identify them all.
3.1.2. Identification
Identification determines which kind of object is on the screen, and then we could set up different reaction in application.
If we want to use our system to control the windows system, for example, we could set the reaction of our system like the following:
Use fingertip to touch the button on screen directly. The system could directly move mouse pointer to the position and click.
Right Click could be implemented by putting the hand on the screen.
In painter, if a pen on canvas, the path should be drawn with the color of pen. Same in painter, any large object should be eraser.
3.1.3. Tracking
The detection means tell our system where objects touch the screen, in many situations, the motion after objects enters the frame should be also concerned. Like detection, we could easily enumerate many example of UI with tracking object.
Two fingers close at one position means “grab,” while separating the two finger means “erase” the graded object.
Fast move hand from left to right actives the borrow to “next page” The longer press could mean “stronger” press
In painter, if pen move from point A to point B, the line drew should continue from A to B.
The multi-touch system is more difficult than single-touch, since we could take object in different time as same object in single touch system. In multi-touch system, we have to know the relation of objects at different time.
3.2. N
ON
-F
UNCTIONAL
R
EQUIREMENTS
Non-Function Requirements describe the restriction of our system. They depend on the environments of our system and basic principles of human-computer interface. And since our system is built for large-scale whit board, the following restrictions would be established.
3.2.1. Volume
For our system is built for electric white board, the screen is perpendicular. If we use FTIR or DI, which sets the camera behind screen, the depth of system structure will excess one meter. Hence, the thickness of system must be thin.
3.2.2. Screen Material
We hope our system could be very flexible in material of screen. For example, it could work with projector screen, which is large scale and low cost displayer, or LCD screen, which has better resolution and color. The system should be able to work with different screen material.
Human Computer Interface is a branch of knowledge; it’s told us many basic rules to build a friendly user interface.
3.2.3. Latency
Latency is defined as the time between user action and the system response. For most of human’s experiences of interaction come from nature physic, which responses instanced after action. The system’s latency should be as low as possible.
However, there is no system could free from computation, and there is no system could free from latency. Therefore, the point should be focused on what the maximum acceptable latency for users. From the experiment by Michotte, the users take inter-event as connected by “immediate causality,” when the delay between two events is below 50ms. Thus, if the system delay is less than 50ms, the user would not sense the delay.
Figure 3-1 :The experiment results from Michotte[19]
3.2.4. Resolution
The minimum spatial resolution depends on the application and the size of touched object. For example, in the application controlled by button which is larger than 200 cm2, there is no need to distinguish difference between 2 mm; in the contract, in painting program, the position of touch would be critical. For large touching
objects, which the position of object is harder to estimate for user, the resolution also has not to be high.
3.2.5. Stability
Stability consists two types, stability in environment and stability in control processing. It’s probably the most difficult requirement for computer vision system.
Stability in environment means system should work in different environment, like different light source, illumination and work with humidity and electrical noise.
Stability in control is the output should be precious during work. The stability of user interface is more important than many detection systems.
Chapter 4. P
ROPOSED
M
ETHOD
4.1. H
ARDWARE
D
ESCRIPTION
From the requirements we describe previously, the volume of our multi-touch screen system should be very large. That is, the technology of touch-screen is neither resistance based nor capacitance. The vision based system would be the best choice of large scale touch screen. In addition to this, the thickness of our system should be as thin as possible. The back-project camera, for example, FTIR and DI system, is not appropriate. Thus, the only position to set the camera is beside the edge of screen. Moreover, the quality of the image is not affected by the condition of the screen, so the system can be free from screen dust, or abrasion.
(a)
(c) Figure: 4-1 Image from horizontal view (a)Structural drawing of horizontal camera
(b)The image fetched when single fingertop touch the screen (c)The image fetched when two fingertops touch the screen
There are two different views to select as input source - horizontal view and tilted view. Horizontal view means setting the axis of camera horizontal to the screen. The horizontal cameras cannot view the screen, so the content and property of screen would not affect the image property. The most important property is that the background can be controlled by the build rim on the edge of screen. The static background admits using background separation to separate foreground. As we mentioned before, background subtraction has very good efficiency in computation. The static background makes the horizontal view suitable to detect whether and where object touches the screen.
The other view point is tilted view. Tilted view image is fetched from camera, which is set away from screen by small distance. The image fetched will contain the screen. Hence, the image will be changed with the screen content. However, the touch object’s distance can be diverse by position on the image fetched.
(a)
(b)
(c) Figure 4-2 Image from tilted view
(a)Structural drawing of tilted camera
(b)The image fetched when single fingertop touch the screen (c)The image fetched when two fingertops touch the screen
To build a stable and fast system, the horizontal view is the best choice. When there is only one object, the position of touch can be estimated by two horizontal cameras. However, when more than one object exists, data associated problem would occur; the objects in different camera cannot be distinguished. Once the data from different camera is connected incorrectly, the results would be wrong, and the wrong positions here would be named ghost. On the other hand, if the data association is correct, the right position would be called real. The tilted view can help us to distinguish the ghost from the real. The tilted camera would be set just upon the horizontal camera to view the whole screen more efficiently. Horizontal cameras are used to specify whether objects touch the screen and then list the possible positions. Tilted view can examine possible positions and point out the real position.
Figure 4-3: Example of real and ghost produced by multi-object
If the purple is real object, the position of purple object is real, and the blue object is ghost
Figure 4-4 :Proposed System Structure
The black part is the rim of screen; the white cameras are horizontal cameras; and the purple camera are tilted cameras
4.2. A
LGORITHM
4.2.1. System Initialization
The initialization of our system includes camera calibration and color calibration. Camera calibration provides the internal and external parameters of cameras, which can tell us the relation between world coordinate and the image fetched by camera. Because the camera in our system is fixed on the touch screen, both the camera calibration only need to be estimated once. Color calibration is to measure the color response of camera, to establish a known relationship between standard color space. We can also extend the relationship to camera to camera.
Color difference between different cameras is an inevitable problem, because it’s impossible to produce camera’s CCD at identical condition. The difference manufacturing environment will make the sensor response to illumination differently. Hence, there will always exist small divergences between CCDs, even if they are same model specifications. The other reason contributes to the difference is that the
image processing in camera has their parameters of white balance, brightness and contrast to adaptive in different environments.
(a) (b)
Figure 4-5 : Compare horizontal view with tilted view (a) Image fetched from tilted view
(b) (b) Image fetched from horizontal view
Figure 4-6 : System flow chart
4.2.2. Foreground Detection in horizontal view
Since horizontal camera is static and has stable background, we can build the reference background model for each camera view as system initial. The reference background model can also automatically update as the changing of the screen.
Foreground
Detection in
Horizontal View
Possible
Position
Enumeration
Analysis of
Possible
Position
Possible
Position
Arrangement
Out Put Data
Figure 4-7 : Foreground separation in horizontal view
4.2.2.1. Background Model Comparison
As the initial of the system, every pixel value would be recorded as background. After the establishment of background model, we can compare current image with the reference to estimate the probability - whether each pixel belongs to foreground or background. The threshold of determine type of pixel would be computed by difference between current image and the reference image.
If pijBij n2 Pij is foreground
Else Pij is background
Eq4-1
The n is a variable, which the higher n lets the system lower the false positive rate, while the lower of n makes the system more sensitive to object color near background. Bij is the value in background model of each pixel.
is variance ofdifference between current image and the reference image. The variance is estimated by the difference of every pixel at same time rather than by the periodic time of each pixel. The reason is that the noise of each pixel is uniform and the number of foreground pixel is less than the number of background for any moment. Thus, we can suggest that the variance of each pixel is the same. Correction the variance with time can make the system more reliable when illuminant changes and reduce the computation complex.
4.2.2.2. Morphology Correction
Because the size of object is always larger than single pixel, we can use the spatial information to enhance the accuracy of foreground separation. Thus, the pixels near foreground have the higher possibility to be foreground than others. That is, the threshold should be different from the other pixel.
We first separate the nearest background pixel to foreground pixel, and then detected it with lower threshold.
Fnew = Dilate(F) - F
Those pixels would be re-detected with n’ which is lower n.
If 2 ' ij ij p B n Pij is foreground Else Pij is background Eq4-2 (a) (b) (c)
Figure 4-8 : Example of background subtraction (a)Part of horizontal image
(b)Result after background subtraction (c)Result after morphology
4.2.2.3. Foreground Analysis
From previous step, we recognize which pixel belongs to foreground, but the information we need should be object instead of pixel. Hence, we need to segment the object from image. We assume that the foreground in horizontal should look like cylinder. Thus, we find the connect pixels in x-direction, the connect pixels would be grouped and tagged as same object. Then we find the object position in horizontal image by analyzing the center of the pixels belonging to the object.
4.2.3. List Possible Position
Using the camera information from calibration, we can detect the 3D coordinate of object from x-position at two horizontal cameras. Because we cannot be sure the association between each object in two cameras, we list all possible positions with object in horizontal view first.
4.2.4. Analysis of Possible Position
From the previous step, we can get all possible positions. We exam the grade of exists of each possible position. Because the real existence objects’ position is continuing with time, the possible position would general continue. We can also estimate the grade with time.
Figure 4-9 : Diagram of possible position Analysis
4.2.4.1. Sub Region Analysis
We use the tilted view image to separate ghost from real, but the complex background of tilted view is hard to use background separation. Hence, we analyze the property of the foreground in horizontal view, by which we can separate the foreground easily. Because the view angel of horizontal camera and tilted camera are similar, the property estimated in horizontal view and the one estimated in tilted view should be the same. We can estimate the width and color of foreground in horizontal view, and then check the grade of possible position by them in tilted view.
First, we project possible 3D position to the tilted camera’s coordinate. Next, we set the center of sub-region window to the project point, and the width of sub-region window should be as same as the width analyzed from horizontal view. In ideal case, if the possible position is real, the upside of sub-region window should be foreground object, which has similar color with foreground in horizontal view, and the downside would be screen. Thus, we can easily tell whether the possible positions are real or ghost. Because we only need to estimate the sub-region projected from possible position, we are free from dealing with entire tilted camera’s images. Hence, possible position analysis doesn’t cost a lot.
There are two reasons contribute to the unstable analyzing accuracy - position unstable and color unstable. The former would make the sub-region of real object be shifted, and the later is the color difference between reference color and object color in tilted camera.
Two different problems make the sub-region window match the possible position in tilted view incompletely. The first problem is calibration error. Calibration error is produced in calibration processing as system set up, and it may also be produced from the required data of calibration or from the difference between camera model and real case. In our system, the titled camera is seated with low oblique angel. Hence, the y-direct of tilted camera cannot preciously map to the screen. The calibration is therefore more difficult than general case. The other problem causing sub-region
Sub Region Analysis Sub Region Analysis Sub Region Analysis Possible Position Tracking Possible Position Tracking t-1 t-2 t
mismatch is the synchronization between horizontal camera and tilted camera. Because the image fetched from camera would be delivered to computer by USB port, there would be a time interval between each camera data arrive. That is, the image we fetched at the same time may be shot at different times. Thus, the object in image might be at different position once the object moves fast. Though both problems in multi-cameras system are not uncommon, the region of interesting of our system is smaller than the one of general computer vision system. These problems are more critical in our system than in general computer vision.
Two problems would happen during the measurement of similarity - camera color inconsistency and horizontal-tilted camera color difference. Camera color inconsistency is setting camera up in a constant scene, while the color of frame changing with time. The reason of color inconsistency is still unknown, and the frequency and amplitude of change intensity of each camera are also different. The color difference between cameras means the different response between cameras mentioned previously. Though we have already built the relation of camera with stand color space, the relation is still unreliable owing to the inconsistent color changing.
To deal with the sub-region shift and camera color problem, the algorithm to estimate grade of object must endure the shift of sub-region window (in x and y direction) and color difference.
Figure 4-10 :Diagram of sub-region analysis
Possible
Position
Projection
Sub-region
Window
Setting
Similarity
Measurement
Re-weight
Similarity Map
Similar Map at
y-direction
Gradient
Reweight Each
Column
Foreground
Region
Separation
Grade Mean
Estimation
4.2.4.2. Possible Position Projection and Sub-region Window Setting
From the previous step, we get the possible position of real or ghost. Tilted view image can help us recognizing the type of possible positions. To lessen computation complex, we only focus on small sub-region window. The window is set to the possible position of tilted view. Because the view point of horizontal view is similar to tilted view, the width size can refer to the width of object in horizontal view. But with the sub-region shift we discuss previously, the width of sub region window should be larger than the width of foreground in horizontal view to endure shift in x-direction. The high of sub-region window is also set according to the height of horizontal view.
4.2.4.3. Similarity Map Measurement
To measure whether the sub region window contains foreground object, we use the foreground information from horizontal view. We estimate the reference color in horizontal foreground region. If color of tilted view pixel is similar to horizontal reference color, the property to be foreground would be high. Because of the color inconsistency of camera, we cannot judge directly whether the pixel is background or foreground. Instead, we only estimate how each pixel is similar to reference color, and the distance between pixel color and reference color would transform to similarity which we would describe later.
'
_ _
reference reference
Color color space transform Color Eq4-3
'
2 '
2 '
2tilted reference tilted reference tilted reference
distance R R G G B B Eq4-4
We take the distance extreme large as impossible to be foreground, and distance smaller than a threshold to be must foreground. Hence, the similar function is designed such that we only consider a range of distance value; whether it’s too dissimilar or too similar would not cause intense similarity.
4.2.4.4. Reweight Similar Map
Because the color is inconsistency, we cannot direct expect the similarity threshold of foreground. We use the spatial information of sub-region window to enhance the precise of similarity map.
The reweight consist two part; dissimilar suppress and similarity normalize. Dissimilar suppress means finding the similarity of pixel which must be at background, and shift every similarity value with that of background pixel. Hence, the similarity of background would move toward zero. Because during setting sub-region window, we set the width of window larger than real object width, and thus we can expect every array in sub-region window contain background pixel. Hence, we shift all similarity with the lowest similarity in the array. After setting the similarity of background to zero, we would normalize the similarity of sub-region window to 0~1. Unlike the dissimilar suppress, all sub-region from same foreground object in horizontal view would be normalize with same value. As we know, there must be at least one real object in the series of sub-region window from same horizontal foreground. Therefore, we take the max similarity in the series sub-region window as foreground similarity and use the value to normalize all similarity in series windows.
(a) (b) (c) (d) Figure 4-12 : Processing of similarity re-weight
Orginal sub-region image
(c) Orginal similarity map and histrogram
(d) Similarity map and histrogram after dissimilar suppress (e) Similar map and histrogram after similarity normalize
4.2.4.5. Y-direction Gradient
After reweight similarity map, we get a more robust similarity map. Our system is analyzing if the intermediate part of the sub-region window is the edge of foreground object in tilted view. Therefore, we estimate the gradient of similarity on y-direction of each column. If the edge is at the intermediate part, the gradient on the intermediate part would be large than the other part. Because we have normalized the similarity to 0-1, the gradient value would be less affected by the difference between foreground object and background object.
4.2.4.6. Reweighting and Summation Gradient
As we mentioned before, the sub-region window may be shifted on both x or y direction. If the sub region is shifted to y direction, the gradient result would not focus on the intermediate part of sub-region window. In addition to this, if the tilted image is blurred, the edge of foreground object would be obscure. Thus, we can not only concentrate on the middle part of sub-region window. We then use a triangle function to reweight all column of the similarity map, and sum up each column.
0 2 2 height i ij i height height Similarity Similarity i
Eq4-5Similarityi is the ith column reweight-gradient sum.
Similarityij is the Similarity(i,j) of sub-region window
height is the height of sub-region window
4.2.4.7. Foreground Region Separation and Estimation Mean of
Similarity Map
After reweight and sum gradient of each column, we get the grade telling whether each column is part of real object. However, as we described before, the width of sub-region window is larger than the width of object. Hence, we must separate the foreground columns from background columns, which is more likely to be foreground from sub-region window. After separation step, we would get the grade of the sub-region window by estimating the mean of grade of foreground columns.
4.2.5. Emulation Possible Position
As we mentioned before, the possible position should be continues, and thus we can also expect the grade continue over time. Hence, we can estimate the possible position’s grade with the past information. Therefore, we need to establish the relation between past possible positions and current possible position - we build tracking system to associate the possible positions at different time.
All the possible positions at last frame would be predicted with Kalman filter. Possible positions at current frame would find the nearest past predict position. If the distance between two positions is smaller than the longest possible distance, we would make association between the possible position and the nearest past possible position. Else, the possible position would be taken as the incoming possible position.
(a) (b)
Figure 4-13 : Example of possible position tracking Stage at t-1 (b) Stage at t
The (b)-1 would be linked to (a)-1, (b)-1,2,3 would be taken as incoming possible position
The difference between possible positions tracking algorithm is different from general tracking algorithm. The possible position is generated from real object-as describe on the Figure 4-14, the possible position is more often to overlap than general object. Thus, the association should be many to 1 association instead of 1 to 1 association. That is, many possible positions can be associated to single past predict position.
t-1
1t
1 2 3 4(a) (b) Figure 4-14 : Example of foreground occlusion in horizontal view (a)Stage t-1 (b) Stage at t
Existing objects represent by white circle, Possible position represent by cross
4.2.6. Grade Integration
After the previous step, we get three grades for single possible position from two tilted view analysis and possible position tracking. We would combine these three grades with reliability of each estimator. Thus, we define the confidence of each type of analysis method.
4.2.6.1. Confidence of Sub-region Analysis
As we described before, the grade of each column in sub-region window is reweight by a triangle function. Hence, the sub-region window which is shift slightly on y direction would still estimate the edge. But still there still has a disadvantage - when more than one sub-region window overlaps to each other, grade those sub-region windows would be correlated. For this reason, we take the analysis of sub-region window overlapped to another sub-region window lower reliable, the analysis of independent sub-region window is more reliable compared with the analysis of the sub-region window would overlap to another.
(a)
(b) (c)
Figure 4-15 : Example of sub-region overlaping
(a)source tilted image (b)possible position from horizontal view analysis (c)enlarge (a)image, possible position of (b) 1~3 project to 1~3 sub-region window; the overlap region between 2 and 3 make the reliability of 2,3 lower than sub-region window 1
The other element affecting the reliability is the reference color sample from horizontal view. As we mentioned before, the standard of similarity measurement is color sample from the horizontal view foreground. Because the color of foreground is not perfectly uniform, the reference color may not representative of foreground object in horizontal view. We describe the representative with variance of reference color, which is estimated simultaneous with reference color. The higher variance suggests the reference color is more unreliable.
1 2 3 1 2 3
(a) (b) Figure 4-16 : Exapmle of non-uniform foreground
(a) (b) are different foreground object in horizontal view, the reference color sample from (b) is more robust than reference sample from (a)
We describe the confidence of sub-region analysis with:
min ij i subregion referenceColor distance Confidence variance k Eq4-6distanceij represent the distance from sub-region window i to other sub-region j.
k is a parameter, represent the coefficient weighting two source of uncertainty. variancereferenceColor is variance of foreground color in horizontal view
4.2.6.2. Confidence of Possible Position Tracking
There are two factors that would influent the confidence of possible position
tracking Confidencepast
t , the confidence of past possible position
1combine
Confidence t and the confidence of association between current possible position and past predict possible position. To acquire the confidence of past possible position, we must calculate the total confidence of the three grade sources. The calculate formula would be describe later. The confidence of data association between current possible position and past predict possible position is defined with the distance between the positions. Once the distance is longer, the reliability of association would be lower. Thus, we set the confidence of possible position tracking as:
max 1 1 distance k past combine distance Confidence t Confidence t Eq4-7distancemax is the max distance which possible position can associate to past predict
position with.
distance is the distance between possible position and past predict possible position k is an adjustable parameter
4.2.6.3. Composing Grade from Each Analysis with Confidence
The principle of compose method can be described as follow; the grade from
more reliable estimator would influence the result grade,Gradecombine more. And the
confidence from two different grade combined would have a higher confidence,
combine
Confidence . The compose formulation is expressed as follows.
'
' '
combine combine A A A A
B B B B past past past past
Grade Confidence k Grade k Confidence k Grade k Confidence k Grade k Confidence
Eq4-8
' ' '
combine A A B B past past
Confidence k Confidence k Confidence k Confidence Eq4-9
A
Confidence is the confidence of sub-region window analysis from tilted camera A
B
Confidence
is the confidence of sub-region window analysis from tilted camera B
past
Confidence
is the confidence of information from possible position tracking
A k , ' A k ,k ,B ' B k , kpast and ' past
k are adjustable parameter of different analysis method
The Gradecombine would be taken as how each possible position might be real object.
From the before formula, we can expect, if the object on the screen is fixed, the confidence would be increase toward infinite. The information from tilted camera would be ignored if the confidence of possible position tracking is much larger than confidence of tilted view analysis. Hence, we must redefine the confidence formula
Eq4-9. The refine formula is following:
max
max min , 1 1 distance k past combine distanceConfidence t Confidence Confidence t
Eq4-10
The formula is almost as same as the previous ones except a max confidence of possible position tracking.
Data Combination
Tilted View Analysis from Camera A
Tilted View Analysis from Camera B GradeA , ConfidenceA GradeB , ConfidenceB Data Combination t t-1 GradeCombine , ConfidenceCombine GradeCombine , ConfidenceCombine t+1 Gradepast , Confidencepast
Figure 4-17 : Diagram of possible position analysis
4.2.7. Possible Position Arrangement
4.2.7.1. Original Arrangement
After getting every possible position’s grade, we would judge which possible position would be real and which position would be ghost. If no occlusion occurred, every foreground object in horizontal view should be mapped to one existed object (real) in 3D space. We want to find the best possible arrangement. Hence, the possible position arrangement should conform following demands:
Every foreground in horizontal view should be map to one corresponding object. The arrangement should maximum the sum of existed object grade.
The basic idea is list all possible position arrangements and sum up the grade for each type of arrangement. The arrangement having the maximum total grade would be our detect result.
Table 4-1 Algorithm of basic arrangement
define struct arrangement_state {
arrange_object = []; total_grade;
}
upper_stage = [ [] , 0 ];
for any horizontal object a in camera A for all upper_stage parrel to upper_stage
upper_stage
new_stage = [ [ upper_stage(arrange_object possible) position form (a,b) ] , upper_stage(total_grade) + grade of position from (a,b)];
end end end
(a) (b)
(c) (d)
Figure 4-18 : Example of arrangement step For 3-3 horizontal foreground objects
The complex of list all possible position is (n!). So the number of arrangement would be grown up very fast as we describe below.
Table 4-2 Number of arrangement of different foreground number
Foreground Object Number
in Horizontal View 1 2 3 4 5 6 7 8 Number of Arrangement 1 2 6 24 120 720 5040 40320
Thus, we must find methods to reduce the complexity. There are two kinds of pre-decision techniques we can apply - Viterbi algorithm and variance-include arrangement. A B C E F G H I J K L M N O P A B C E F G H I J K L M N O P A B C E F G H I J K L M N O P A B C E F G H I J K L M N O P
4.2.7.2. Viterbi algorithm
Viterbi algorithm is a dynamic programming method used to find the most possible sequence of hidden states. The algorithm must admit the following assumptions:
The observed and hidden events must be in sequences. Both events should be aligned.
The sequence must be first-order Markov. That is, the observed event at point t can only depend on point t -1.
The algorithm has many practical applications: decoding, voice recognition, DNA sequence analysis and fading communication channels. Here, we use it to speed up arrangement processing.
The other hidden property of Viterbi algorithm is the observed state at t that can be produced with more than one observed state at t-1. As we draw below, though the state we used in arrangement before is isolate to each other, the surplus horizontal foreground might be the same.
To adapt the arrangement list algorithm to use Viterbi algorithm, we need to change the description of each stage. The observed stage would be the surplus horizontal foreground objects instead of the arranged object. The new object arranged would be hidden state. Thus, the 3-3 arrangement processing would become:
Figure 4-19 : Commonality of different arrangement
B C
E F G H
Figure 4-20 : Example of transformed arrangement tree
The essence of Viterbi is making pre-decision before the end of processing. For example, The F and G state are same observed states; the grade of F is sum of possible position 1 and possible position 8, the grade of G is sum of possible position
2 and possible position 7. Because the states spread behind F and G would be the
same, we can pre-decide, and remove the objects set which has lower grade. We can do same operation to E and I, H and J state and the behind state. The graph of arrangement would be following:
Figure 4-21 : Example of arrangement with Viterbi algorithm
The circles next to line present the new object, the dotted line present the removed hidden state.
After we have arranged existing object that fit with every horizontal foreground, the existing object should be map to one corresponding object; that is, the forward algorithm is over. Then, we can start the backward algorithm to get the most possible exist arrangement. We list the object from the last state, and back trace to the initial state A. The result of our example would be 9 – 4 – 2.
Because possible arrange would be pre-decide in processing, the result from Viterbi algorithm would always same to original arrangement. We compare the total number of state in processing between original arrangement and Viterbi arrangement.
Original Arrangement Viterbi Arrangement 2x2 5 4 3x3 16 8 4x4 65 16 5x5 326 32 6x6 1957 66 7x7 13700 96
4.2.7.3. Variance-Include Arrangement
Before we introduce variance-include arrangement, we first introduce best select arrangement.
Table 4-3 Algorithm of best select algorithm
while exist(horizontal forground object not occuply with arrange_object) arrange_object = [ arrange_object max_grade_possible_position ]; end
Algorithm of best select algorithm is very simple: First, choose the maximum grade possible position, set object to the possible position. Then, remove the possible position which conflict with the new existed object, and reselect the position with maximum grade in the remaining possible position set. Though the complexity of this algorithm is O(n), which is very low compare to another method, the results from the algorithm may be wrong. For example,
(a)-1 (a)-2 (a)-3 (b)
Possible position 1 2 3 4 5 6 7 8 9
Grade 0.9 0.8 0.4 0.75 0.2 0.3 0.3 0.4 0.8
(c)
Figure 4-22 : Example and compare of best select algorithm
(a)The processing of best select algorithm, the total grade would be 1.9 (b)The best arrangement, the total grade would be 2.35
(c)Table of each possible position grade
The wrong arrangement would be cause of error grade measurement. And we have suggested the position, which might get wrong grade, have low confidence. Hence, we can build the arrangement method which could balance between speed and correctness with the confidence of each possible position.
Compare the difference between the two arrangement methods. For the original arrangement method, the arrangement tree would branch when existence object could set at different positions. In contracts, the best select algorithm chose only the most likely position. Hence, the best select arrangement tree would not have any branch.
1 2 3 4 5 6 7 8 9 1 2 3 4 5 6 7 8 9 1 2 3 4 5 6 7 8 9 1 2 3 4 5 6 7 8 9
(a) (b) Figure 4-23: Compare the original arrangement and best select arrangement (a)original arrangement (b)best select arrangement
The number of branches in variance-include algorithm is between the two above arrangement methods, the parallel branch only appears in necessary situation. Thus, the tree of variance-include arrangement might be the follow graph.
Figure 4-24 : Example of variance-include arrangement
We could adapt Viterbi algorithm to superior effective arrangement with the variance-include arrangement.
Figure 4-25 : Viterbi algorithm with variance-include
4.2.7.4. Possible Position Arrangement in Occlusion Situation
When objects are occlusion in single camera, the number of foregrounds in each camera would be unequal. Hence, we need to modify our algorithm for occlusion situation. We suppose occlusion only happened in single horizontal camera. Thus, the assumption could be changed to,
• Every foreground in horizontal view should be map to at least one existed object.
• Arrange as fewer existed objects as possible
• The arrangement should maximum the sum of existed object grade.
The modified algorithm would consist two parts. First, find the existence objects set with maximum total grade by arrangement algorithm we described before. And the algorithm would terminate with the fewer foreground in two horizontal cameras. Then, existence objects would be chose from possible position corresponding to surplus horizontal foregrounds without restriction from another camera.
1 2 3 4 5 6 7 8 9 1 2 8 7 9 4 6
(a) (b) (c) Figure 4-26 : Example of arrangement in occlusion situation (a)Original possible position
(b)Arrange object
(c)Find position with maximum grade along position 3, 7 ,B
4.2.8. Output data
After arrangement, we have the position of each existence objects. To connect our system with existed multi-touch applications, we could export those positions by TUIO protocol.
TUIO is an open framework protocol designed specifically to meet the requirements of multi-touch user interface. The protocol encodes the control data from a tracker application (for example, FTIR or resistance system) and sends it to any client application that supports multi-touch or tangible. It’s designed from recTIVision project, and has been adopted by several other projects related to multi-touch interface. Though it is not an official protocol, the widespread let it can be considered as a community standard. The basic of TUIO is Open Sound Control (OSC) – an interactive environments standard. Hence, the TUIO tracker or application could be easily implemented on any platform support OSC.
1 2 3 5 6 7 9 A B 4 8 C 1 2 3 5 6 7 9 A B 4 8 C 1 2 3 5 6 7 9 A B 4 8 C
Figure 4-27 : Example of using TUIO protocol in DI system
To communication independent platform with low latency, the transport method for TUI is the delivery of binary OSC data by sending UDP packets- which is faster than TCP packets. Thus, our system is embedded with the UDP server, and track positions of every existence objects for TUIO protocol.
Chapter 5. E
XPERIMENT
In our experiment, four cameras, Philips SPC900NC, are mounted on the screen in horizontal and tilted direction separately. Philips SPC900NC has 640x480
resolutions, 1300000 sensors, and are connected with computer by USB2.0. Black paper are used as the frame of screen, and PC is tested with Intel CoreTM2 Duo CPU running at 3.00 GHz and 3.25G RAM.
(a)
(b) Figure 5-1 :Experiment Equpment
(a) System overview (b) Cameras upon the corner of screen
Cameras Frame of Screen
Horizontal
Cameras
Tilted
Cameras
We then compare the accuracy of our algorithm with different screen content and object number by projecting them on different screen with projectors. In the first test, white background is projected on the screen. The second test is in multi-touch application progress. The least test would then detect objects when cartoon is playing on the screen. All scenes would be tested with 2 fingers restricted and with unlimited number fingers. The actions would be general gestures used in application - rotate, zoom-in/out, move or any other types of existing gestures. Then, we test the computation time of algorithm of different number of objects.
(a) (b)
Figure 5-2 Different screen contends of experiments
(a)White background (b)Multi-touch application (c)Playing Cartoon
(a)-1 (a)-2
(a)-3 (a)-4
(b)-1 (b)-2
![Figure 1-1: Screen of Control Application in Windows 7[1]](https://thumb-ap.123doks.com/thumbv2/9libinfo/8130000.166207/10.892.136.614.487.807/figure-screen-control-application-windows.webp)
![Figure 2-1: Resistive touch screen[6]](https://thumb-ap.123doks.com/thumbv2/9libinfo/8130000.166207/12.892.166.608.800.1067/figure-resistive-touch-screen.webp)
![Figure 2-2: 4-corner Surface Capacitive Touch Screen[7]](https://thumb-ap.123doks.com/thumbv2/9libinfo/8130000.166207/13.892.154.664.442.926/figure-corner-surface-capacitive-touch-screen.webp)
![Figure 3-1 :The experiment results from Michotte[19]](https://thumb-ap.123doks.com/thumbv2/9libinfo/8130000.166207/24.892.137.678.438.884/figure-the-experiment-results-from-michotte.webp)
