Department of Business Administration
I-Shou University
Master Thesis
Solutions to improve quality of human resources at the
Construction Tourism Trade Phuong Nam Company in
Viet Nam
Advisor: Ching-Chung, Guey, Ph.D
Co-advisor: Bui Thi Mong Trang, Ph.D
Graduate Student: Nguyen Hoang Long
ACKNOWLEDGEMENTS
First, I want to thank all the teachers of ISHOU University who have equipped me with wide valuable knowledge over time.
I especially thank Professor Guey, Ching-Chung, who has guided scientific dissertation, has instructed me practical approach to detect topics and has dedicated instructions to completing this thesis. In particular, I am extremely grateful and thankful to Professor Ching-Chung, Guey and Professor Bui Thi Mong Trang, who show their interests, coach my learning process, and render guidelines and suggestions in the course of my thesis completion.
Finally, I am grateful for my family, colleagues, friends and relatives, who have supported me enthusiastically help during my study and research.
Author: Nguyen Hoang Long
ABSTRACT
The thesis aims to explore factors influencing job satisfaction at the Construction Tourism Trade Phuong Nam Company. Through the findings of the thesis, the author expects to offer some solutions to the managmeent of Phuong Nam Company to improve job satisfaction in the company and its human resource quality. The study consists of two stages: preliminary research and official reseach. In the preliminary research, the author identify 6 factors that may influence job satisfaction. In the official research, the result shows that there are 6 factors affecting job satisfaction: (1) Work, (2) Salary, (3) Opportunity to develop, (4) Colleague, (5) Leaders, (6) Work process.
Keywords: job satisfaction, work, salary, opportunity to develop, colleague, leaders, work process
TABLE OF CONTENTS
ACKNOWLEDGEMENTS ... I ABSTRACT ... II TABLE OF CONTENTS ...III LIST OF FIGURES ... VI LIST OF TABLES ... VII
CHAPTER 1 INTRODUCTION ... 1
1.1 RESEARCH BACKGROUND ... 1
1.1 Research objectives ... 1
1.2 Research questions ... 2
1.3 Scope and methodology of research ... 2
1.4 Significance of research ... 2
1.5 Structure of the thesis ... 3
CHAPTER 2 LITERATURE REVIEW ... 4
2.1 Overview of human resource management ... 4
2.1.1 Concept, role and meaning of human resource management ... 4
2.1.2 Purpose of Human resource management ... 4
2.1.3 The basic functions of human resource management ... 5
2.1.4 Labors require administrations ... 6
2.2 Concept job satisfaction of staff ... 7
2.2.1 Definition of employee satisfaction ... 7 iii
2.2.2 The nature of job satisfaction... 8
2.3 Job satisfaction theories ... 8
2.3.1 Theory of Maslow's hierarchy of needs ... 8
2.3.2 Hertzberg’s two-factor theory ... 10
2.3.3 ERG Theory ... 10
2.3.4 Expectancy theory ... 11
2.3.5 Adams equity theory ... 11
2.4 Proposed research hypotheses ... 12
2.5 Overview the construction tourism trade Phuong Nam Company ... 13
2.5.1 Introduction about company ... 13
2.5.2 . Material facilities ... 14
2.5.3 Business statement ... 14
2.5.4 Organizational diagram... 14
CHAPTER 3 RESEARCH METHODOLOGY ... 16
3.1 Research methods ... 16
3.2 The preliminary research ... 16
3.2.1 Interviews ... 16
3.2.2 Questionnaire design ... 17
3.2.3 Adjusted scale ... 17
3.3 Sampling design ... 18
3.4 Data analysis plan ... 18
3.4.1 Planning data collection. ... 18
3.4.2 Describing research sampling ... 18
3.4.3 Evaluating scale through Cronbach Alpha significant Coefficient ... 18
3.4.4 Exploratory factor analysis: ... 19
3.4.5 Regression analysis ... 19
CHAPTER 4 RESEARCH RESULTS ... 21
4.1 Descriptive statistics... 21
4.2 Evaluating scale based on Cronbach Alpha ... 22
4.3 Evaluating scale by using Exploratory Factor Analysis efa. ... 24
4.4 Official research model ... 29
4.5 Testing research model through regression method ... 30
4.5.1 Testing correlation between the variables ... 30
4.5.2 Regression analysis ... 32
CHAPTER 5 CONCLUSIONS AND RECOMMENDATIONS ... 34
5.1 Conclusions ... 34
5.2 Limitations and recommendations ... 34
5.2.1 Limitations ... 34
5.2.2 Recommendations ... 34
REFERENCES ... 37
APPENDIX ... 38
Questionnaire ... 38
Table coding variables ... 42
LIST OF FIGURES
Figure 1 : Proposed Research Model ... 13 Figure 2 : Organizational diagram Phuong Nam Company ... 15 Figure 3 : The research model studying factors affecting Quality of human resources 29
LIST OF TABLES
Table 1 The elements in Maslow's hierarchy of needs ... 9
Table 2 : Gender ... 21
Table 3 : Age ... 21
Table 4 Working ... 22
Table 5 : The Cronbach alpha coefficients of components: ... 22
Table 6 : the KMO and Bartlett's component measurement coefficient of factors affect the Quality of human resources. ... 24
Table 7 : Extraction Sums of Squared Loadings 1st... 25
Table 8 : Exploratory Factor Analysis 1st ... 26
Table 9 : Extraction Sums of Squared Loadings 2st ... 27
Table 10 : Exploratory Factor Analysis 2st ... 28
Table 11 : Correlation matrix between the variables ... 31
Table 12 : Regression analysis ... 32
Table 13 : The statistical parameters of each variable in regression function ... 32
Table 14 : The constituents quality of human resources of Phuong Nam Company ... 34
Table 15 : Scale is encoded ... 42
Chapter 1 Introduction
1.1 Research background
This topic of the present study is based on three background facts.
Firstly, today laborers are considered as an extremely precious asset and resource which decide a company’s survival. Especially in market economy, face up to strong fluctuation of business environment and fierceness of competition, also employee’s demands- which are rising every day, all these problems have been a large pressure to company. A company can raise their competitive advance by organizing effective human resource. To get it firstly, administrators should help employees achieve their targets. Administrators should be aware of the fact that if the personal targets of employees are forgotten, their productivity will be decreased. Feeling unsatisfied, employees will leave. Therefore, study and judge employees’ satisfaction is very necessary.
Secondly, with high ratio of quitting job in company during recent years, by analyzing human resource quality’s judgment, company could understand more clearly human resource’s statement and know which may satisfy and may not satisfy their employees. Thereby, company can offer policies in order to improve current human resource’s quality.
Thirdly, until now, there’s no research which rates human resource’s quality at company. Besides that, there are also many complaints from employees to company about unfair policy of wage and reward, quality of work environment, employees haven’t had a chance to prove themselves.
From the above facts, the topic “Solutions to improve quality of human resources at the Construction Tourism Trade Phuong Nam Company” is chosen.
1.1 Research objectives
This author aims to explore factors influencing job satisfaction. Through the findings, the author expects to find solutions to improving quality of human resources at the Construction Tourism Trade Phuong Nam Company. Specific research objectives are as follows:
Building a job satisfaction research model of employees at the Construction Tourism Trade Phuong Nam Company.
Building a scale to test the job satisfaction of employees.
Testing the hypotheses and finding factors influencing job satsifaction of employees at the Construction Tourism Trade Phuong Nam Company.
Recommending solution to improve job satisfaction of employees at the Construction Tourism Trade Phuong Nam Company.
1.2 Research questions
1. What is the level of job satisfaction of staff at the Construction Tourism Trade Phuong Nam Company?
2. Which factors influence job satisfaction of staff at the Construction Tourism Trade Phuong Nam Company?
3. What is your solution to improve the satisfaction of staff at the Construction Tourism Trade Phuong Nam Company?
1.3 Scope and methodology of research
The subject of the research is staff at the Construction Tourism Trade Phuong Nam Company.
The scope of the research is current staff at the Construction Tourism Trade Phuong Nam Company.
The author applied both qualitative and quantitative research methods in the thesis. The qualitative research method is used for the preliminary research and the quantitatve research method is used for the official research. The research last from March, 2015 to November, 2015. Data was analyzed through the statistical software SPSS version 20.
1.4 Significance of research
The significance of the study including:
Assess the level of job satisfaction of staff at the Construction Tourism Trade Phuong Nam Company.
Provide leaders and managers of the Construction Tourism Trade Phuong Nam Company the knowledge of factors influencing job satisfaction of employees in the company so that they can come up with better solution to improve job satisfaction.
1.5 Structure of the thesis
The study is divided into five chapters with contents as follows:
Chapter 1 Introduction Chapter 2 Literature Review Chapter 3 Research Methodology
Chapter 4 Research Results and Analysis Chapter 5 Conclusions and Recommendations
The final section of the thesis is a list of references and appendices
Chapter 2 Literature review
2.1 Overview of human resource management
2.1.1 Concept, role and meaning of human resource management
2.1.1.1 Concept
Human resource is based on the concept that every personnel in an organization has certain roles and they are all linked by common goals. However, human resource is difference to other resouces because of the specific characteristics of human. Each employee is different to one another in terms of capability and traits. Besides, employees also have potential to develop, the competent to form teams and union to protect their benefits, the ability to assess and question about activities of managers. Thus, it is more difficult for managers to mange human resource in comparison to other resources.
In general, human resource management is a system of policies, philosophy and function in how to attract, develop and retain personnel for an organization to achieve mutual benefits.
2.1.1.2 Role and meaning of Human resource
Human resource management provide managers with concrete knowledge on how to interact and develop with personnels and to achieve desirable goals through them. It also helps managers to precisely assess their employees and motivate them at work to get higher results. Besides, human resource management also involves recruitment, training and retaining of employees.
2.1.2 Purpose of Human resource management
Human resource management studies issues about people management in one organization at the micromanage with two basic purposes as below:
• Effective use of human resource to improve the productivity and effectiveness of an organization
• Improve employee’s satisfaction, motivation and loyalty toward their organization.
2.1.3 The basic functions of human resource management
Human resource management involves issues upon obligations, rights, and responsibilities of employees. The range of these activities are diverse due to the difference in the structure and resources of each organization. In general, human resource management can be divided into three categories: attract, train and develop.
2.1.3.1 Functional group of attracting human resource
This function covers the task of ensuring an organization can have sufficient number of employees with necessary knowledge and skills. To fulfill this task, a human resource manager must review his/her company’s business plan, productivity and evaluate the performance of its current workforce to decide whether the company needs more employees and which position should be employed. The tasks involve in this group are human resource planning, job analysis, recruitment and job integration.
2.1.3.2 Functional group of training and developing
This function focuses on how to improve the ability of employees so that they meet the increasing demand of their jobs. It also involves creating convenient condition for staff to develop their knowledge and skills for works.
Training is a systematic process to accumulate and improve knowledge and skills of employees so that they can fulfill the increasing requirement of their jobs. Developing is a process of learning for employees in preparation for future direction of the organization. The developing function may include:
• Roles of training and developing • Directly support staffs to work better.
• Update new knowledge and techniques for staffs. • Avoid out-of-date management.
• Guide the new jobs for new staffs.
• Prepare for the team of manager staffs and the nearest specialization • Satisfy the developing demand of staffs.
2.1.3.3 Functional group of maintaining human resource
This function emphasizes the act of retaining and effectively using human resource. The function involves two tasks: (1) stimulating and motivating employees, (2) retaining employees
- Stimulating and motivating function: This function emphasizes the encouragement and motivation of employees to ensure that they are motivated, enthusiastic and responsible at work.
- Labor relation function: This function focuses on ensuring a suitable working environment and work relation with activities such as making contracts, solving dispute, complaints, healthcare, insurance and work safety.
2.1.4 Labors require administrations Regarding job
• Job safety • Interesting job
• Opportunity to prove abikity • Stability
Regarding working conditions
• Suitable workplace • Proper facilities • Suitable timetable
The individual rights
• Respecting individual characteristics
• Being considered as an important part of organization • Able to propose ideas to superiors
• Participate in decision making
• Understand clearly the requirements of organization 6
• Being treated and judged farily
Wages and benefits
• Fair system of benefits and wage • Pays match employees’ contributions
Chances of training and promoting
• Equal opportunity in promotion
• Equal opportunity in learning new skills
• Equal opportunity in training and development • Being recognized by superiors
• Improved living standards
2.2 Concept job satisfaction of staff
2.2.1 Definition of employee satisfaction
After reviewing various studies, it can be said that there are many definitions of job satisfaction.
Arnold and Feldman (1986) said that job satifaction is the sum of positive feelings of employees toward their jobs. Spector (1996) proposed that job satisfaction is not only about general feelings of employees toward their jobs but also their feelings toward various facet of work. In the light of his theory, Spector (1996) suggested that the study of job satsifaction can be divided into two approaches: the global approach and the facet approach. Fraser (1983) also proposed similar ideas to that of Spector as he stated that job satisfaction is not a unitary factor. Thus, an employee may feel satisfied with one factor of his/her work but still display dissatisfaction toward another. Robbins (2001) suggested that job satisfaction is a person’s attitude toward job. In other words, a satisfied personnel displays positive attitude toward work while a dissatisfied personnel shows negative attitude toward work.
Researchers at the University of Minnesota proposed 20 extrinsic and intrinsic factors comprising job satisfaction (Weiss, Davis, England and Loquist, 1967). In
Cornell University, researchers also developed the Job Descriptive Index which relies on five factors including: pay, coworkers, work, promotion and supervision to measure job satisfaction (Smith, Kendall, and Hulin, 1969).
Luthans (2005) suggested three dimensions of job satisfaction including (1) emotional response to job, (2) how well outcomes meet or exceed expectations and (3) job related attitude.
2.2.2 The nature of job satisfaction
Studies have shown that there is a link between job satisfaction and job motivation (Hollyforde, 2002). Researches show a positive correlation among job satisfaction, motivation and employee performance (Hollyforde, 2002). According to Kreitner et al (2002) job satisfaction is an affective and emotional response to various facets of one’s job. Woods et al (2004) said that job satisfaction appears when an employee become attached with his/her organization to the extent that the employee strive to meet the job demand and commit to his/her job.
According to Locke (1968), it is important to make a distinction between morale and attitude when judging job satisfaction. Morale refers to the extent to which a person’s needs are met and how that person perceive the satisfaction drawn from the job. Attitude is the evaluation that drive personal act. Attitude comprises of cognitive, bevharioral and affective aspects.
Thus, it is important for managers to pay attention to employee’s attitude because job satisfaction tend to decrease faster than increase. Staw (1977) proposed that managers should try to improve employee’s satisfaction both in life and at work as they all contribute to job satisfaction.
2.3 Job satisfaction theories
Among many studies on job satisfaction, there are some popular theories which are usually mentioned
2.3.1 Theory of Maslow's hierarchy of needs
In his theory, Maslow (1970) proposed that people are driven to work to satisfy their needs. Based on this proposal, Maslow developed a hierarchy of needs with 5 stages.
The hierarchy of needs displays people’s needs from basic to high level and people have to feel satisfied at low level of needs before moving to the higher one. Physiological needs are the most basic level for every person while self-actualization is the highest one. For people who are struggling in the basic levels like physiological or safety, they tend to be less concerned with the needs at the high level like self-actualization.
Low demand: Low demand is usually easier to be satisfied. It is limited and mostly satisfied from the external source.
Physiological needs: Refers to the basic needs required to sustain life.
Physiological needs include food, air, water, housing, etc. In an organization, these needs are salary and working conditions.
Safety needs: include risk avoidance, security, protection. Safety includes both
physical and spritual safety. In business it can be contracts, social insurance policy, safe jobs and long-term ones.
High demand: High demand is more difficult to satisfy and are mainly from internal source.
Social needs: Refers to the need to mainting good relationship with people
around. In an organization, this need is displayed through the expectation of building and maintaing good relationship with colleagues and superior.
Self-esteem: Refers to the need of having high status and being recognized and
respected by people. In a company, this need is fulfilling through reward, promotion or public recognition.
Self-actualization: The highest level of needs in the hierarchy and thus, the most
difficult one to attain. This level refers to the personal development and self-improvement needs. When a person is satisfied with the lower levels of needs, it is likely that person aim to develop personal knowledge and skills to become a better and more competent individual. An organization can boost this level by opening equal opportunities for every person to advance and improve. The organization may open training courses to help employees to improve their knowledge and skill. It can also create convenient conditions for employees such as granting time or tuition for employees to attend classes. The elements in the hierarchy of needs is shown in Table 1.
Table 1The elements in Maslow's hierarchy of needs
Demands Are made at working places
Self-actualization Training, promotion and development
Self-esteem Recognition
Social needs Good relationship with colleagues and leaders
Safety Safe jobs and long-term jobs
Physiological needs Working conditions (temperature, air), wages
2.3.2 Hertzberg’s two-factor theory
Based on Maslow’s theory of needs, Herzberg (1959) proposed his two-factor theory on job satisfaction. The two-factor theory relies on the idea that there are factors leading to satisfaction and factors leading to dissatisfaction. Herzberg (1959) claimed that what makes people happy is what they do or the way they’re utilized and what makes people unhappy is the way they’re treated. Herzberg coined two terms “motivators” and “hygiene factors”. Motivators refer to factors creating positive satisfaction. Some factors are seen as motivators are recognition, work challenge, involvement in decision making. Hygiene factors refer to factors that do not create satisfaction but will lead to dissatisfaction if hygine factors disappears. Hygine factors could be salary, job security, work condition.
The contribution of Herzberg’s theory is that managers now must pay attention to both motivators and hygiene factors. Motivating factors are related to work itself while dissatisfying factors are linked to work environment. Thus, managers who want to increase job satisfaction should improve motivating factors (motivators) and reduce the effect of dissatisfying factors (hygine factors).
2.3.3 ERG Theory
Developed by Alderfer, ERG theory refers to three levels of needs including: (1) existing demand, (2) relation demand and (3) growing demand.
Existing demand: refers to physiological needs and safety
Relation demand: refers to social needs and partly self-esteem needs.
Growing demand: refers to self-esteem needs and self-actualization needs
However, a major difference between ERG theory and Maslow’s hierarchy of needs is that according to ERG theory, people tend to pursue various needs at once instead of climbing the hierarchy of needs like the proposal of Maslow. Another difference is that Alderfer proposed that if a need is blocked, people will strive to satisfy other needs.
2.3.4 Expectancy theory
Vroom (1964) developed the expectancy theory based on the idea that people will be motivated to work if they feel that the outcome of work match their expectation. Vroom (1964) stated that the motivation of work is decided by the value people put into their effort multiplied by their valance. A major difference of Vroom’s theory is that it emphasize on the effect of work outcome instead of human’s needs. According to Vroom (1964), the formula of motivation can be written as follow:
Motivation = Valance x Expectancy
The core principle of Vroom’s theory is the linkage between effort, performance, reward and personal goals. Based on this theory, it can be said that the motivation to work depends on the perception of employee whether the work outcome worth their efforts. If employees feel that the outcome is worthwhile, they will be motivated to work. However, Vroom suggested that there is no universal rule to explains human motivation. Thus, his theory should be regarded as a contingency model.
2.3.5 Adams equity theory
The equity theory was developed by Adams in 1963. The theory is based on the idea that employees in an organization always expect to be treated fairly. Thus, they tend to make comparison between their contributions and rewards they and their colleagues receive. From this comparison, Adams suggested three scenarios that may happen:
- Employees will maintain their current working performance if they think that they are being fairly treated, and getting suitable incentives and rewards.
- Employees will be unhappy and work less effectively if they think they are being treated unfairly at work.
- Employee are happy and display higher performance if they feel that they are being treated fairly and getting rewards and incentive higher than expectation.
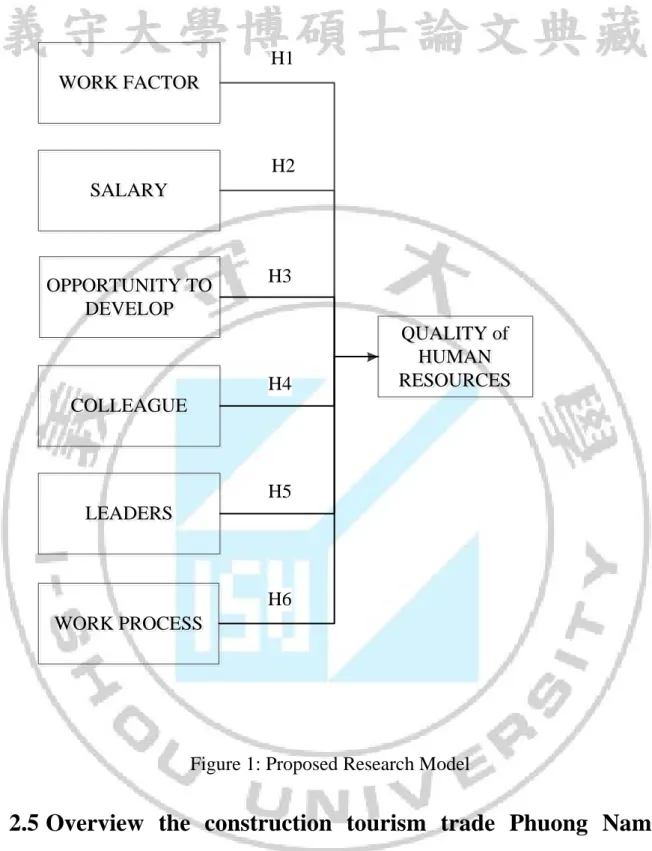
2.4 Proposed research hypotheses
Based on the major theories upon job satisfaction and motivation mentioned previously, the author propopsed a research model for this thesis as shown in Figure 2.
Based on the model, there are 6 hypotheses proposed for the study. H1: Work factor is positively related to the quality of human resources H2: Salary is positively related to the quality of human resources
H3: Opportunity to develop is positively related to the quality of human resources H4: Colleague is positively related to the quality of human resources
H5: Leaders are positively related to the quality of human resources H6: Work process is positively related to the quality of human resources
SALARY SALARY H2 QUALITY of HUMAN RESOURCES QUALITY of HUMAN RESOURCES WORK FACTOR WORK FACTOR H1 OPPORTUNITY TO DEVELOP OPPORTUNITY TO DEVELOP COLLEAGUE COLLEAGUE LEADERS LEADERS H3 H4 H5 WORK PROCESS WORK PROCESS H6
Figure 1: Proposed Research Model
2.5 Overview the construction tourism trade Phuong Nam
Company
2.5.1 Introduction about company
Construction Tourism Trade Phuong Nam Company is a company in area of restaurant, hotel, tourism, transportation and traffic project, technical infrastructure
In 12 April 2004, the Planning and Investment Department gave company Business Registration Certificate number 3700568604 as Vietnamese Enterprise Law.
Main business lines:
- Hotel, restaurant, tour operation, civil engineering and technical infrastructure construction; entertainment service.
2.5.2 . Material facilities
Building department with machines , modern equipment and team of young and active engineers and staffs.
Series of restaurant, tourist service and 3 stars-hotels , certificated by Vietnam National Administration of Tourism, adapted domestic and foreign customers’ need.
2.5.3 Business statement
In general, since starting the business in 2007, the incomes and profit have had tendency to increase. However, in 2013, total incomes and profit was less than 2012. Total revenue and earnings from construction activities decreased more than ones from hotel and restaurant operation activities. Main cause is from the affection of international economy to Vietnam. Till 2014, this revenue raise again as Vietnamese economy recovered and the company had a suitable plan for marketing, employing and training.
2.5.4 Organizational diagram
Figure 2: Organizational diagram Phuong Nam Company
Director is overall leader and has the highest authority determining operation methods, modes and management to all company’s activities following rules, general charge and take responsibility under the law.
Vice directors are partner and support the director, bear the responsibility to director for sectors assigned by director. The duty assignment for vice directors is expressed in allocation texts and accommodating to specific period.
Accounting sector in charge of keeping business account of revenues and cost in construction and hotel- restaurant range through the operation of vice directors. Executive and HR sector take care of recruiting, nominating and arranging staffs that agree with their ability and major, assigning machines, equipments and transportation for the leaders.
Supervise- managing sector under direction of vice directors about supervising, managing assigned employed team
Director Vice director (construction) Vice director (Hotel- restaurant- tourism) Accounting- Excecutive and HR Design – constructio n team Hotel team Restaur ant team Materia l team Mater ial team Supervise-
managing sector managing sector Supervise -
Chapter 3 Research Methodology
In this chapter, the author mentioned the design of the research which refers to stages of the research and methods that were applied. The author also mentioned the sampling design, questionnaire design and analysis tools that were used to collect and analyze data for the research.
3.1 Research methods
In this thesis, the author applies both qualitative research method and quantitative research method. The qualitative research method is used in the preliminary research to help the author identify factors that may have influence on job satisfaction. At this step, the author conducts interviews with both leaders and employees of Construction Tourism Trade Phuong Nam Company to explore their opinions and suggestion on factors related to job satisfaction. Through the data collected from the interviews, the author build a scale and test its reliability and validity. When the scale is deemed suitable for the research, the author deliver questionnaires to participants to collect data for the quantitative research. In the quantitative research, the author runs the regression analysis to find factors influencing job satisfaction.
3.2 The preliminary research
3.2.1 Interviews
The author conducted interviews with both management and employees of Phuong Nam copmany. The interviewees are:
• Director of Phuong Nam • Vice President of Phuong Nam • Chairman of the Trade Union • Leader Human Resource • 6 staff of Phuong Nam
The process of interviews
1. The author introduces the subject and the purpose of in-depth interviews 16
2. Common sense of job satisfaction when working at Phuong Nam Company.
3. What factors cause the most satisfaction when working at Phuong Nam Company.
4. Measurement of satisfaction as factors of the first draft scale questionnaire, compared with actual the appropriate goods not.
5. In the process if the staff does not understand the content or the need to add other variables to measure certain factors, the authors add the necessary content.
6. Results of the interviews are used to amend the appropriate questionnaire than mobile app.
Qualitative research results are listed in scale study
3.2.2 Questionnaire design
The questionnaire include two parts:
Part I: Survey on Job Satisfaction. There are 27 items in this part.
Part II: Demographic Information (gender, age, working experience, etc.)
The author first delivered question to 20 participants and used the result to check the reliability of the scale. After checking the scale’s reliability, the author adjusted the scale and used it for the official survey.
3.2.3 Adjusted scale
According to Hoang & Chu (2008), there are four types of scales including nominal scale, ordinal scale, interval scale, ratio scale. In this study, the authors used only two types of scales: nominal scale, andinterval scale.
In Part I of the questionnaire, the author uses 5-point Likert scale (1-Strongly Disagree, 2-Disagree, 3-Neutral, 4-Agree and 5-Strongly Agree) to assess the extent of agreement of participants upon each statement. Results from this part will help the author to run the reliability test and regression analysis to explore factors influencing job satisfaction.
In Part II of the questionnaire, the author asks for demographic information to explore the specific detail of samples and the difference among them.
The questionnaire can be found in the Appendix of the thesis.
3.3 Sampling design
The author uses the quantitative research method in the official research. In this stage, the author runs different analyses to test the scale and hypotheses.
The author conducted survey on managers and employees of Phuong Nam Company. The author delivered 250 questionnaires to participants directly. The author received answers from 200 participants. After inputing and cleaning data, there were 175 answers accepted for the analysis.
3.4 Data analysis plan
3.4.1 Planning data collection.
The author collected data through the survey on management and employees at Phuong Nam company. Questionnaires are handed directly to participants. After collecting answers from participants, the author input and clean data, then proceed to analyze data.
3.4.2 Describing research sampling
The author use the descriptive statistics information such as gender, age, salary to show the sample specific details and the difference among groups of participants.
3.4.3 Evaluating scale through Cronbach Alpha significant Coefficient
The purpose of this test is to determine which question item really contributes to assess the concepts in the study. The variables that have the item-total correlation less than 0.3 will be removed and only variables with the item-total correlation higher than 0.6 are chosen. Though there are researchers that require the correlation higher than 0.8, however, if the concepts are new to respondents, it is acceptable to have Cronbach’s Alpha value higher than 0.6 (Nunnally, 1978; Peterson, 1994; Slater, 1995).
3.4.4 Exploratory factor analysis:
After running Cronbach’s Alpha test, the EFA test is used to reduce the number of items. This method is useful for identifying the groups of variables and exploring the relationship between variables. There are several values needed to look at in the EFA test.
Factor Loadings is the correlation coefficient between variables and factors. System load factor of greater than 0.3 is said to be consistent with a larger sample size of 150 observations.
Bartlett’s Test of Sphericity: The test is used to test the null hypothesis H0. The Barlett’s Test has significant value lower than 0.05, the null hypothesis is rejected.
KMO (Kaiser-Meyer – Olkin) value: The KMO value should range from 0.5 to 1. If it is lower than 0.5, the factor analysis is no longer suitable.
Cumulative of variance is the variance percentage was explained by all the factors. Criteria for acceptance factor analysis with cumulative variance greater than 50% with Eigenvalue must be greater than 1.
Rotated component matrix: Variables that have factor loading value lower than 0.45 will be removed. The study used the principle components method that requires the factor loading higher than 0.45 to fit the model.
Bartletti’s Test of Sphericity: The Sig. value should be lower than 0.05 to prove that variables are not correlated with the overall scale.
3.4.5 Regression analysis
After analyzing the factors exploring EFA, the multiple regression analysis will be ran to investigate the relationship between the independent constructs and the dependent construct. The regression analysis also provides information on the influence level of each independent construct on the dependent factor. The formula of the regression is:
In which:
SAT: Customers’ satisfaction
F = {F1, ...,Fj}: The variable scale factors affect the SAT β = {β0, ..., βj}: regression coefficient impact on SAT ei: error
Chapter 4 Research results
The results include descriptive statistics, reliability test, exploratory factor analysis, correlation analysis, regression analysis, ANOVA and T-test
4.1 Descriptive statistics
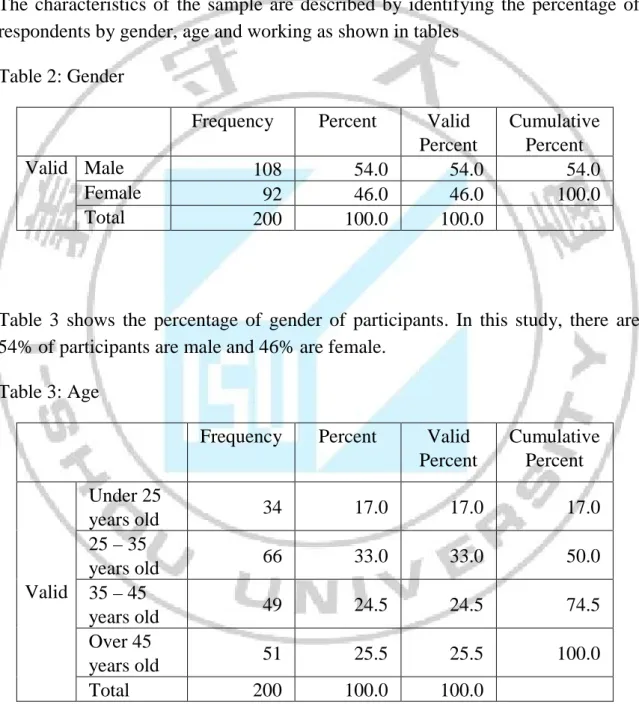
The characteristics of the sample are described by identifying the percentage of respondents by gender, age and working as shown in tables
Table 2: Gender
Frequency Percent Valid
Percent Cumulative Percent Valid Male 108 54.0 54.0 54.0 Female 92 46.0 46.0 100.0 Total 200 100.0 100.0
Table 3 shows the percentage of gender of participants. In this study, there are 54% of participants are male and 46% are female.
Table 3: Age
Frequency Percent Valid
Percent Cumulative Percent Valid Under 25 years old 34 17.0 17.0 17.0 25 – 35 years old 66 33.0 33.0 50.0 35 – 45 years old 49 24.5 24.5 74.5 Over 45 years old 51 25.5 25.5 100.0 Total 200 100.0 100.0 21
Regarding age of participant, there are 17% of participants are under 25 years old. 33% of participants are in the age group from 25 – under 35. 24.5% are in the age group from 35 – under 45 years and 25.5% is over 45.
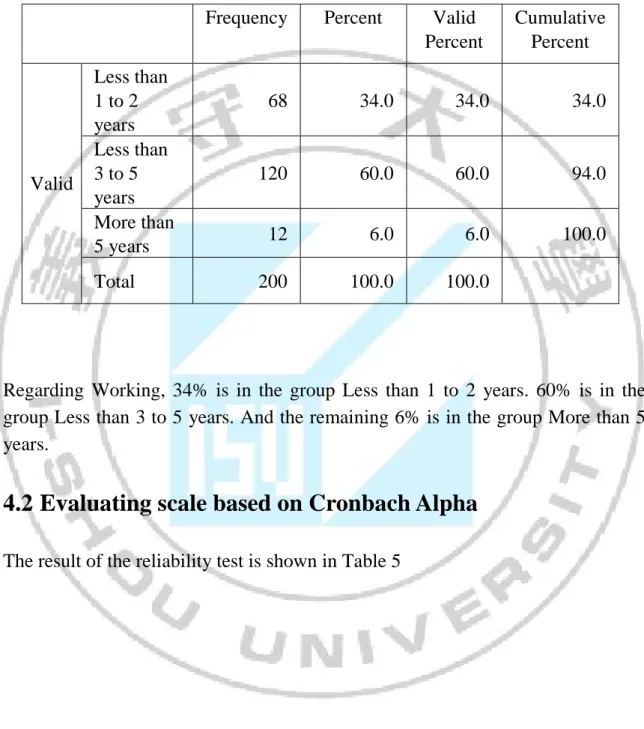
Table 4: Working
Frequency Percent Valid
Percent Cumulative Percent Valid Less than 1 to 2 years 68 34.0 34.0 34.0 Less than 3 to 5 years 120 60.0 60.0 94.0 More than 5 years 12 6.0 6.0 100.0 Total 200 100.0 100.0
Regarding Working, 34% is in the group Less than 1 to 2 years. 60% is in the group Less than 3 to 5 years. And the remaining 6% is in the group More than 5 years.
4.2 Evaluating scale based on Cronbach Alpha
The result of the reliability test is shown in Table 5
Table 5: The Cronbach alpha coefficients of components 22
Scale Mean if Item Deleted Scale Variance if Item Deleted Corrected Item-Total Correlation Cronbach's Alpha if Item Deleted Work Factors (WOR) Alpha: .780
WOR1 10.05 6.108 .555 .743
WOR2 10.47 5.165 .705 .662
WOR3 10.28 5.037 .707 .659
WOR4 10.58 5.964 .408 .822
Salary Factors (SAL) Alpha: .884
SAL1 12.87 11.957 .726 .858
SAL2 12.81 11.726 .761 .849
SAL3 12.90 10.975 .846 .828
SAL4 12.79 11.456 .807 .838
SAL5 12.65 13.557 .479 .911
Opportunity to develop Factors (OTD) Alpha: .857
OTD1 15.54 7.526 .766 .801
OTD2 15.55 8.119 .622 .842
OTD3 15.20 8.472 .749 .811
OTD4 15.22 8.622 .728 .816
OTD5 15.73 8.743 .537 .862
Colleague Factors (COL) Alpha: .827
COL1 10.55 5.877 .588 .811
COL2 10.99 5.201 .728 .747
COL3 10.62 5.393 .672 .773
COL4 10.72 5.712 .627 .794
Leaders Factors (LEA) Alpha: .882
LEA1 9.86 8.845 .823 .816
LEA2 9.82 8.584 .837 .810
LEA3 9.51 9.407 .698 .866
LEA4 9.43 10.146 .623 .892
Work process Factors (WPR) Alpha: .777
WPR1 10.57 4.437 .798 .605
WPR2 10.48 4.472 .730 .640
WPR3 10.45 6.500 .202 .900
WPR4 10.53 4.803 .681 .671
As shown in Table 5, the Cronbach’s Alpha coefficients of all factors are higher than 0.6, signifying the reliability of the each factor. Besides, the Corrected Item – Total Correlation values of all observed variable are also higher than 0.5, thus, no observed variable is deleted from the scale. Based on this result, the author decided that the scale is reliable and can be used for the official research.
4.3 Evaluating scale by using Exploratory Factor Analysis efa.
After conducting Cronbach’s Alpha test. the EFA test is used to reduce the number of items. This method is useful for identifying the groups of variables and exploring the relationship between variables.
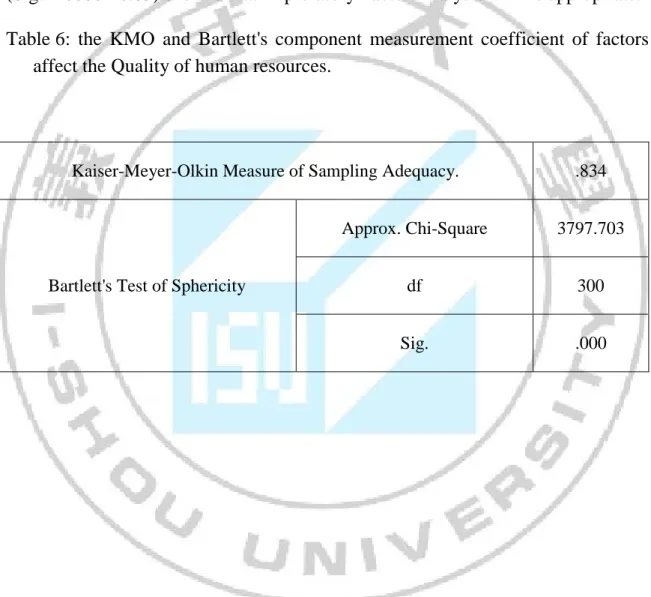
Testing KMO and Bartlett's in the factor analysis showed that the coefficient of KMO high (equal to 0.834 > 0.5) testing Bartlett's value with significance level (Sig. = 0000 <0.05) showed that Exploratory Factor Analysis EFA is appropriate. Table 6: the KMO and Bartlett's component measurement coefficient of factors
affect the Quality of human resources.
Kaiser-Meyer-Olkin Measure of Sampling Adequacy. .834
Bartlett's Test of Sphericity
Approx. Chi-Square 3797.703
df 300
Sig. .000
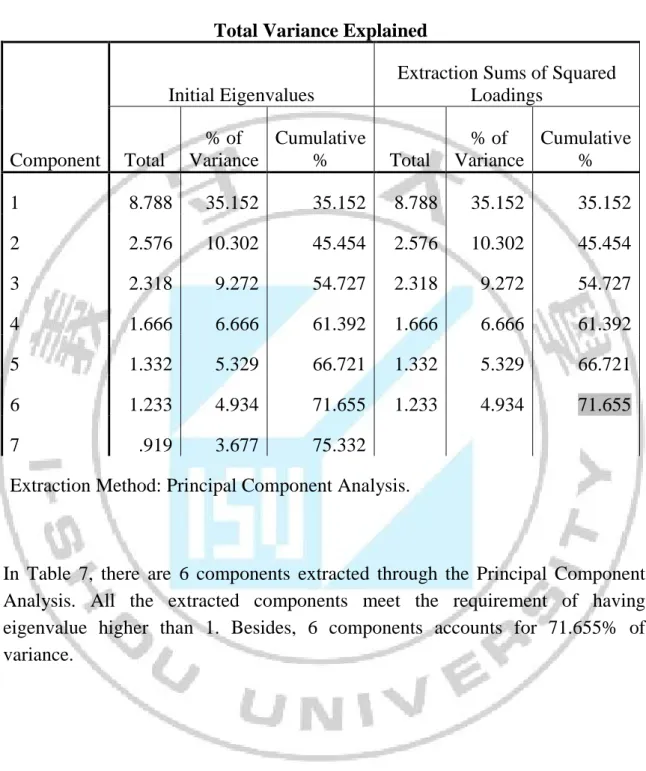
Table 7: Extraction Sums of Squared Loadings 1st
Total Variance Explained
Component
Initial Eigenvalues
Extraction Sums of Squared Loadings Total % of Variance Cumulative % Total % of Variance Cumulative % 1 8.788 35.152 35.152 8.788 35.152 35.152 2 2.576 10.302 45.454 2.576 10.302 45.454 3 2.318 9.272 54.727 2.318 9.272 54.727 4 1.666 6.666 61.392 1.666 6.666 61.392 5 1.332 5.329 66.721 1.332 5.329 66.721 6 1.233 4.934 71.655 1.233 4.934 71.655 7 .919 3.677 75.332
Extraction Method: Principal Component Analysis.
In Table 7, there are 6 components extracted through the Principal Component Analysis. All the extracted components meet the requirement of having eigenvalue higher than 1. Besides, 6 components accounts for 71.655% of variance.
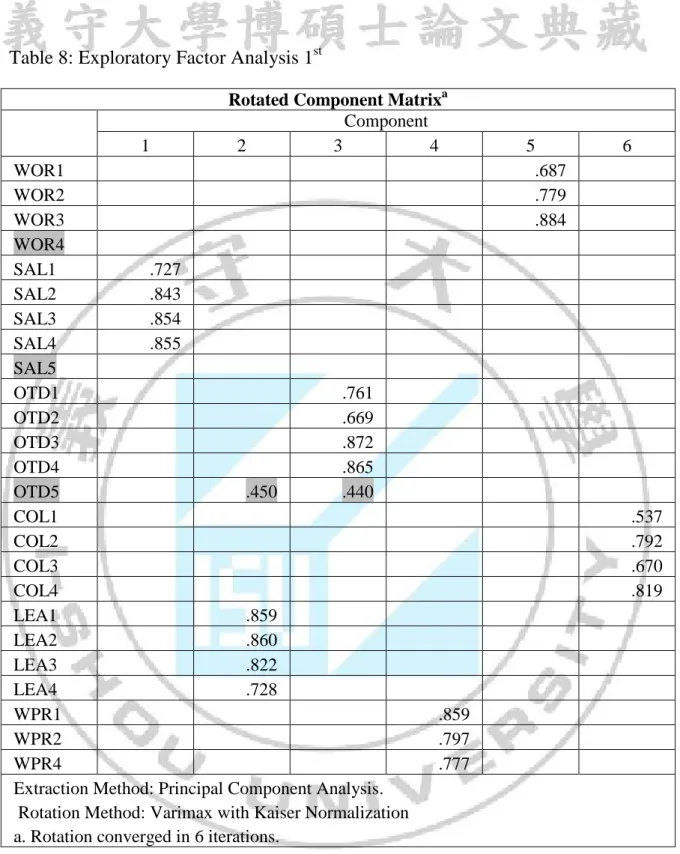
Table 8: Exploratory Factor Analysis 1st
Rotated Component Matrixa
Component 1 2 3 4 5 6 WOR1 .687 WOR2 .779 WOR3 .884 WOR4 SAL1 .727 SAL2 .843 SAL3 .854 SAL4 .855 SAL5 OTD1 .761 OTD2 .669 OTD3 .872 OTD4 .865 OTD5 .450 .440 COL1 .537 COL2 .792 COL3 .670 COL4 .819 LEA1 .859 LEA2 .860 LEA3 .822 LEA4 .728 WPR1 .859 WPR2 .797 WPR4 .777
Extraction Method: Principal Component Analysis. Rotation Method: Varimax with Kaiser Normalization a. Rotation converged in 6 iterations.
As shown in Table 8, there are 3 items (WOR4, SAL5 and OTD5) that have factor loading value lower than 0.5. Thus, these items were removed and the author run the exploratory factor analysis again.
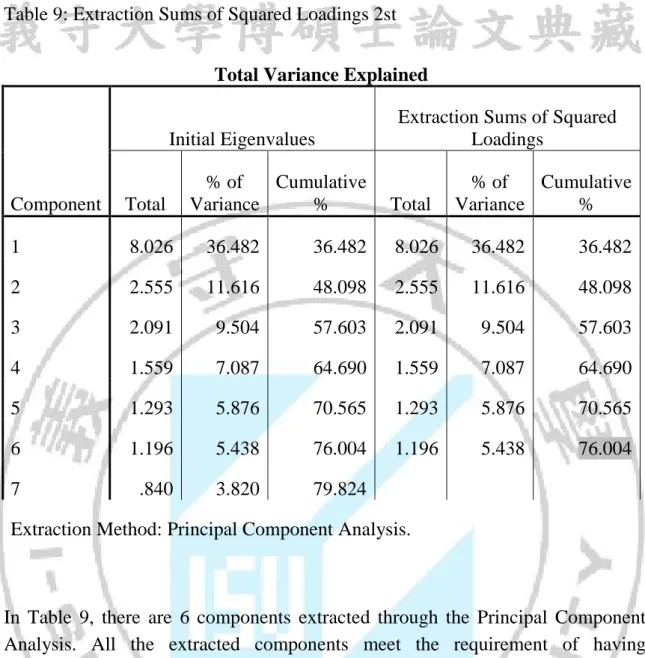
Table 9: Extraction Sums of Squared Loadings 2st
Total Variance Explained
Component
Initial Eigenvalues
Extraction Sums of Squared Loadings Total % of Variance Cumulative % Total % of Variance Cumulative % 1 8.026 36.482 36.482 8.026 36.482 36.482 2 2.555 11.616 48.098 2.555 11.616 48.098 3 2.091 9.504 57.603 2.091 9.504 57.603 4 1.559 7.087 64.690 1.559 7.087 64.690 5 1.293 5.876 70.565 1.293 5.876 70.565 6 1.196 5.438 76.004 1.196 5.438 76.004 7 .840 3.820 79.824
Extraction Method: Principal Component Analysis.
In Table 9, there are 6 components extracted through the Principal Component Analysis. All the extracted components meet the requirement of having eigenvalue higher than 1. Also, 6 components accounts for 76.004% of variance.
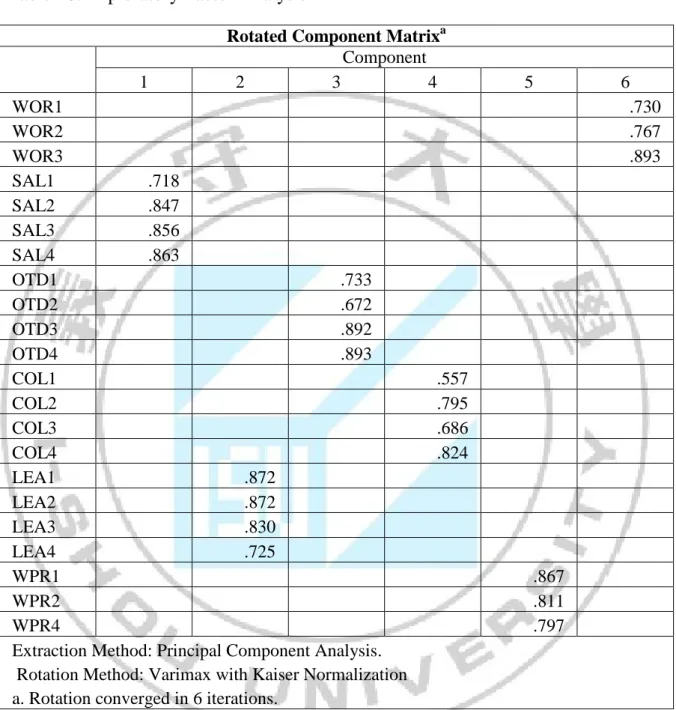
Table 10: Exploratory Factor Analysis 2nd
Rotated Component Matrixa
Component 1 2 3 4 5 6 WOR1 .730 WOR2 .767 WOR3 .893 SAL1 .718 SAL2 .847 SAL3 .856 SAL4 .863 OTD1 .733 OTD2 .672 OTD3 .892 OTD4 .893 COL1 .557 COL2 .795 COL3 .686 COL4 .824 LEA1 .872 LEA2 .872 LEA3 .830 LEA4 .725 WPR1 .867 WPR2 .811 WPR4 .797
Extraction Method: Principal Component Analysis. Rotation Method: Varimax with Kaiser Normalization a. Rotation converged in 6 iterations.
For the table 10, we can say that 6 components of factors affecting Quality of human resources initially retained to explain Quality of human resources in the current period. With total extracted variance is 76.004%, which concludes that the factors explain probably 76.004% variation in data.
4.4 Official research model
With the result from the EFA, the author proposed the official research model as shown in Figure 3 Salary Salary H2 Quality of human resources Quality of human resources Work factor Work factor H1 Opportunity to develop Opportunity to develop Colleague Colleague Leaders Leaders H3 H4 H5 Work Process Work Process H6
Figure 3: The research model studying factors affecting Quality of human resources
The H1, H2, H3, H4, H5, H6 hypothesis are kept as initially.
From the results of factor analysis was conducted to explore the values of the new variables as follows:
WOR = Mean (WOR1, WOR2, WOR3) SAL = Mean (SAL1, SAL2, SAL3, SAL4) OTD= Mean (OTD1, OTD2, OTD3, OTD4) COL= Mean (COL1, COL2, COL3, COL4) LEA = Mean (LEA1, LEA2, LEA3, LEA4) WPR = Mean (WPR1, WPR2, WPR4)
4.5 Testing research model through regression method
After testing scale by Cronbach Alpha and EFA, we have identified 6 factors affecting to Quality of human resources.
Before going into our regression analysis tested the correlation between the variables
4.5.1 Testing correlation between the variables
Before running the regression analysis, it is necessary to run the correlation analysis. Although correlation does not necessarily lead to regression relationship, it does provide more supporting evidence for the plausibility of the regression analysis.
Table 11: Correlation matrix between the variables
QHR1 WOR SAL OTD COL LEA WPR
QHR1 Pearson Correlation 1 .451 ** .573** .479** .538** .441** .535** Sig. (2-tailed) .000 .000 .000 .000 .000 .000 N 200 200 200 200 200 200 200 WOR Pearson Correlation .451 ** 1 .350** .419** .494** .206** .366** Sig. (2-tailed) .000 .000 .000 .000 .003 .000 N 200 200 200 200 200 200 200 SAL Pearson Correlation .573 ** .350** 1 .327** .430** .373** .565** Sig. (2-tailed) .000 .000 .000 .000 .000 .000 N 200 200 200 200 200 200 200 OTD Pearson Correlation .479 ** .419** .327** 1 .495** .252** .348** Sig. (2-tailed) .000 .000 .000 .000 .000 .000 N 200 200 200 200 200 200 200 COL Pearson Correlation .538 ** .494** .430** .495** 1 .382** .405** Sig. (2-tailed) .000 .000 .000 .000 .000 .000 N 200 200 200 200 200 200 200 LEA Pearson Correlation .441 ** .206** .373** .252** .382** 1 .343** Sig. (2-tailed) .000 .003 .000 .000 .000 .000 N 200 200 200 200 200 200 200 WPR Pearson Correlation .535 ** .366** .565** .348** .405** .343** 1 Sig. (2-tailed) .000 .000 .000 .000 .000 .000 N 200 200 200 200 200 200 200
**. Correlation is significant at the 0.01 level (2-tailed).
Result from Table 11 show that the dependent variable is correlated to the independent variables. However, the independent variables are also correlated to one another; thus, it is necessary to check whether the collinearity occurs in the regression analysis.
4.5.2 Regression analysis
As shown in Table 12, the adjusted R2 of the model is 0.526. The result means that the model can explain precisely the variation of the dependent variable at the rate 52.6%
Table 12: Regression analysis
Model Summary
Model R R Square Adjusted R Square
Std. Error of the Estimate
1 .725a .526 .511 .697
a. Predictors: (Constant), WPR, LEA, OTD, WOR, SAL, COL
Table 13: The statistical parameters of each variable in regression function
Model Unstandardized Coefficients Standardized Coefficients t Sig. Collinearity Statistics B Std. Error
Beta Tolerance VIF
(Constant) -.712 .315 -2.258 .025 WOR .146 .073 .119 1.997 .047 .689 1.452 SAL .272 .069 .251 3.950 .000 .608 1.645 OTD .229 .080 .170 2.860 .005 .697 1.435 COL .203 .085 .156 2.385 .018 .576 1.736 LEA .162 .056 .162 2.896 .004 .786 1.272 WPR .202 .074 .172 2.725 .007 .618 1.617 PE .127 .088 .188 5.986 .000 .715 1.398
As shown in Table 13, the VIF values are smaller than 2 in all cases, signifying that there is no collinearity occuring in this study.
The regression formula is:
QHR1 = 0.146*WOR + 0.272*SAL + 0.229*OTD + 0.203*COL + 0.162*LEA + 0.202*WPR – 0.712
In which:
WOR: Work factors SAL: Salary factors
OTD: Opportunity to develop factors COL: Colleague factors
LEA: Leaders factors WPR: Work process factors
Chapter 5 Conclusions and Recommendations
Based on the result of Chapter 4, the author make conclusions and propose some recommendations to Phuong Nam Company to improve job satisfaction and human resources quality in Chapter 5.5.1 Conclusions
This study aism to explore factors influencing human resources quality at Phuong Nam Company. The result show that there are 6 factors influencing human resources quality with the order as the following: (1) salary, (2) work process, (3) Opportunity to develop, (4) Leaders, (5) Colleague, (6) Work
5.2 Limitations and recommendations
5.2.1 Limitations
The study has some following limitations:
First, the scale of the research was limited among some departments in the company, thus, reducing the generalization of the study. The generalization may increase if this study is conducted on all employees of Phuong Nam company. Besides, the research only assessed the scale by Cronbach alpha and methods of factor analysis EFA discovery and testing theoretical models by regression analysis linear rules. To better measure the scale and expertise of theoretical models, the Modern methods of analysis should adopt a model SEM linear structure.
5.2.2 Recommendations
Regarding to terms of global integration currently, business units should enhance competition advantages, and advance the service quality of human resources. According to the research results in chapter 4, some recommendations about improving service quality of human resources of Phuong Nam Company can be given to help respond to customers’ demand more effectively.
Table 14: The constituents quality of human resources of Phuong Nam Company
No Factor Beta
1 SAL 0.251 2 WPR 0.172 3 OTD 0.170 4 LEA 0.162 5 COL 0.156 6 WOR 0.119
5.2.2.1 Salary
Table 14 show the factors that affect the quality of human resources of Phuong Nam Company. Factors most strongly impact on salary. Salary and welfare are the important factors that affect satisfaction and loyalty of staff. The company must ensure a fair policy of salary which is based on the contribution of employees. It has to notify clearly all staff at Phuon Nam Company. Additionally, to increase the satisfaction of staff at Phuong Nam Company, the company can also offers benefit such as insurance, gifts, healthcare service to improve the satisfaction of employees in Phuong Nam company.
5.2.2.2 Work process factors
Management at Phuong Nam company should care more about employees’ ability and give them opportunity to display combined skills in consideration of their profession. Tools and equipment are sufficient to complete the work, and jobs that don’t require frequent extra-time. Especially, jobs should always be innovated to avoid boredom on monthy bases.
5.2.2.3 Opportunity to develop
The company should provide employees with proper training to improve their professional knowledge and promotion opportunities to excellent employees. It will increase the satisfaction and loyalty of staff Phuong Nam Company. It is impotant for managers in Phuong Nam Company to keep a fair promotion policy to ensure the satisfaction of all employees.
5.2.2.4 Leaders
Phuong Nam Company management boards need to assist staff whenever they are in want, and treat them fair. Especially, the company has to listen to opinions of staff to increase quality of school, which is important to increase the satisfaction and loyalty of staff.
5.2.2.5 Colleague
Each year, staffs are evaluated fairly by the company based on their achievement. Staffs are rewarded when getting new achievement, which will encourage staff to work harder and get new achievements in the future. In Phuong Nam Company staffs have changes to widen the relationship with lots of people by some social activities such as picnic, social gatherings.
5.2.2.6 Work
Phuong Nam Company management boards need to care more about function of staff and must combine different skills in consideration of their profession. Above all, jobs should always be innovatedto avoid boredom in every month. Additionally, staffs have to take their responsibility with work.
References
Dung Kim Tran (2003), Human Resource Management, Statistics Publishers Tho, Nguyen Dinh – Trang, Nguyen Thi Mai (2009) Scientific research in business, Statistics Publishers
Nguyen Van Dong (2005), Human Rights Civil Rights Constitutional Vietnam, Social Sciences Publishing House
Phuong Dong Thi Thanh (2007), Human Resource Management, Statistics Publishers
Le Hoang, Truong Son (2008), Attractive, search and selection of human resources, Tre Publishing House
Quan Dong Ngoc (2012), Human Resource Management, National Economics University Publishers
Stephen George. Arnold Weimerskirch (2009), The Portable MBA Total Quality Management, Ho Chi Minh City General Publishing House
Richard A. Swanson (2009), Foundations of Human Resource Development, Berrett-Koehler Publishers
Hoang Trong; Chu Nguyen Mong Ngoc (2008) Data Analysis with SPSS, Hong Duc Publishers
Bui Nguyen Hung, Nguyen Thuy Quynh Loan (2004), Quality Management Vietnam National University Ho Chi Minh City Publishers
Appendix
Questionnaire
CUSTOMER SURVEY FORM
Hello!
My name is Nguyen Hoang Long I am doing a master's thesis “Solutions to improve quality of human resources at the Construction Tourism Trade Phuong Nam Company in Viet Nam”
To complete this topic, I would like to receive the community assessment, objective opinion of you help me complete this topic.
Thank you and good luck!
Part I: You said your level of agreement with the following statements about the quality human resources at Phuong Nam Company
Please rate the degree of your agreement
Strongly disagree Disagree Neutral Agree Strongly Agree
1 Work characteristics is a combination of
different skills 1 2 3 4 5
2 Work is compelling, not boring 1 2 3 4 5
3
You find the reasonableness of the amount of work that is expected from you
1 2 3 4 5
4 Work is consistent with profession 1 2 3 4 5
5 You get higher salaries compared to the
market 1 2 3 4 5
6 Wages you receive match your
capabilities 1 2 3 4 5
7 Income distribution of the Phuong Nam
Company is equal 1 2 3 4 5
8 Benefits of the policy clearly 1 2 3 4 5
9 Company has clear health insurance
policy, social for you 1 2 3 4 5
10 You have sufficient opportunity to
develop in your work 1 2 3 4 5
11 The variation in your work is
satisfactory 1 2 3 4 5
12
Phuong Nam Company will facilitate for you to learn and improve professional knowledge
1 2 3 4 5
13 Phuong Nam Company has promoted
policies for qualified person 1 2 3 4 5
14 Supervisor recognize the your
achievement 1 2 3 4 5
15 The support for specialized knowledge
from colleagues at work 1 2 3 4 5
16 Colleagues are ready to assist you when
having trouble 1 2 3 4 5
17 Colleagues in Company are friendly 1 2 3 4 5
18 Colleagues in the Company listen and
respect your opinions 1 2 3 4 5
19 Leadership timely assist you whenever
you need 1 2 3 4 5
20 Phuong Nam leaders expressed a care to
each member 1 2 3 4 5
21 Phuong Nam leaders fairly treat to all
subordinates 1 2 3 4 5
22 Phuong Nam eaders listen to the
opinions of staffs 1 2 3 4 5
23 Tools and equipment is sufficient to
complete your work 1 2 3 4 5
24 Temperature conditions can ensure that
you can work well 1 2 3 4 5
25 Working place is full light 1 2 3 4 5
26 Jobs doesn’t require frequent extra-time 1 2 3 4 5
27
In general, you are completely satisfied with quality of human resources at the Construction Tourism Trade Phuong Nam Company.
1 2 3 4 5
PART II: RESPONDENT INFORMATION
Age: Under 25 25 – under 35
35 – under 45 Over 45
Gender: Male Female
Working seniority:
Less than 1 to 2 years Less than 3 to 5 years More than 5 years
Thank you and good luck!
Table coding variables
Age: an ordinal variable ranges as following:
- Under 25 years old: coding = 1 - 25 – 35 years old: coding = 2 - 35 – 45 years old: coding = 3 - Over 45 years old: coding = 4
Gender: a nominal variable ranges as following:
- Male: coding = 1 - Female: coding = 2
Working seniority: an ordinal variable ranges as following:
- Less than 1 to 2 years: coding = 1 - Less than 3 to 5 years: coding = 2 - More than 5 years: coding = 3 The scale is encoded as Table 15 Table 15: Scale is encoded
No Encryption Interpretation
Component of the Work factor (WOR)
1 WOR1 Work characteristics is a combination of different skills
2 WOR2 Work is compelling, not boring
3 WOR3 You find the reasonableness of the amount of work that is
expected from you
4 WOR4 Work is consistent with profession
Component of the Salary (SAL)
5 SAL1 You get higher salaries compared to the market
6 SAL2 Wages you receive match your capabilities
7 SAL3 Income distribution of the Phuong Nam Company is equal
8 SAL4 Benefits of the policy clearly
9 SAL5 Company has clear health insurance policy, social for you
Component of the Opportunity to develop (OTD)
10 OTD1 You have sufficient opportunity to develop in your work
11 OTD2 The variation in your work is satisfactory
12 OTD3 Phuong Nam Company will facilitate for you to learn and
improve professional knowledge
13 OTD4 Phuong Nam Company has promoted policies for qualified
person
14 OTD5 Supervisor recognize the your achievement
Component of the Colleague (COL)
15 COL1 The support for specialized knowledge from colleagues at
work
16 COL2 Colleagues are ready to assist you when having trouble
17 COL3 Colleagues in Company are friendly
18 COL4 Colleagues in the Company listen and respect your opinions
Component of the Leaders (LEA)
19 LEA1 Leadership timely assist you whenever you need
20 LEA2 Phuong Nam leaders expressed a care to each member
21 LEA3 Phuong Nam leaders fairly treat to all subordinates
22 LEA4 Phuong Nam eaders listen to the opinions of staffs
Component of the Work process (WPR)
23 WPR1 Tools and equipment is sufficient to complete your work
24 WPR2 Temperature conditions can ensure that you can work well
25 WPR3 Working place is full light
26 WPR4 Jobs doesn’t require frequent extra-time
The scale quality of human resources (QHR)
27 QHR1
In general, you are completely satisfied with quality of human resources at the Construction Tourism Trade Phuong Nam Company.