行動服務品質量表建構 - 政大學術集成
61
0
0
全文
(2) 謝辭 人總要不斷地成長、前進,18 年的學生身分在此先暫時告一段落,也許一路 上懵懵懂懂,即使心中不免有所恐懼與不安,但走過的路都不曾白費,也為我的人 生增添許多色彩。研究所兩年的時光過得真快,很感謝也十分慶幸自己能遇到很好 的老師─管郁君老師、林勝為老師。謝謝管老師無論在課堂、論文指導、或生活上 的幫助與經驗分享,感謝老師的悉心照顧與鼓勵,讓我面對自己的不足時,給予我 很大的力量!記得管老師曾與我分享過一段話:「人一輩子都會有所恐懼,要讓自 己能克服恐懼。」這句話對我而言十分受用,讓我往後每當遇到困難感到迷惑的時 候,腦中都會浮現這句話,帶領我繼續前往正確的路,而每一步都是如此踏實並充 滿力量。同樣地,我也十分感謝我的另一位指導老師─林勝為學長,謝謝學長的親 切、耐心,與許多細節的指導和提醒。從念 paper 到寫論文的整個過程,謝謝管老 師與勝為學長總是有問必答,給予我許多建議及鼓勵,讓我順利地完成論文。最感 動的事莫過於兩位老師都親自為我的論文編修,逐字逐句地審閱並修改論文,以及 在資料分析階段時,管老師在實驗室花了整個上午的時間,讓我順利地處理完資料 分析的工作。研究所兩年,從兩位老師身上學習到認真的處事態度與真誠待人的心, 感謝兩位老師總是願意替學生著想!. 立. 政 治 大. ‧ 國. 學. ‧. 此外,感謝在研究所階段認識的好友,為彼此時而苦悶的碩士班生活帶來許多 歡樂回憶,感謝我的好友:心靈支柱果傑、臭氣相投的好室友 Penny、新生茶會一 起搭公車搭過頭的妞妞、跑步的好夥伴康喵、給我很多建議的賴炳和小捲……謝謝 你們的陪伴,也謝謝 99 級碩士班的同窗好友、謝謝系辦和機房助教兩年來的照顧, 很開心可以認識你們,也謝謝你們在我很煩惱的時候,鼓勵我、為我指點迷津,讓 我最後都順利的度過了;謝謝一路相伴的高中 CRAZY 好姊妹及大學好友,愛你們、 有你們真好,我畢業了,又可以一起瘋了!. er. io. sit. y. Nat. al. v. n. 最後,要感謝我的家人:媽媽、叔叔、姊姊、妹妹,謝謝你們給我一個溫暖的 家、安穩的成長環境、及溫暖的鼓勵與關懷,讓我順利地完成學業,也在這兩年供 應我去國外旅遊、參加研討會、開眼界。謝謝家人的付出,如今完成碩士學位,也 即將邁向人生下一階段,我會繼續努力並且更加獨立,不辜負你們的愛,也期許很 快就有能力換我照顧你們、一起享受人生!. Ch. engchi. i n U. 管老師常說我是十分幸福的孩子,的確,我也覺得自己十分幸福與幸運!我 所遇到的人,都是很好的人與善良的朋友,在我遇到問題、需要幫助的時候,總會 有人願意伸出援手;在我感到傷心時,總會有人關懷問候;而快樂的事,也總是有 可以一起分享的夥伴。我珍惜這一切,同時我也希望自己會是很好的人,謝謝那些 美好的人、美好的事。. Page I.
(3) Abstract To deliver superior mobile service quality, mobile service providers must understand consumers’ perceptions of mobile services. As there are many different types of mobile services, this research attempts to grasps the essential characteristics of mobile services. This article conceptualizes, constructs, refines, and tests a multiple-item scale (M-S-QUAL) for measuring the service quality in mobile environment. According to Hinkin’s guide to the development of scales, item generation can be conducted using a deductive approach based on a theoretical foundation. The preliminary M-S-QUAL scales developed in the research are 50-item scale for tangible products and 49-item scale. 政 治 大 privacy, responsiveness, compensation, contact, content, and billing. The scales will 立 demonstrate good psychometric properties based on findings from a variety of for intangible products in nine dimensions: efficiency, fulfillment, system availability,. ‧ 國. 學. exploratory factor analysis (EFA), confirmatory factor analysis (CFA), reliability and validity tests. These analyses resulted in a 4-construct, 15-item instrument for measuring. ‧. mobile service quality in tangible product shopping and a 5-construct, 16-item instrument for measuring mobile service quality in intangible product transactions. We further. Nat. sit. y. proceeded to conduct a regression analysis between M-S-QUAL and both perceived. io. er. value (PV) and loyalty intentions (LI) which were adopted as the criterion variables to establish the nomological validity. The results show that the M-S-QUAL scale. n. al. demonstrates good psychometric properties.. Ch. engchi. i n U. v. Keywords: Mobile commerce, Mobile service, Service quality, Scale development.. Page II.
(4) 摘要 隨著網路科技、行動手持裝置的發展,多元的行動服務開始被廣泛開發及應 用,為了能提供更好的行動服務,行動服務提供者必須了解使用者對行動服務的認 知與想法。此研究希望透過不同行動服務類型的特性,定義行動服務品質(Mobile service quality; M-S-QUAL)之適用範圍,並根據 Hinkin 所建議之量表建構方法, 發展出一份有效衡量行動服務品質之量表(M-S-QUAL),以歸納法自既有的服務品質 文獻發展初步的問項。由於行動服務提供有形商品與無形商品的交易與交換,因此, M-S-QUAL 也同時包含有形與無形商品行動服務品質量表,初步的 M-S-QUAL 包含九. 治 政 隱 私 性 (Privacy) 、 反 應 性 (Responsiveness) 、 補 償大 性 (Compensation) 、 聯 絡 性 立 (Contact)、內容(Content)、帳務議題(Billing),而有形/ 無形商品行動服務品質量. 構面:系統效率(efficiency)、履行性(Fulfillment)、系統可用性(System availability)、. ‧ 國. 學. 表分別以 50/ 49 題問項衡量。此份量表透過問卷調查法進行資料的蒐集,並透過 探 索 性 因 素 分 析 (Exploratory factor analysis; EFA) 及 驗 證 性 因 素 分 析. ‧. (Confirmatory factor analysis; CFA)萃取出四構面、15 題問項之有形商品行動. sit. y. Nat. 服務品質量表與五構面、16 題問項之無形商品行動服務品質量表,此研究亦針對 M-S-QUAL 量表進行信、效度檢驗並利用不同校標(感知價值與忠誠意圖)進行迴歸. io. n. al. er. 分析以建立校標關聯效度。研究結果顯示本研究所發展的行動服務品質量表具有良 好的心理計量特質(psychometric properties)。. Ch. engchi. i n U. v. 關鍵字:行動商務、行動服務、服務品質、量表建構. Page III.
(5) Content Index Chapter 1 Introduction ................................................................................................. 1 Chapter 2 Literature review ........................................................................................ 4 2.1 . Mobile commerce ............................................................................................... 4 . 2.1.1 . From e-commerce to m-commerce ............................................................ 4 . 2.1.2 . Scope of m-commerce applications ........................................................... 5 . 2.1.3 . Products and services in mobile services .................................................. 6 . 2.2 . Service quality .................................................................................................... 7 . 政 治 大. 2.2.1 . Conceptualization of service quality ......................................................... 7 . 2.2.2 . Electronic service quality ........................................................................... 8 . 2.2.3 . Mobile service quality ................................................................................. 9 . ‧ 國. 學. 2.3 . 立. Scale development ............................................................................................ 11 . Questionnaire design ........................................................................................ 13 . y. Nat. 3.1 . ‧. Chapter 3 Research method ....................................................................................... 13 . 3.1.2 . Developing a preliminary scale ................................................................ 14 . 3.1.3 . Items simplification and content validity establishment ....................... 17 . er. al. n. 3.2 . sit. Modifying E-S-QUAL to mobile scenario............................................... 13 . io. 3.1.1 . Ch. engchi. i n U. v. Data collection .................................................................................................. 18 . 3.2.1 . Sampling and data collection ................................................................... 18 . 3.3 . Statistical methods for data analysis .............................................................. 18 . 3.4 . Pretesting and initial item reduction .............................................................. 20 . Chapter 4 Data analysis and scale purification ........................................................ 21 4.1 . Sampling data ................................................................................................... 21 . 4.2 . Item analysis and reliability estimation ......................................................... 24 Page IV.
(6) 4.3 . Identifying the factor structure of the M-S-QUAL construct ...................... 27 . 4.3.1 . Exploratory factor analysis ...................................................................... 28 . 4.3.2 . Confirmatory factor analysis ................................................................... 30 . 4.4 . Assessing reliability and validity..................................................................... 32 . 4.4.1 . Reliability ................................................................................................... 33 . 4.4.2 . Discriminant and convergent validity ..................................................... 33 . 4.4.3 . Nomological validity ................................................................................. 34 . 4.5 . Data analysis result .......................................................................................... 35 . 政 治 大 Practical implications 立 ....................................................................................... 36 . Chapter 5 Discussions and conclusion ...................................................................... 36 . Conclusion and limitations .............................................................................. 38 . 學. 5.2 . ‧ 國. 5.1 . Appendix A ...................................................................................................................... 44 . ‧. Appendix B ...................................................................................................................... 49 . n. er. io. sit. y. Nat. al. Ch. engchi. i n U. v. Page V.
(7) Figure Figure 1. The m-commerce value chain ............................................................................. 5 Figure 2. Scale development process ................................................................................ 11 Figure 3. Research model ................................................................................................. 16 Figure 4. CFA model ........................................................................................................ 35 . Table Table 1. Types of m-services (FIND, 2008) ....................................................................... 6 . 政 治 大. Table 2. Dimensions related to the mobile service quality construct in previous studies 10 Table 3. Respondents gathering result .............................................................................. 21 . 立. Table 4. Demographic descriptive statistics ..................................................................... 22 . ‧ 國. 學. Table 5. Handheld devices usage descriptive data............................................................ 23 Table 6. Mobile service use experience descriptive data .................................................. 24 . ‧. Table 7. Item analysis – reliability.................................................................................... 25 Table 8. Item analysis – corrected item- total correlation ................................................ 26 . y. Nat. Table 9. KMO measure and Bartlett’s sphericity test ....................................................... 28 . sit. Table 10. EFA results for tangible products M-S-QUAL................................................. 29 . al. er. io. Table 11. EFA results for intangible product M-S-QUAL ............................................... 29 . n. v i n C h indices for theUmodel..................................... 32 Table 13. Comparisons of goodness-of-fit engchi Table 12. CFA and reliability results (Intangible products) ............................................. 31 Table 14. Value of Cronbach's α for each factor .............................................................. 33 Table 15. Correlation matrix for intangible products ....................................................... 34 Table 16. Result of regression analysis of M-S-QUAL and PV ....................................... 34 Table 17. Result of regression analysis of M-S-QUAL and RI ........................................ 34 . Page VI.
(8) Chapter 1 Introduction With the development of handheld devices such as personal digital assistants (PDAs), tablets, and smart phones, wireless and mobile technologies and their associated applications have become essential tools. According to the International Data Corporation (IDC), in 2009 there were more than 450 million mobile Internet users worldwide, a figure that will exceed the 1 billion mark by 2013. There were 5.3 billion mobile subscribers, representing 77 percent of the world’s population. In 2010, 1388.2 million mobile handsets were sold, up 18.5 percent. 政 治 大. compared with 2009. Smartphones have shown the strongest growth, with total shipments in. 立. 2010 of 302.6 million units, up 74.4 percent from 2009, representing 21.8 percent of all handsets. ‧ 國. 學. shipped. The fast-growing smartphone market is predicted to grow more than four times the rate of the overall mobile phone market this year. IDC expected smartphone vendors to ship up to 472 million smartphones in 2011 (107 million smartphones were sold worldwide in the second. ‧. quarter of 2011), and predicted that the figure will nearly double to 982 million by the end of. y. Nat. 2015 (IDC, 2011). In contrast, Gartner expected global sales of tablet PCs to reach 7 million units. sit. in 2011, and predicted that sales in 2012 would reach 108 million units, but global tablet PC sales. al. er. io. in 2010 were only 1.76 million units. This implies a very rapid evolution of Internet access and. v. n. the mobile market, with more people starting to use handheld devices. Wireless technology has. Ch. thus become a very important issue.. engchi. i n U. Advanced and mature wireless communication technology has facilitated the development of various mobile commerce (m-commerce) applications. Many mobile applications have emerged as a result, such as location-based services (LBS), mobile reading services, electronic books, mobile TV, and mobile music. Positioning technology such as the GPS provides localization services for mobile devices (Rao & Minakakis, 2003). Over 300,000 mobile applications (apps) were developed in the three years from 2007 to 2010. IDC indicates that in 2010 alone these 300,000 applications were downloaded 10.9 billion times. They predict that global downloads will reach 76.9 billion times in 2014 and will be worth US$35 billion (IDC, 1.
(9) 2010). The most popular categories of apps are games, news, maps, social networking, and music. The most used apps across all smartphones in the United States, according to Nielsen (Nielsen, 2010), are Facebook, Google Maps, and the Weather Channel (TWC). New m-commerce applications are developing and m-commerce market is growing. There are several differences between m-commerce and e-commerce. For example, a particular mobile characteristic that must be considered is that when mobile consumers search for a thing, it is possible that we are near the area relating to the thing. For instance, if we type the. 政 治 大. keywords “101” and “restaurant”, we may be planning to have a meal in a restaurant around the Taipei 101 shopping mall, and in these mobile times, it is likely that we are close to the mall now. 立. and want to have dinner later. The main characteristics of m-commerce that are not found in. ‧ 國. 學. general e-commerce are the use of the user’s location, non-planned events, and instant business behavior. Positioning technology such as GPS provides localization services for mobile devices,. ‧. which has allowed the development of location-based applications that connect to a user’s location directly (Rao & Minakakis, 2003). The main LBS applications are those that allow users. y. Nat. to navigate with their smart phones if they lose their way. Another use of LBS is the “check-in”. io. sit. function in applications such as Facebook and Foursquare. As the mobile service applications. al. n. opportunities.. er. market grows, companies will inevitably strive to enter the mobile market to search for new. Ch. engchi. i n U. v. A great deal of literature is available on service quality, covering both offline services (traditional services) and online services (e-services). However, there are potential opportunities for further research due to the development of new technologies and service delivery channels. Service quality describes the gap between consumers’ expectations and performance. If consumers’ initial service expectations are higher than their perceptions after receiving the service, then the total perceived service quality will decrease. Service quality evaluations also involve processes (Sasser et al., 1978), such as the way in which services are delivered. The SERVQUAL service quality scale was developed by Parasuraman, Berry, and Zeithaml in 1985, and further be refined in 1991. For several decades, research on service quality in the field of 2.
(10) commerce has been strongly influenced by the work of Parasuraman et al. With the development of the Internet, electronic commerce (e-commerce), and services that are provided online, Parasuraman et al. (2005) developed a multiple-item scale for assessing electronic service quality (E-S-QUAL) specifically for the e-commerce context. However, to date there has been limited research on the development of a scale of mobile service quality (m-SQ). The gaps of research are: (1) it is not clear that factors influence of wireless-based applications to be used effectively in m-commerce environment, (2) there is not well-defined measuring and lacks of strict methodology scale development to measure M-S-QUAL, (3) a success of M-S-QUAL cannot be. 政 治 大 attempts to develop a new multi-dimensional instrument to measure M-S-QUAL. 立. evaluated by a single-item scale, such as global service quality. To fill this gap, this research. ‧ 國. 學. The objective of this research is to develop a sound instrument for measuring m-SQ, and to identify the dimensions of m-SQ. To deliver superior mobile service quality, mobile service. ‧. providers must understand consumers’ perceptions of mobile services. As there are many different types of mobile services, this research attempts to grasps the essential characteristics of. y. Nat. mobile services. A core M-S-QUAL measurement scale is then developed that is suitable for. io. sit. assessing consumers’ perceptions of the service quality of mobile applications. The procedure. er. used in generating items, collecting data, and validating the multi-item scale is described in. al. n. v i n C U statistic software AMOS to analyzing convergent validity, and discriminanthvalidity e n gbycusing h i the. following chapters. This study carefully examines the evidence of reliability, content validity, data from sample.. 3.
(11) Chapter 2 Literature review 2.1 Mobile commerce The convergence of wireless telecommunications and the Internet has provided many exciting possibilities for the growth of m-commerce. The penetration of both technologies has driven many changes in our daily lives, including how we work, live, and learn, and how we consume. The following sections give an introduction to and review of the m-commerce. 政 治 大 2.1.1 From e-commerce to m-commerce 立 literatures are discussed in the following sections.. ‧ 國. 學. Using wired communication devices to deal with business activities outside of enterprises. is traditionally termed electronic commerce (e-commerce). Advanced and mature wireless and mobile technologies have helped e-commerce to develop from using wired networks to using. ‧. wireless networks. Mobile commerce (m-commerce) can be viewed as a subset of e-commerce. y. Nat. (Coursaris & Hassanein, 2002; Kwon & Sadeh, 2004), and refers to any transaction with a. sit. monetary value conducted via a mobile network (Clarke, 2001). It typically involves the use of. er. io. handheld mobile devices and connections via an always-on and high-speed Internet link to. al. v i n communication devices are used toCconduct activities outside enterprises, such as buying U h e nbusiness i h gc n. engage in communication, interaction, and transaction activities. In m-commerce wireless a product via a mobile phone that connects to a website.. M-commerce is different from e-commerce in that there are no limitations of place. Clarke and Flaherty (2003) identified four characteristics of m-commerce: ubiquity, convenience, localization, and personalization. Companies provide mobile services to consumers based on these characteristics. The evolution of m-commerce has gone through several generations. The first and second generations (1G/2G) provided voice calls and text messages, and 2.5G provided information transmission. Dynamic multimedia became available in the third generation (3G) due to advancements in data transmission per unit of time, which gave rise to many new applications. 4.
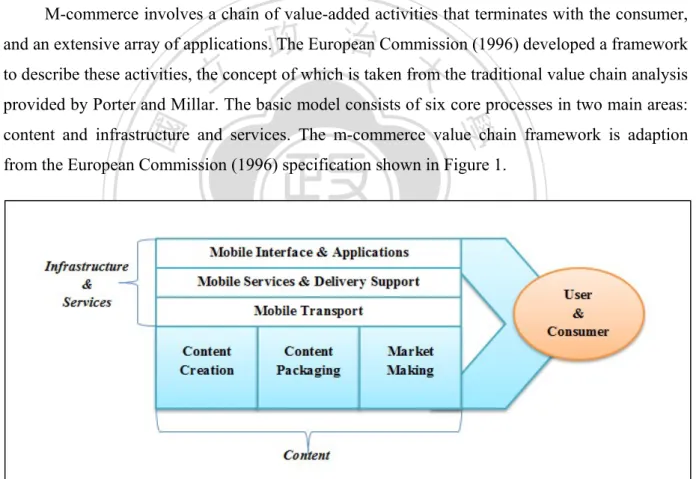
(12) The fourth generation (4G) is devoted to speeding up the data transmission, which will result in richer mobile service applications that provide virtually any service that a consumer might need. M-commerce integrates personnel communication, data transmission, broadcast services, and multimedia entertainment applications, and provides convenient, secure, and personalized applications. 2.1.2 Scope of m-commerce applications M-commerce involves a chain of value-added activities that terminates with the consumer,. 政 治 大 to describe these activities, the concept of which is taken from the traditional value chain analysis 立 provided by Porter and Millar. The basic model consists of six core processes in two main areas:. and an extensive array of applications. The European Commission (1996) developed a framework. ‧ 國. 學. content and infrastructure and services. The m-commerce value chain framework is adaption from the European Commission (1996) specification shown in Figure 1.. ‧. n. er. io. sit. y. Nat. al. Ch. engchi. i n U. v. Figure 1. The m-commerce value chain Infrastructure and services concern transmission technologies, services supporting technologies, and application development. The part includes mobile transport, mobile services and delivery support, and mobile interface and applications. The infrastructure and services support users and consumers access to networks and mobile services. The other part is service 5.
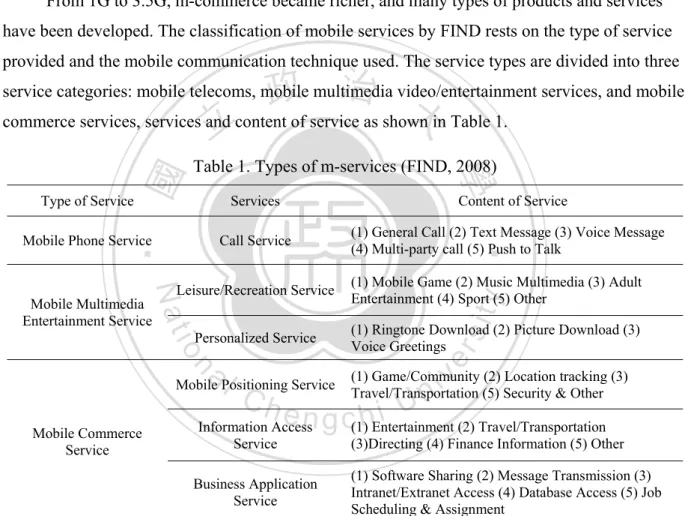
(13) content which is covering content creation, packaging, and market making. From original information and information processing to content and service applications received by users. The six core processes provide m-commerce a clear and concise framework and scope definition. 2.1.3 Products and services in mobile services From 1G to 3.5G, m-commerce became richer, and many types of products and services have been developed. The classification of mobile services by FIND rests on the type of service provided and the mobile communication technique used. The service types are divided into three. 政 治 大 commerce services, services and content of service as shown in Table 1. 立 Table 1. Types of m-services (FIND, 2008). 學. Type of Service. Services. Content of Service. Mobile Phone Service. Call Service. (1) General Call (2) Text Message (3) Voice Message (4) Multi-party call (5) Push to Talk. ‧. ‧ 國. service categories: mobile telecoms, mobile multimedia video/entertainment services, and mobile. (1) Mobile Game (2) Music Multimedia (3) Adult Entertainment (4) Sport (5) Other. Personalized Service. (1) Ringtone Download (2) Picture Download (3) Voice Greetings. sit. io. n. al. er. Mobile Multimedia Entertainment Service. y. Nat. Leisure/Recreation Service. i n U. Mobile Commerce Service. Ch. v. (1) Game/Community (2) Location tracking (3) Travel/Transportation (5) Security & Other. Mobile Positioning Service. i e n g c(1)hEntertainment (2) Travel/Transportation. Information Access Service. (3)Directing (4) Finance Information (5) Other. (1) Software Sharing (2) Message Transmission (3) Intranet/Extranet Access (4) Database Access (5) Job Scheduling & Assignment. Business Application Service. 6.
(14) 2.2 Service quality There is a large volume of studies that discuss service quality. The most influential research is the SERVQUAL instrument of service quality developed by Parasuraman, Berry, and Zeithaml (1988). Although the scale has been criticized because of the reliability and validity of the research, today most service quality research is based on their concept and original framework. With the development of technology and the shifting of the service delivery channel from offline to online, an electronic service quality measurement scale (E-S-QUAL) was. 治 政 websites. The concept of service quality is reviewed in the大 following section. 立. developed by the same authors to measure the quality of the services provided by online shopping. 2.2.1 Conceptualization of service quality. ‧ 國. 學. Service quality is more difficult for consumers to evaluate than the quality of tangible. ‧. goods because service is intangible, and price sometimes becomes a pivotal quality indicator when information is not available. Service quality perception is the gap between consumer. sit. y. Nat. expectations and actual service performance. Quality perception includes not only the outcome of the service, but also the service delivery process. Parasuraman et al. (1985) conducted an. io. n. al. er. exploratory study to investigate the concept of service quality in which they suggested that there. i n U. v. were gaps between consumers and marketers, and that if marketers wish to satisfy the demands of. Ch. engchi. consumers, then they must strive to bridge these gaps.. Parasuraman et al. (1988) developed the SERVQUAL service quality model and identified the determinants of perceived service quality components to be reliability, responsiveness, competence, access, courtesy, communication, credibility, security, understanding/knowing consumers, and tangibles. The same authors later published several articles about the development of multiple-item scales for measuring consumer perceptions of service quality. The final scale consists of three dimensions: expectations, perceptions, and a point-allocation question assessing the importance of features the service company providing to consumers. The first two parts measure service quality across five dimensions: tangibles, reliability, responsiveness, 7.
(15) assurance, and empathy. Tangibles construct is about tangible facilities, equipment, and the appearance of personnel. Reliability assesses the ability to perform the promised service dependably and accurately. Responsiveness is about willingness to help consumers and provide a prompt service. Assurance assesses the knowledge and courtesy of employees and their ability to inspire trust and confidence. Empathy is about caring individualized attention the firm provides its consumers (Parasuraman et al., 1991). The focus of the SERVQUAL scale is on the traditional services provided by banks,. 政 治 大. appliance repair firms, assurance companies, and telephone companies. Services of these service types are delivered by companies’ staffs. Consumer’s perceived service quality is involving full. 立. service delivering process and abilities and attitude of staffs of service provider.. ‧ 國. 學. 2.2.2 Electronic service quality. ‧. The original SERVQUAL instrument measures offline and people-delivered services. The later e-service quality multiple-item scale is more appropriately used to measure the service. y. Nat. quality delivered by websites. The scale has two parts. The first is the basic E-S-QUAL scale. sit. consisting of 22 items in four dimensions: efficiency, fulfillment, system svailability, and privacy.. n. al. er. io. The dimension of efficiency measures the speed and ease with which the website is accessed and. v i n C itemhavailability. i U Availability e n g c hSystem. used. Fulfillment assesses the extent to which the service provider deals with problems concerning order delivery and. measures the technical. functions of the website. Privacy is the degree to which the site protects consumer information. The items of these four dimensions can be answered by respondents having online shopping experiences because they are about routine works. Because of the ambiguity of meaning of certain items, the researchers further developed a new e-recovery service quality scale (E-Rec S-QUAL) that consists of 11 items in three dimensions: Responsiveness, compensation, and contact (Parasuraman et al., 2005). The items of these three dimensions are about non-routine process of online shopping, so not all respondents have experiences about incurring online shopping problems. Responsiveness is to assess effective 8.
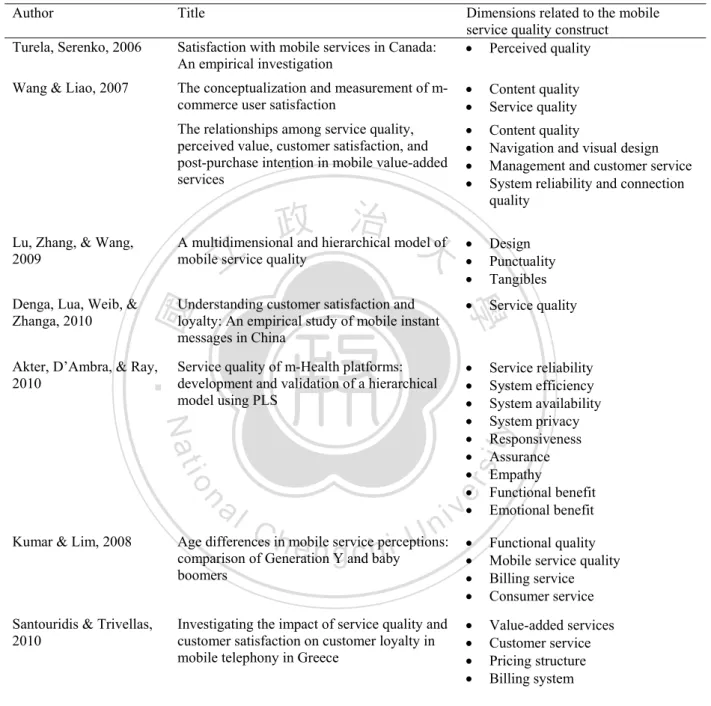
(16) handling of problems and returns. Compensation is defined as the extent to which the site compensates consumers for problems. Contact is about telephone or online representatives the site providing to assist consumers. 2.2.3 Mobile service quality There are some discrepancies between Internet-based and non-Internet-based service quality measurements. Because of the features of m-commerce, mobile service quality is different from either traditional or electronic service quality. E-S-QUAL not only considers the service. 政 治 大 refers to the mobile characteristics of wireless devices that support electronic service transactions. 立 Although mobile commerce is frequently characterized as an extension of e-commerce, it can that companies deliver but also the effect of technology on the service quality. Mobile commerce. ‧ 國. 學. also be regarded as a separate channel that delivers unique value to consumers (Balasubramanian et al., 2002). Several studies have investigated the quality of mobile services. According to the. ‧. suggestions of developing a scale provided by Hinkin (1998), converged related reviews which discussed mobile service in this research to develop scale items (The related dimensions in. y. Nat. sit. mobile service quality construct are shown as in Table 2). Some dimensions in mobile service. er. io. quality construct which are not focusing on service, but on service providers’ corporate image, technical network quality, or other influences will not be considered in this research.. n. al. Ch. engchi. 9. i n U. v.
(17) Table 2. Dimensions related to the mobile service quality construct in previous studies Author. Title. Dimensions related to the mobile service quality construct Perceived quality. Turela, Serenko, 2006. Satisfaction with mobile services in Canada: An empirical investigation. Wang & Liao, 2007. The conceptualization and measurement of mcommerce user satisfaction. . Content quality Service quality. The relationships among service quality, perceived value, customer satisfaction, and post-purchase intention in mobile value-added services. . Content quality Navigation and visual design Management and customer service System reliability and connection quality. 政 治 大. A multidimensional and hierarchical model of mobile service quality. . Design Punctuality Tangibles. Denga, Lua, Weib, & Zhanga, 2010. Understanding customer satisfaction and loyalty: An empirical study of mobile instant messages in China. . Service quality. . Service reliability System efficiency System availability System privacy Responsiveness Assurance Empathy Functional benefit Emotional benefit. Service quality of m-Health platforms: development and validation of a hierarchical model using PLS. er. io. sit. Nat. al. n. Kumar & Lim, 2008. i n C Age differences h in mobile service perceptions: eng c hbabyi U comparison of Generation Y and boomers. Santouridis & Trivellas, 2010. y. Akter, D’Ambra, & Ray, 2010. ‧. ‧ 國. 立. 學. Lu, Zhang, & Wang, 2009. Investigating the impact of service quality and customer satisfaction on customer loyalty in mobile telephony in Greece. 10. v. . Functional quality Mobile service quality Billing service Consumer service. . Value-added services Customer service Pricing structure Billing system.
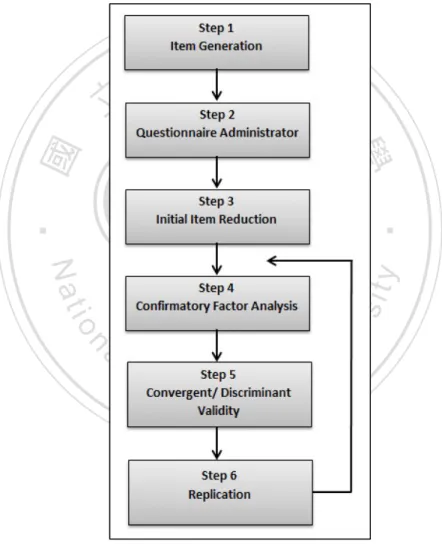
(18) 2.3 Scale development Questionnaire surveys are an important and commonly used research method. A scale instrument can facilitate the conceptualization and operationalization of surveys (Chae et al., 2002). Hinkin (1988) provided a conceptual framework and a straightforward guide for scale development for survey research provides an overview of the main steps in this framework.. 立. 政 治 大. ‧. ‧ 國. 學. n. er. io. sit. y. Nat. al. Ch. engchi. i n U. v. Figure 2. Scale development process The first step is item generation. There are two methods for generating items. One is the deductive approach, which assumes that there is sufficient theoretical foundation to generate the initial set of items. The other is inductive scale development, which is appropriate when the 11.
(19) construct meaning cannot be easily identified and there is no adequate theory with which to generate the items. There are numerous guidelines that should be followed in writing items. For example, statements should be simple and as short as possible, and the language used should be familiar to the target respondents. All of the items in the same construct should be consistent, and items that assess behavior should not be mixed up with items that assess affective responses. After items have been generated, they should be examined a content validity assessment. It will take a pretest to permit the deletion of items that are deemed to be conceptually inconsistent by factor analysis. Factor loading 0.4 or greater on the appropriate factor with no major cross. 政 治 大 four items are needed to test the homogeneity of each latent construct. 立. loading were judged as meaningful. Harvey, Billings, and Nilan (1985) suggested that at least. ‧ 國. 學. Finally, the fourth step uses confirmatory factor analysis to allow the researcher to quantitatively assess the quality of the factor structure, thereby providing further evidence of the. ‧. construct validity of the new measure. The convergent and discriminant validity are then assessed. The replication should include confirmatory factor analysis, assessment of internal consistency. y. Nat. reliability, and convergent, discriminant, and criterion-related validity assessment. Theses. n. al. er. io. sit. analyses can provide researcher stronger evidences for a new good measure scale.. Ch. engchi. 12. i n U. v.
(20) Chapter 3 Research method The purpose of this study was to develop a scale for measuring mobile service quality. The development process was based on the steps proposed by Hinkin (1998). The approach and processes of constructing the scale are: (1)items development, (2)items simplification and content validity establishment, (3)pretesting and initial item reduction, (4)exploratory factor analysis and item reduction, (5)confirmatory data analysis, (6)convergent and discriminant validity assessment, (7)the regression analysis between constructs of M-S-QUAL and perceived value and loyalty. 政 治 大. intentions. Each step is explained in the following sections.. 立. 3.1 Questionnaire design. ‧ 國. 學. The method of developing the questionnaire items is using the deductive approach, which assumes that there is sufficient theoretical foundation to generate the initial set of items. Due to. ‧. the theories about SERVQUAL are developed well, the deductive approach is suitable. The questionnaire scale will be developed from constructs of electronic services quality scale and. Nat. sit. y. correlative literatures. The questionnaire is including four parts: (1) demographic data, (2). er. io. handheld devices usage, (3) Mobile service use experiences, (4) overall service assessment. The third part mobile service use experience is M-S-QUAL measurement, and the fourth part is the. n. al. Ch. i n U. overall quality assessment to establish nomological validity.. engchi. v. 3.1.1 Modifying E-S-QUAL to mobile scenario. The foundation used for constructing the questionnaire was the multiple-item scale for assessing electronic service quality, including both of its original parts E-S-QUAL and E-RecSQUAL parts. E-S-QUAL is a 22-item scale with the four dimensions of efficiency, fulfillment, system availability, and privacy. E-RecS-QUAL is salient to consumers who have non-routine encounters with a site, and contains 11 items in three dimensions: responsiveness, compensation, and contact. E-S-QUAL defines the degree to which a website allows for effective and efficient shopping, purchasing, and product or service delivery. This is different from assessments of the 13.
(21) quality of traditional e-commerce services. E-S-QUAL is an important instrument with an extensive scope, it not only includes the traditional dimensions of service quality, but also covers the technical level, such as ease of use, speed of browsing, privacy and security, and other technical considerations. Mobile commerce is a subset of electronic commerce, and in this context consumers use different devices to purchase online. When consumers use mobile service applications, they will have opinions about the site or application’s usefulness, ease of use, speed of launching, and functions. Thus, the dimensions of technical quality are needed to assess the technical aspects of mobile services.. 政 治 大 foundation of M-S-QUAL. As the survey respondents are likely to be of different ages and their 立 main language will be Chinese, the formal questionnaire was generated in Chinese by translating. The original 33-item SERVQUAL scale developed by Parasuraman et al. (2005) forms the. ‧ 國. 學. the original items into Chinese, with some modification of the descriptions to suit the mobile service context. There are also slight differences in the consumer behavior of electronic. ‧. commerce and mobile commerce customers. E-commerce consumers buy products or services online because it is convenient and can save both time and money. However, in m-commerce,. y. Nat. sit. consumers want to consume in their present location and at a certain time. Further, there are. al. er. io. additional types of intangible products in m-commerce, such as applications and ring tone. n. downloads. To avoid making it difficult for the respondents to answer the questionnaire, some of. Ch. i n U. v. the dimensions were thus separated into two parts: tangible and intangible shopping. For example,. engchi. the dimension of fulfillment was separated into tangible and intangible products. The delivery of intangible products such as application downloads is different from tangible product delivery. Consumers accomplish application downloads in a matter of minutes, whereas tangible products need deliverymen and may take several days. 3.1.2 Developing a preliminary scale According to Hinkin’s guide to the development of scales, item generation can be conducted using a deductive approach based on a theoretical foundation. There are many studies of m-commerce satisfaction, consumer loyalty, and mobile service quality. Turela and Serenko 14.
(22) (2006)0 used the construct of perceived expectations to represent both previous service experience and forward-looking beliefs about a provider’s ability to offer the desired quality. Perceived quality is the served market evaluation of recent service usage experience. It is derived from degree of personalization and service reliability. Perceived value is the price dimension of perceived quality, and addresses the perception of value for money. The three constructs are all related to service quality, but as the service quality assessed in our research relates to mobile services and consumer expectations before use are not considered, the construct of perceived expectations was not used. Perceived service quality is applied instead. The price dimension of. 政 治 大 dimensions are identified as network coverage, mobile device, value-added services, billing 立 system, convenience, and price structure (Choi et al., 2007). Santouridis and Trivellas (2010) perceived quality is not considered in E-S-QUAL. The mobile service quality measurement. ‧ 國. 學. identified the crucial factors that lead to consumer loyalty in the mobile telephone sector to be service quality and consumer satisfaction. The mediation effect of consumer satisfaction on the. ‧. relationship between service quality and consumer loyalty was also examined. We adapted their bill construct to measure the perception of quality in terms of price and billing, which includes. y. Nat. sit. how economical the service is and whether it provides convenient payment procedures (Wang &. er. io. Liao, 2007). Other items were modified from the basic scale to fit the new dimensions.. al. n. v i n C h this concernU by using (2007) addressed engchi. Although the basic scale contains a technical dimension, the content of mobile services varies. Wang and Liao. the conceptualization and. measurement of m-commerce user satisfaction (MCUS) constructs. The MCUS is separated into four sub-constructs that include content quality, appearance, service quality, and ease of use. Kuo, Wub, and Deng (2009) developed an instrument to evaluate the quality of value-added mobile services and further investigated the relationships among service quality, perceived value, consumer satisfaction, and post-purchase intention. The construct of service quality was initially grounded on four dimensions (content quality, navigation and visual design, management and consumer service, and system reliability and connection quality) and was measured by 24 items adapted from Chae et al. (2002). The construct of content quality measures whether the mobile site provides the appropriate and correct information. 15.
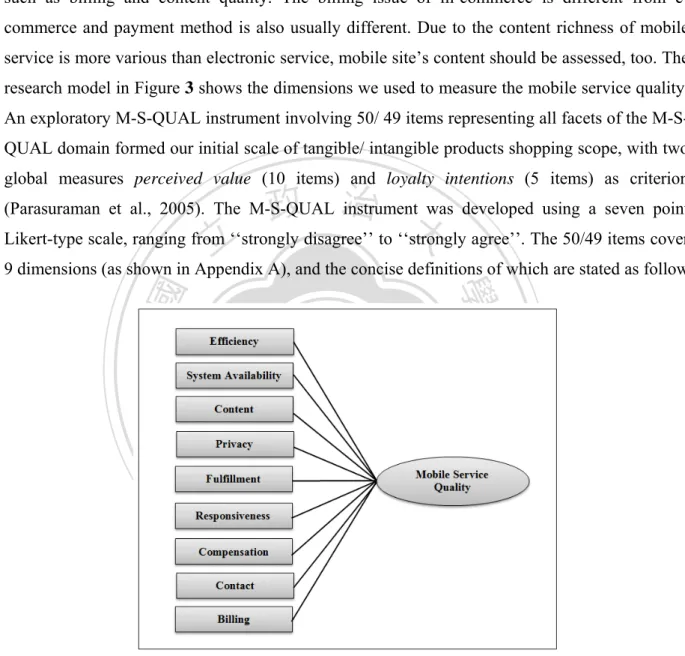
(23) The M-S-QUAL scale contains some additional dimensions and items to the original scale, such as billing and content quality. The billing issue of m-commerce is different from ecommerce and payment method is also usually different. Due to the content richness of mobile service is more various than electronic service, mobile site’s content should be assessed, too. The research model in Figure 3 shows the dimensions we used to measure the mobile service quality. An exploratory M-S-QUAL instrument involving 50/ 49 items representing all facets of the M-SQUAL domain formed our initial scale of tangible/ intangible products shopping scope, with two global measures perceived value (10 items) and loyalty intentions (5 items) as criterion. 政 治 大 Likert-type scale, ranging from ‘‘strongly disagree’’ to ‘‘strongly agree’’. The 50/49 items cover 立 9 dimensions (as shown in Appendix A), and the concise definitions of which are stated as follow. (Parasuraman et al., 2005). The M-S-QUAL instrument was developed using a seven point. ‧. ‧ 國. 學. n. er. io. sit. y. Nat. al. Ch. engchi. i n U. v. Figure 3. Research model Efficiency: The degree to which the site is easy and quick to use System Availability: The possibility of getting the required technical functions and an accurate service promise 16.
(24) Content: Whether the information on the mobile site is appropriate and correct Fulfillment: The extent to which the site’s promises about order delivery and item availability are fulfilled Privacy: The degree to which the consumer perceives the site to be safe and the extent to which their personal information is protected Responsiveness: The effectiveness of problem handling and the returns policy of the site Compensation: The degree to which the site compensates consumers for problems that they encounter. 政 治 大. Contact: The availability of assistance through telephone or online representatives. 立. Billing: Value for money and billing. ‧ 國. 學. 3.1.3 Items simplification and content validity establishment. After items have been generated, they should be subjected to an assessment of content. ‧. validity. This process will serve as a pretest, permitting the deletion of items that are deemed to. y. Nat. be conceptually inconsistent. It is to provide ten naive respondents with construct definitions,. sit. asking them to match items with their corresponding definition, also providing an “unclassified”. er. io. category for items that are determined not to fit one of definitions. An acceptable agreement. al. v i n C h items should U (Mackenzie et al., 1991). The retained e n g c h i represent a reasonable measure of the construct under examination and reduce the need for subsequent scale modification. n. index is the percentage of respondents who correctly classify an item which minimum of 75%. 17.
(25) 3.2 Data collection The items of questionnaire in this research are based on the related literature. In order to consolidate the quality of the scale instrument, we will take a pretest and revise the content of scale, and strengthen completeness of the items. After, the study will conduct an online survey to collect a sample of mobile users. 3.2.1 Sampling and data collection. 治 政 大 questionnaire’s link was posted at have sufficient experiences of mobile services. The online Facebook public activity page立 and discussion boards in PTT Bulletin Board System (BBS). We contacted the potential respondents and screened them to determine whether they. ‧ 國. 學. Potential respondents must have used mobile services or applications for a least three months and have at least three mobile shopping or application download experiences. Mobile. ‧. services are still in the growth stage, and there are many new users who may not have sufficient. y. Nat. mobile service usage experience, who would be inappropriate for the sample. Concise questions. sit. will be developed to filter out inappropriate respondents. The answers that the respondents give. er. io. to the first three questions will determine the questions that they then answer, which will be. al. appropriate to their situation. Qualified respondents will be asked to set the best or the worst. n. v i n mobile service which they have used. C h That is easier forUrespondents to answer the M-S-QUAL i e g c hexperience questionnaire because the best or the worstnservice is usually impressed. The best or. the worst mobile service setting for respondents is random, and it is to exam the correlation between M-S-QUAL and perceived value and loyalty intentions.. 3.3 Statistical methods for data analysis In this study, we employed descriptive statistical analysis, item correlation analysis, exploratory factor analysis (EFA), and confirmatory factor analysis (CFA), and also examined the reliability and validity of the scale. Descriptive statistical analysis is used to summarize the characteristics of respondents and the results of the research variables. Item analysis was 18.
(26) undertaken before exploratory factor analysis, and included missing values analysis and corrected item-total correlation checking. Item analysis can discriminate between related items on the same construct by way of corrected item-total correlations, for which the value should be greater than 0.7. After completing the item analysis, exploratory factor analysis was used to establish the factor structure of each construct and reduce the set of observed variables to a smaller set of variables according to factor loading threshold (greater than 0.4). Quantitative analysis of the questionnaire was conducted using SPSS18 and AMOS18. 政 治 大. software. Confirmatory factor analysis was then undertaken to confirm the factor structure we extracted in the EFA and assess construct validity, both convergent and discriminant. To evaluate. 立. the fit of the models, the ratio of the. to the degree of freedom (. /df), the goodness of fit. ‧ 國. value of. 學. index (GFI), the incremental fit index (IFI), and the normed fit index (NFI) were employed. The /df should be less than 3 and that a good fit is normally assumed when the GFI, IFI,. ‧. and NFI are close to 1, for example, greater than 0.9. A smaller value of. is more desirable in. also increase as the sample size. that it supports the proposed theoretical model, but values of. sit. y. Nat. increases. Hair et al. (2010) indicated that the goodness-of-fit of the overall model is indicated by how well it reproduces the observed covariance matrix among the indicator items. It can be. io. n. al. er. classified into the following four categories: Chi-square measures including chi-square, degree of. i n U. v. freedom (df) and probability. Measures of absolute fit, including the goodness-of-fit index (GFI),. Ch. engchi. root mean square error of approximation (RMSEA), root mean square residual (RMR), standardized root mean square residual (SRMR) and normed chi-square. Incremental fit measures including the normed fit index (NFI) and the comparative fit index (CFI). Parsimony fit measures including the adjusted goodness-of-fit index (AGFI) and the parsimony normed fit index (PNFI). Chi-square (. ) is a basic measurement of the differences between the observed and estimated. covariance matrices (Hair et al. 2010). GFI was an early attempt to produce a fit statistic. The range of possible GFI values is between 0 and 1, and if the value is 0.90 or higher the fit is considered to be good (Hair et al. 2010); however, MacCallum and Hong (1997) suggested that the GFI value could decrease to 0.80 in usage. 19.
(27) Reliability measures the internal consistency and stability of the measurement instrument, which adopted Cronbach-α coefficient to measure the consistency of the items in the same dimension. The α coefficient of these measures is expected to over the threshold of 0.7 to provide an indication of strong item covariance. Validity is the degree to which the instrument can measure the specific content of the construct precisely. The convergent, discriminant, and criterion-related validity was estimated in this research.. 3.4 Pretesting and initial item reduction. 政 治 大 Systems 立 of National Chengchi. Subjects of the pretesting questionnaire survey were the college students of department of Management Information. University. We delivered 140. questionnaires and the overall response was 118. We got rid of the sample that respondents’. ‧ 國. 學. experiences were not sufficient (under one month), and the valid sample size was 96.. ‧. In the pretest phase, EFA was used to pretest the questionnaire in order to reduce the items to a manageable and meaningful set of factors, and the reliability of the internal consistency was. sit. y. Nat. measured using Cronbach’s coefficient alpha. Results of the Kaiser Meyer Olkin (KMO) test and of Bartlett’s sphericity test were obtained before performing the factor analyses. The KMO test. io. n. al. er. indicated whether a sufficient number of items had been predicted by each construct, and. i n U. v. Bartlett’s test indicated whether the items were sufficiently highly correlated to provide a. Ch. engchi. reasonable basis for factor analysis. The value of KMO should be greater than 0.7 and the Bartlett’s sphericity test should reach the significant level. In the EFA stage, all constructs reached the threshold of KMP test and Bartlett’s sphericity. Items would be deleted with the factor loading on one factor was lower than 0.6 or the loadings on more than two factors. There were six items deleted at pretest stage. 20.
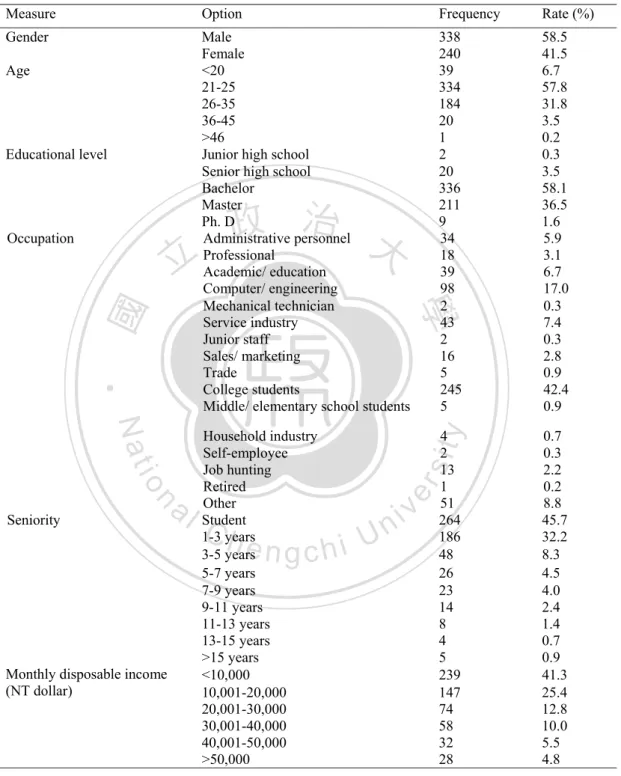
(28) Chapter 4 Data analysis and scale purification 4.1 Sampling data The data used to test the measurement model were gathered from a sample of respondents surfing the PTT Bulletin Board System (BBS) and Facebook. The link to the online questionnaire was posted on the Facebook public activity page and the discussion boards of PTT BBS (the iPhone, Android, WindowsPhone, Q_ary, and Graduate boards). Respondents were first asked whether they had ever used mobile services on mobile handheld devices. If they replied in the. 政 治 大 702 respondents. These respondents were screened by how long they had been using mobile 立 services; only those who had used mobile services for more than three months were directed to. affirmative, they were asked to participate in the survey. It took two weeks to gather data from. ‧ 國. 學. the complete the self-administered multiple-item questionnaire. Of the initial 702 respondents, 578 did so for a valid response rate of 82%. The respondents gathering result is shown in Table 3.. ‧. They were instructed in the questionnaire to answer the questions by assessing either their perceived best or worst mobile service, and the data were categorized according to whether the. y. Nat. sit. mobile service is pertaining to tangible or intangible product transactions. For each question,. er. io. respondents were asked to choose the response which best described their level of agreement.. n. 3. Respondents gathering result aTable iv l C Number n h e n g702c h i U Overall respondents Invalid questionnaires Valid questionnaires. Rate (%) 100. 124. 17.66. 578. 82.34. Table 4 summarizes the demographic descriptive statistics of the sample. The demographic descriptive statistics for the sample showed it included 338 (58.5%) males and 240 (41.5%) females. The percentage of males was greater than that of females. Most of the respondents were between 21 and 35 years old (89.6%), had a bachelor’s or master’s degree (94.6%), and had a monthly disposable income of NT$20,000 or less (66.7%). Many respondents were professionals in information technology-related industries or college students. (59.4%). 21.
(29) Measure. Option. Frequency. Rate (%). Gender. Male Female <20 21-25 26-35 36-45 >46 Junior high school Senior high school Bachelor Master Ph. D Administrative personnel Professional Academic/ education Computer/ engineering Mechanical technician Service industry Junior staff Sales/ marketing Trade College students Middle/ elementary school students. 338 240 39 334 184 20 1 2 20 336 211 9 34 18 39 98 2 43 2 16 5 245 5. 58.5 41.5 6.7 57.8 31.8 3.5 0.2 0.3 3.5 58.1 36.5 1.6 5.9 3.1 6.7 17.0 0.3 7.4 0.3 2.8 0.9 42.4 0.9. y. Table 4. Demographic descriptive statistics. 0.7 0.3 2.2 0.2 8.8 45.7 32.2 8.3 4.5 4.0 2.4 1.4 0.7 0.9 41.3 25.4 12.8 10.0 5.5 4.8. Occupation. io. n. al. Monthly disposable income (NT dollar). Ch. engchi. 22. ‧. Nat Seniority. Household industry Self-employee Job hunting Retired Other Student 1-3 years 3-5 years 5-7 years 7-9 years 9-11 years 11-13 years 13-15 years >15 years <10,000 10,001-20,000 20,001-30,000 30,001-40,000 40,001-50,000 >50,000. 學. ‧ 國. 立. 政 治 大. 4 2 13 1 51 264 186 48 26 23 14 8 4 5 239 147 74 58 32 28. sit. Educational level. er. Age. i n U. v.
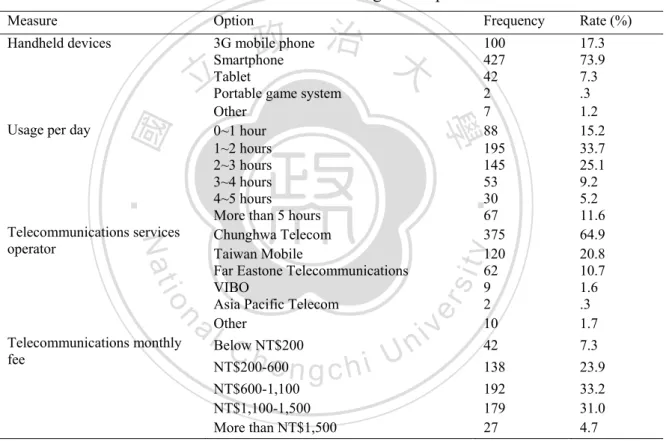
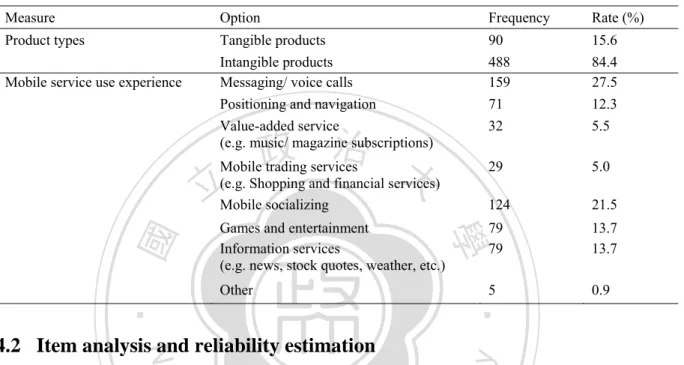
(30) Most respondents’ handheld devices were smartphones (73.9%), and they used their handheld devices for between one and two hours per day (33%). We also looked into the distribution of the respondents across telecommunications services operators. The proportions of respondents who were customers of Chunghwa Telecom, Taiwan Mobile, Far Eastone Telecommunications, VIBO, and Asia Pacific Telecom were 64.9%, 20.8%, 10.7%, 1.6%, and 0.3%, respectively (Table 5). Table 5. Handheld devices usage descriptive data Measure. Option. Frequency. Rate (%). Handheld devices. 3G mobile phone Smartphone Tablet Portable game system Other 0~1 hour 1~2 hours 2~3 hours 3~4 hours 4~5 hours More than 5 hours Chunghwa Telecom Taiwan Mobile Far Eastone Telecommunications VIBO Asia Pacific Telecom Other Below NT$200 NT$200-600 NT$600-1,100 NT$1,100-1,500 More than NT$1,500. 100 427 42 2 7 88 195 145 53 30 67 375 120 62 9 2 10 42 138 192 179 27. 17.3 73.9 7.3 .3 1.2 15.2 33.7 25.1 9.2 5.2 11.6 64.9 20.8 10.7 1.6 .3 1.7 7.3 23.9 33.2 31.0 4.7. n. al. Ch. engchi. y. sit er. io Telecommunications monthly fee. ‧. Nat. Telecommunications services operator. 學. Usage per day. ‧ 國. 立. 政 治 大. i n U. v. Table 6 shows the respondents’ mobile service use experiences. 488 (84.43%) respondents answered the questionnaires based on their intangible product shopping experience, and 90 (15.57%) answered the questionnaires according to their experience of shopping for tangible products.. The ranking of service types were messaging/voice calls (27.5%), mobile 23.
(31) socializing (21.5%), games and entertainment (13.7%), and information services (13.7%), to positioning and navigation (12.7%). Table 6. Mobile service use experience descriptive data Measure. Option. Frequency. Rate (%). Product types. Tangible products Intangible products Messaging/ voice calls Positioning and navigation Value-added service (e.g. music/ magazine subscriptions). 90 488 159 71 32. 15.6 84.4 27.5 12.3 5.5. Mobile trading services (e.g. Shopping and financial services) Mobile socializing. 29. 5.0. 124. 21.5. Games and entertainment Information services (e.g. news, stock quotes, weather, etc.). 79 79. 13.7 13.7. Other. 5. 0.9. Mobile service use experience. 立. 政 治 大. ‧. ‧ 國. 學. y. Nat. 4.2 Item analysis and reliability estimation. sit. The 45-item and 43-item instruments were refined by analyzing the pooled data which were. er. io. collected from experienced users across tangible and intangible products shopping and on. al. n. v i n Ch U develop a reliable instrument that accurately for various types of mobile e n gmeasures c h i M-S-QUAL. different types of mobile handheld devices. Because the primary purpose of this study was to service, it was considered appropriate to pool the sample data.. The first step in purifying the instrument was to delete items based on Cronbach’s and corrected item-total correlations (Cronbach, 1951). Next, prior to identifying its underlying dimensions using exploratory factor analysis, based on the assumption that all items in the M-SQ instrument share a common core, the coefficient and corrected item-total correlations for the 45-item/43-item M-SQ instrument of tangible/intangible products scope were calculated. Initially, the value of the Cronbach's ranged from 0.83 to 0.97 across nine constructs of both tangible and intangible products transactions (Table 7). We then used the item’s corrected item-total correlation of each item as the criterion for deciding whether to delete the item. Although the 24.
(32) corrected item-total correlation value recommended is greater than 0.5 (Churchill, 1979), we chose a stricter criterion of 0.7. If the corrected item-total correlation value was below 0.7, the item was deleted. Table 7. Item analysis – reliability Construct. 7 7 7 4 3. 立. Intangible products. Cronbach's 0.96 0.92 0.96 0.93. Number of items 4 3 7 3. Cronbach's 0.94 0.94 0.94 0.93. 0.97 0.96 0.95 0.93 0.83. 7 7 5 4 3. 0.96 0.95 0.90 0.93 0.92. 政 治 大. 學. Content Privacy Contact Billing Fulfillment Responsiveness Compensation. Number of items 4 3 7 3. ‧ 國. Efficiency System available. Tangible products. ‧. We then recalculated the Cronbach's values for the remaining items, examined the new corrected item-total correlations, and deleted more items if necessary. The cut-off values were. Nat. sit. y. considered high enough to ensure that the items retained were adequate measures of the M-S-. er. io. QUAL construct. Three items were eliminated at this stage, resulting in a 44-item scale for measuring tangible products M-S-QUAL and a 41-item scale for measuring intangible products. n. al. Ch. M-S-QUAL (as shown in Table 8).. engchi. 25. i n U. v.
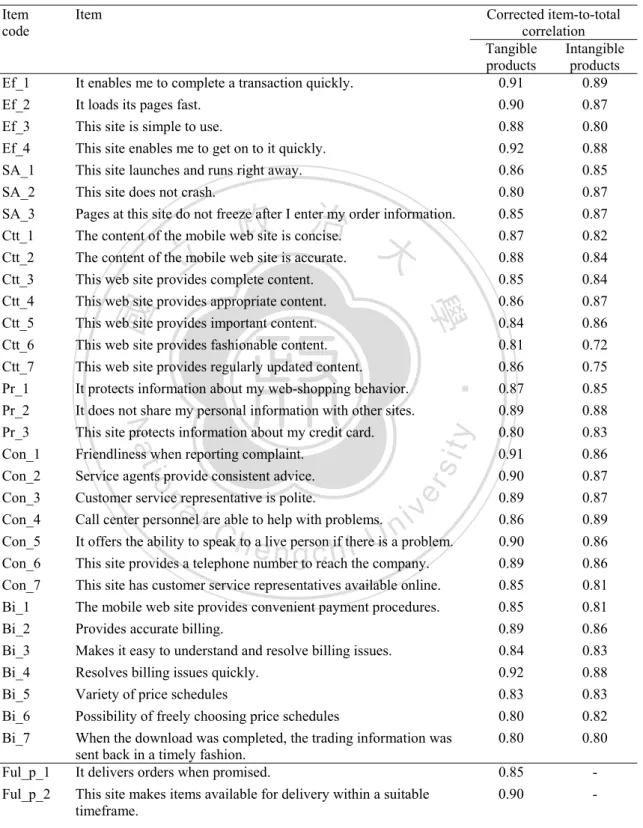
(33) Table 8. Item analysis – corrected item- total correlation Item code. Item. Ef_1 Ef_2 Ef_3 Ef_4 SA_1. It enables me to complete a transaction quickly. It loads its pages fast. This site is simple to use. This site enables me to get on to it quickly. This site launches and runs right away.. SA_2 SA_3 Ctt_1 Ctt_2 Ctt_3 Ctt_4 Ctt_5 Ctt_6. This site does not crash. Pages at this site do not freeze after I enter my order information. The content of the mobile web site is concise. The content of the mobile web site is accurate. This web site provides complete content. This web site provides appropriate content. This web site provides important content. This web site provides fashionable content.. 0.80 0.85 0.87 0.88 0.85 0.86 0.84 0.81. 0.87 0.87 0.82 0.84 0.84 0.87 0.86 0.72. Ctt_7 Pr_1 Pr_2 Pr_3 Con_1 Con_2 Con_3 Con_4. This web site provides regularly updated content. It protects information about my web-shopping behavior. It does not share my personal information with other sites. This site protects information about my credit card. Friendliness when reporting complaint. Service agents provide consistent advice. Customer service representative is polite. Call center personnel are able to help with problems.. 0.86 0.87 0.89 0.80 0.91 0.90 0.89 0.86. 0.75 0.85 0.88 0.83 0.86 0.87 0.87 0.89. 0.90 0.89 0.85 0.85 0.89 0.84 0.92 0.83. 0.86 0.86 0.81 0.81 0.86 0.83 0.88 0.83. Possibility of freely choosing price schedules When the download was completed, the trading information was sent back in a timely fashion. It delivers orders when promised.. 0.80 0.80. 0.82 0.80. 0.85. -. This site makes items available for delivery within a suitable timeframe.. 0.90. -. er. sit. y. ‧. ‧ 國. 學. Ful_p_2. al. v i n C to a live person if thereUis a problem. It offers the ability to speakh e n tocreach h ithe company. This site provides a telephone numberg n. Ful_p_1. io. Bi_6 Bi_7. 政 治 大. Nat. Con_5 Con_6 Con_7 Bi_1 Bi_2 Bi_3 Bi_4 Bi_5. 立. Corrected item-to-total correlation Tangible Intangible products products 0.91 0.89 0.90 0.87 0.88 0.80 0.92 0.88 0.86 0.85. This site has customer service representatives available online. The mobile web site provides convenient payment procedures. Provides accurate billing. Makes it easy to understand and resolve billing issues. Resolves billing issues quickly. Variety of price schedules. 26.
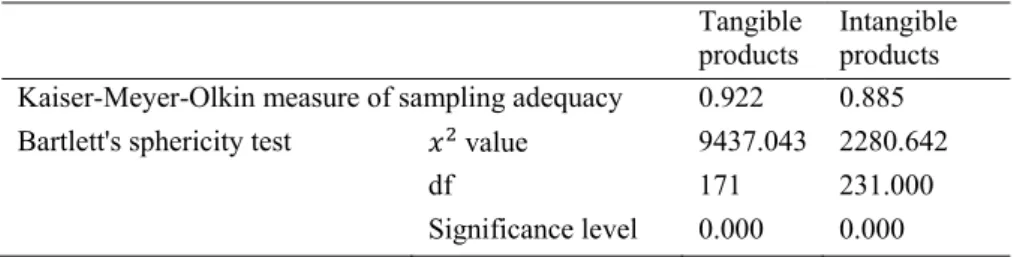
(34) Item code. Item. Ful_p_3 Ful_p_4 Ful_p_5 Ful_p_6. It quickly delivers what I order. It sends out the items ordered. It has in stock the items the company claims to have. It is truthful about its offerings.. Ful_p_7 Re_p_1 Re_p_2 Re_p_3 Re_p_4 Com_p_1 Com_p_2 Ful_v_1. It makes accurate promises about delivery of products. It provides me with convenient options for returning items. This site handles product returns well. This site offers a meaningful guarantee. It tells me what to do if my transaction is not processed. This site compensates me for problems it creates. It compensates me when what I ordered doesn’t arrive on time. It delivers orders when promised.. Ful_v_2 Ful_v_3 Ful_v_4 Re_v_1 Re_v_2. This site makes items available for delivery within a suitable timeframe. It quickly delivers what I order. It has in stock the items the company claims to have. It provides me with convenient options for returning items. This site handles product returns well.. Re_v_3 Com_v_1 Com_v_2 Com_v_3. This site offers a meaningful guarantee. This site compensates me for problems it creates. It compensates me when what I ordered doesn’t arrive on time. It picks up items I want to return from my home or business.. 立. Corrected item-to-total correlation Tangible Intangible products products 0.80 0.89 0.81 0.80 -. 政 治 大. n. er. io. sit. y. ‧. ‧ 國. 學. Nat. al. i n U. Ch. v. 0.82 0.84 0.85 0.88 0.75 0.74 0.79 -. 0.76. -. 0.83. -. 0.80 0.83 0.87 0.89. -. 0.89 0.87 0.87 0.76. i e n of g cthehM-S-QUAL 4.3 Identifying the factor structure construct An exploratory factor analysis (EFA) was conducted to examine the factor structure of the 44- and 41-item instruments in more detail. Data on tangible products M-S-QUAL (90valid responses) and intangible products M-S-QUAL (488 responses) were analyzed separately. Before proceeding with our exploratory factor analysis, we measured KMO and conducted Bartlett’s sphericity test to check whether the inter-correlation matrix contained sufficient common variance. As shown in Table 9, a KMO measure of greater than 0.7 and a significant,Bartlett's sphericity test result, indicating exploratory factor analysis should be conducted. 27.
(35) Table 9. KMO measure and Bartlett’s sphericity test Tangible products 0.922 9437.043 171 0.000. Kaiser-Meyer-Olkin measure of sampling adequacy Bartlett's sphericity test value df Significance level. Intangible products 0.885 2280.642 231.000 0.000. 4.3.1 Exploratory factor analysis. 政 治 大. We then conducted an EFA to identify the dimensionality of the 44- and 41-item scale using the principle component analysis as the extraction technique, and the varimax orthogonal. 立. rotation method. We extracted factors with eigenvalues greater than or equal to 1, yielding four. ‧ 國. 學. factors for tangible products M-S-QUAL and five factors for intangible products. The employed decision rules applied to identify the factors underlying the M-S-QUAL construct were (1) delete items with a factor loading of less than 0.7 or the loading of greater than 0.3 on two or more. ‧. factors, (2) mantain a simple factor structure, and (3) exclude single-item factors from the. sit. y. Nat. perspective of parsimony (Hinkin, 1998; Straub, 1989).. Three iterative runs based on the aforesaid rules resulted in the deletion of 29 tangible. io. n. al. er. product M-S-QUAL items. At the end of the factor analysis procedure, we obtained a 4-construct,. i n U. v. 15-item instrument. The four constructs were interpreted as efficiency, fulfillment, contact, and. Ch. engchi. recovery, explaining 81.34% of the variance in the dataset. Due to the small sample size (90) for the tangible products shopping experiences, it was not appropriate to conduct CFA in the next stage. For CFA, a minimum sample of 200 has been recommended (Hoelter, 1983), so the factor analysis of tangible products M-S-QUAL ended in this stage. Table 10 summarizes the factor loadings for the condensed 15-item instrument. The significant loading of items on each factor indicates convergent validity, while the discriminant validity of the instrument found supports from the fact that items showed little cross-loadings. 28.
(36) Table 10. EFA results for tangible products M-S-QUAL Construct. Item code. Item description. Efficiency. Ef_4. This site enables me to get on to it quickly.. Ef_1. It enables me to complete a transaction quickly. It loads its pages fast.. .858. Pages at this site do not freeze after I enter my order information. This site does not crash.. .804. .894. Ful_p_4. This site makes items available for delivery within a suitable timeframe. It sends out the items ordered.. Ful_p_1. It delivers orders when promised.. .791. Ful_p_6. It is truthful about its offerings.. .744. Con_5. It offers the ability to speak to a live person if there is a problem. This site provides a telephone number to reach the company. Service agents provide consistent advice.. .838. This site handles product returns well. This site offers a meaningful guarantee. It provides me with convenient options for returning items.. .811 .767 .766. SA_3 SA_2 Fulfillment. Contact. Ful_p_2. Con_2 Re_p_2 Re_p_3 Re_p_1. Composite reliability. Average variance extracted. 8.50. 55.46. 0.91. 66.70%. 1.85. 66.59. 0.89. 66.52%. 75.92. 0.86. 66.57%. 81.34. 0.82. 61.09%. .704. 政 治 大 .826. .820. 1.57. .789 1.00. Nat. sit. y. ‧. Recovery. Variance explained (%). 學. Con_6. 立. Eigenvalue. .826. ‧ 國. Ef_2. Rotated factor loading .880. io. er. The EFA of intangible products M-S-QUAL also followed the rules, and 11 items were deleted. We obtained a 7-factor, 29-item instrument in this stage and used the result to proceed to. al. n. CFA (see Table 11).. Ch. engchi. i n U. v. Table 11. EFA results for intangible product M-S-QUAL Construct. Item code. Item description. Contact. Con_4. Call-center personnel are able to help with problems. It offers the ability to speak to a live person if there is a problem. Service agents provide consistent advice. This site provides a telephone number to reach the company. Friendliness when reporting a complaint.. Con_5 Con_2 Con_6 Con_1. 29. Rotated factor loading .829 .791 .782 .758 .751. Eigenvalue. 9.53. Variance Explained (%). 49.15.
(37) Construct. Item code. Item description. Recovery. Re_v_3. This site offers a meaningful guarantee.. Rotated factor loading .904. This site handles product returns well. It provides me with convenient options for returning Re_v_1 items. It picks up items I want to return from my home or Com_v_3 business. This site makes items available for delivery within a Ful_v_2 suitable timeframe. It delivers orders when promised. Ful_v_1 It has in stock the items the company claims to have. Ful_v_4 It quickly delivers what I order. Ful_v_3 It does not share my personal information with other Pr_2 sites. It protects information about my web-shopping Pr_1 behavior. This site protects information about my credit card. Pr_3 It loads its pages fast. Ef_2 It enables me to complete a transaction quickly. Ef_1 This site enables me to get on to it quickly. Ef_4. .891 .873. Re_v_2. 2.08. 70.36. .779. 1.17. 75.60. 1.1. 80.39. .733 .813 .780 .777. y. sit. io. n. Ch. .837 .758 .741 .856. ‧. Nat. 4.3.2 Confirmatory factor analysis. al. 60.35. .884. 學. Efficiency. 立. 2.33. er. Privacy. Variance Explained (%). .718. 政 治 大. ‧ 國. Fulfillment. Eigenvalue. i n U. v. The purpose of the analysis in this stage was to test whether the intangible products M-. engchi. SQ’s seven dimensions resulted from EFA were appropriate indicators of mobile service quality. The factor structure extracted by EFA needs to be confirmed by drawing model in AMOS Graphics and linking the valid sample data to the model to calculate path coefficients and model fits. We deleted the items, namely, the observed variables in AMOS, with the low path coefficients (below 0.7) and checked the model fits iteratively. CFA is a part of structural equation modeling (SEM) which is permitting existence of measurement errors or residuals between exogenous variables and endogenous variables. Modification indices suggested remedies to discrepancies between the proposed and estimated model. However, there was not much we can do by way of adding regression lines to fix model 30.
(38) fit, as all regression lines between latent and observed variables are already in place. We looked the modification indices for the covariances in CFA. We could not covary error terms with observed or latent variables, or with other error terms that are not part of the same factor. The modification available to us is to covary error terms that are part of the same factor. The other model adjustment method depends on the standardized residual covariances among observed variables. If the values of the standardized residual covariances were too high (greater than 2), the items could be considered for deletion. The above three methods were executed until the model fits were good. The final model after CFA is shown in Figure 4, and all. 政 治 大. paths in the model were confirmed, indicating a good fit between the model and the data. We. 立. obtained a 4-construct, 16-item instrument, and used the standardized factor loading to calculate. ‧ 國. 學. composite reliability and average variance extracted (AVEs) of each construct to verify the convergent validity (see Table 12).. Privacy. Contact. Pr_3 Pr_1 Pr_2 Con_1 Con_2 Con_5 Con_6. Recovery. Re_v_1 Re_v_2 Re_v_3. Composite reliability. Average variance extracted. y. 0.90 0.91 0.93 0.92 0.88 0.88. sit. al. er. Fulfillment. This site enables me to get on to it quickly. It enables me to complete a transaction quickly. It loads its pages fast It quickly delivers what I order. It delivers orders when promised. This site makes items available for delivery within a suitable timeframe. This site protects information about my credit card. It protects information about my web-shopping behavior. It does not share my personal information with other sites. Friendliness when reporting a complaint. Service agents provide consistent advice. It offers the ability to speak to a live person if there is a problem. This site provides a telephone number to reach the company. It provides me with convenient options for returning items. This site handles product returns well. This site offers a meaningful guarantee.. n. Ef_4 Ef_1 Ef_2 Ful_v_3 Ful_v_1 Ful_v_2. Factor loading. io. Efficiency. Item. Nat. Item code. ‧. Table 12. CFA and reliability results (intangible products). Construct. Ch. engchi. 31. i n U. v. 0.88 0.91 0.93 0.92 0.92 0.82. 0.939. 83.79%. 0.924. 80.26%. 0.930. 81.59%. 0.916. 78.36%. 0.956. 87.81%. 0.80 0.92 0.94 0.94.
(39) Model fit measures can be obtained to assess how well the proposed model captures the covariance between all items or measures in the model. If the constraints the researcher has imposed on the model are inconsistent with the sample data, then the results of statistical tests of model fit will indicate a poor fit and the model will be rejected. Poor fit may be due to some items measuring multiple factors, or may be attributable to some items under a factor being more related to others (wiki). The Chi-square (x statistic is used most often as a descriptive index of fit, rather than as a statistical test. A smaller x value indicates s better fitting models with an insignificant x being desirable. In larger sample sizes, power is so high that even models with. 政 治 大 fit and the CFA results are summarized in Table 13. The overall structural fit results of these 立. only trivial misspecifications are likely to be rejected. The recommended values for goodness-ofanalyses showed the model provided a reasonable degree of fit.. ‧ 國. 學. Table 13. Comparisons of goodness-of-fit indices for the model Criterion Guidelines. CFA Results (Intangible) 232.675 92. y. sit. io. n. al. >.80 (MacCallum & Hong, 1997) <.10 (Steiger, 1990) <.05 (Jöreskog & Sörbom, 1992) <3 (Hair et al., 2010). er. Nat. Chi-square ( ) Degree of freedom Absolute fit measures GFI RMSEA SRMR Normed chi-square ( / Incremental fit measures NFI CFI Parsimony fit measurement AGFI. ‧. Model Fit Indices. Ch. engchi. i n U. v. 0.945 0.056 2.529. >.90 (Bentler, 1992) >.90 (Gerbing & Anderson, 1992). 0.97 0.982. >.80 (MacCallum & Hong, 1997). 0.918. 4.4 Assessing reliability and validity Reliability measures the internal consistency and stability of the measurement instrument, in which the Cronbach's-α coefficient is used to measure the consistency of items in the same dimension. The α coefficients of such measures are expected to be over the threshold of 0.7 to provide an indication of strong item covariance. Validity represents the degree to which the 32.
數據
+7
相關文件
The purpose of this research is to study a tiling problem: Given an m × n chessboard, how many ways are there to tile the chessboard with 1 × 2 dominoes and also ”diagonal”
A constant state u − is formed on the left side of the initial wave train followed by a right facing (with respect to the velocity u − ) dispersive shock having smaller
We propose two types of estimators of m(x) that improve the multivariate local linear regression estimator b m(x) in terms of reducing the asymptotic conditional variance while
為了更進一步的提升與改善本校資訊管理系 的服務品質,我們以統計量化的方式,建立
Reading Task 6: Genre Structure and Language Features. • Now let’s look at how language features (e.g. sentence patterns) are connected to the structure
(a) The magnitude of the gravitational force exerted by the planet on an object of mass m at its surface is given by F = GmM / R 2 , where M is the mass of the planet and R is
At least one can show that such operators has real eigenvalues for W 0 . Æ OK. we did it... For the Virasoro
The temperature angular power spectrum of the primary CMB from Planck, showing a precise measurement of seven acoustic peaks, that are well fit by a simple six-parameter
