利用蛋白質結構中的功能區域交互作用推測蛋白質交互作用
59
0
0
全文
(2) 利用蛋白質結構中的功能區域交互作用推測 蛋白質交互作用. Inferring Protein-protein Interactions from Structural Domain-domain Interactions. 研 究 生:陳宏助. Student:Hung-Chu Chen. 指導教授:楊進木. Advisor:Jinn-Moon Yang. 國 立 交 通 大 學 生 物 資 訊 所 碩 士 論 文. A Thesis Submitted to Institute of Bioinformatics National Chiao Tung University in partial Fulfillment of the Requirements for the Degree of Master in Bioinformatics. July 2005 Hsinchu, Taiwan, Republic of China. 中 華 民 國 九 十 四 年 七 月.
(3) 利用蛋白質結構中的功能區域交互作用推測蛋白質交互作用 學生:陳宏助. 指導教授:楊進木 國立交通大學生物資訊所碩士班 摘. 要. 功能區域-功能區域之間的交互關係對於研究、預測以及註解蛋白質-蛋白質交互作 用是很有幫助的。然而目前大規模透過實驗證實的的功能區域-功能區域交互作用還無 法產生。在本論文中我們發展了一套新的方法從已知三級結構的蛋白質聚合物中,計算 粹取功能區域-功能區域交互作用以及利用其來預測蛋白質-蛋白質交互作用。我們總共 得到 1008 對的功能區域-功能區域交互作用,我們認為還有眾多的蛋白質-蛋白質交互作 用是透過這些已知的功能區域-功能區域交互作用所產生。在不同的分數條件下,利用 這些功能區域-功能區域交互作用,我們的方法總共預測了超過 101483 對的蛋白質-蛋白 質交互作用。 我們建構了一個叫做「DAPID」的蛋白質-蛋白質交互作用資料庫,DAPID 收錄了 結構上的功能區域-功能區域交互作用跟我們利用這些功能區域所預測出來的蛋白質-蛋 白質交互作用以及目前 DIP 所有的蛋白質資料。DAPID 包含了從 1008 對的功能區域功能區域交互作用所預測出來的 101483 對的蛋白質-蛋白質交互作用(72﹪),1241 對 在 PDB 資料庫中已知的蛋白質-蛋白質交互作用(0.8﹪)以及 DIP 資料庫中所紀錄的 38131 對的蛋白質-蛋白質交互作用(27﹪) 。DAPID 主要包含了 8 種物種的蛋白質-蛋白 質 交 互 作 用 , 包 括 Homo sapiens 、 Mus musculus 、 Rattus norvegicus 、 Drosophila melanogaster、Caenorhabditis elegans、Saccharomyces cerevisiae、Helicobacter pylori 以 及 Escherichia coli。我們的結果顯示我們的計分函式的值與 TP/FP 比值跟基因表現的相 關係數都呈現高度正相關。將我們的計分函式的分數門檻設定在 0.5 時,所預測出來的 蛋白質-蛋白質配對在基因表現相關係數上與 Jansen 等所產生的非交互作用蛋白質配對 或 DIP 中的 S. cerevisiae 蛋白質做基因表現的相關係數的比較,我們預測的蛋白質-蛋白 質配對在基因表現相關係數上都較為顯著。. I.
(4) Inferring Protein-protein Interactions from Structural Domain-domain Interactions Student: Hung-Chu Chen. Advisor: Jinn-Moon Yang Institute of Bioinformatics. National Chiao Tung University ABSTRACT Domain-domain interactions can be useful for validating, annotating, and predicting protein-protein interactions. Currently, the large-scale experimentally determined domain-domain interactions do not exist. In this thesis, we have developed an approach to computationally derive protein-protein interactions and domain-domain interactions from 3D protein complexes. We obtained 1008 interacting domain-domain from Protein Data Bank (PDB) and considered many protein pairs may also interact by the same interacting domain pairs. Our method predicted over 101483 protein-protein interactions based on interacting domain pairs and different thresholds of our new scoring function. We have developed a domain-annotated protein-protein interaction database, termed DAPID, based on these inferred protein-protein interactions and experimental database, Database of Interacting Protein (DIP). The DAPID includes 101483 protein-protein interactions (72%) derived from 1008 structural domain pairs from Protein Data Bank (PDB), 1241 interactions (0.8%) directly obtained from 3D complexes in PDB, and 38131 interactions (27%) summarized from Database of Interacting Protein (DIP). The DAPID has eight common animal models, including Homo sapiens, Mus musculus, Rattus norvegicus, Drosophila melanogaster, Caenorhabditis elegans, Saccharomyces cerevisiae, Helicobacter pylori and, Escherichia coli. Experimental results show that the gene-expression profiles (and the ratio of true to false positives (TP/FP) are highly correlated to the values of our scoring function. At the same time, our predicting protein-interaction pairs, whose scores greater than 0.5 have higher probability to co-express than the ones of non-interacting set (defined in Jansen et al. , Science 2003) or DIP set in S. cerevisiae.. II.
(5) 致. 謝. 在這兩年來的研究所生涯中,首先衷心感謝指導教授—楊進木老師。 在整個研究過程中,老師花費了很多心力及時間,悉心指導我的論文與研 究。老師對於學術研究的細心、嚴謹、堅持與執著,將是我未來持續學習 的目標。 這本論文能夠順利完成,要感謝實驗室所有同學的幫忙。特別感謝強 哥、一原,強哥敏銳的研究天份以及撰寫程式的功力,讓我獲益良多,讓 我的研究得以順利進行。一原是長腳的函式庫、我只要描述我的 input 格 式跟我要的 output 格式,他就能給我一個函式幫我搞定。還要感謝跟我一 起住的室友,一起討論程式的朋友,一起襪三的戰友,一起吃飯的飯友。 另外要感謝我的家人,默默地在背後給我支持、鼓勵與動力,讓我可 在求學過程中無所顧忌,全力衝刺。在我心情最低落的時候,給予我無盡 的鼓勵、安慰與溫暖。在我情緒最愉快的時刻,陪我一起出遊、聊天,抒 解壓力。沒有他們的陪伴,我很難走到現在。 要感謝的人太多太多了,感謝所有幫助過我的人。 宏助 夏'05. III.
(6) CONTENTS Abstract (in Chinese) ············································································································ I Abstract ································································································································ II Acknowledgements (in Chinese) ·························································································· III Contents ································································································································ IV List of Tables ························································································································ V List of Figures······················································································································· VI. Chapter 1 Introduction ............................................................................................................ 1 1.1 Motivations and Purposes.............................................................................................1 1.2 Related Works...............................................................................................................3 1.2.1 Probabilistic Domain-domain Interaction Models ............................................4 1.2.2 Interologs ...........................................................................................................5 1.3 Thesis Overview ...........................................................................................................6 Chapter 2 Materials and Methods .......................................................................................... 8 2.1 Preparing Dataset from PDB Database ........................................................................8 2.2 Mapping Structural Binding Site to Domain-domain Interactions...............................9 2.2.1 Transform 4-Letter PDB and Chain Code to Swiss-prot Accession Number....9 2.2.2 Identify Domain Architectures of Structural Binding Site .............................. 11 2.3 Inferring Protein-protein Interactions from Domain-domain Interactions .................12 2.3.1 Generate Protein-protein Interaction Candidates ............................................12 2.3.2 Scoring Function .............................................................................................12 2.4 Verification .................................................................................................................17 2.4.1 TP/FP Ratio .....................................................................................................17 2.4.2 Genes Expression Profiles ...............................................................................17 Chapter 3 Results and Discussions ....................................................................................... 18 3.1 Inferred Protein-protein Interactions from Domain-domain Interactions ..................18 3.2 Determine the Threshold ............................................................................................18 3.3 Correlation Coefficients of Gene Expression.............................................................20 3.4 Examples ....................................................................................................................20 3.5 Web Service ................................................................................................................21 Chapter 4 Conclusions and Future Works........................................................................... 22 4.1 Summary.....................................................................................................................22 4.2 Major Contributions and Future Works......................................................................23 References ............................................................................................................................... 48. IV.
(7) List of Tables. Table 1. Protein-protein interactions stored in different database ········································· 25 Table 2. 1008 Domain-domain interactions we inferred from structural protein-protein interactions ··························································································································· 26 Table 3. The keywords list (887 keywords) we used in our methods···································· 34. V.
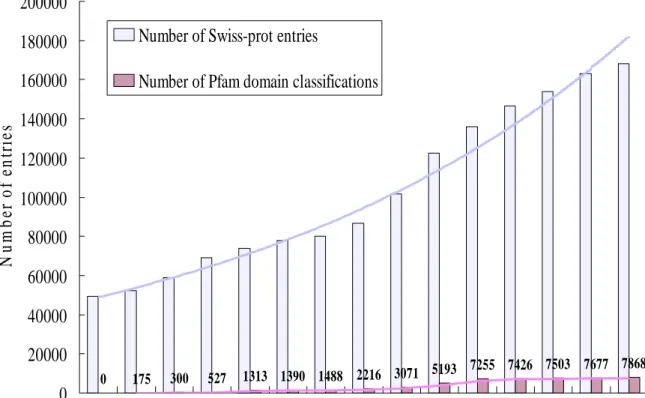
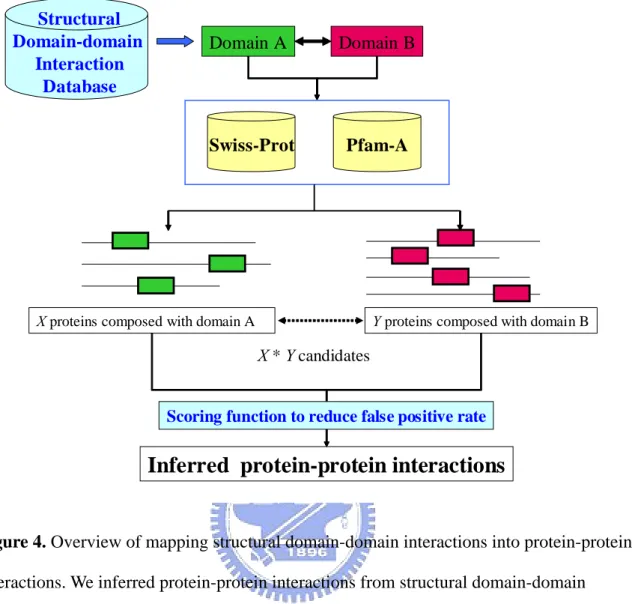
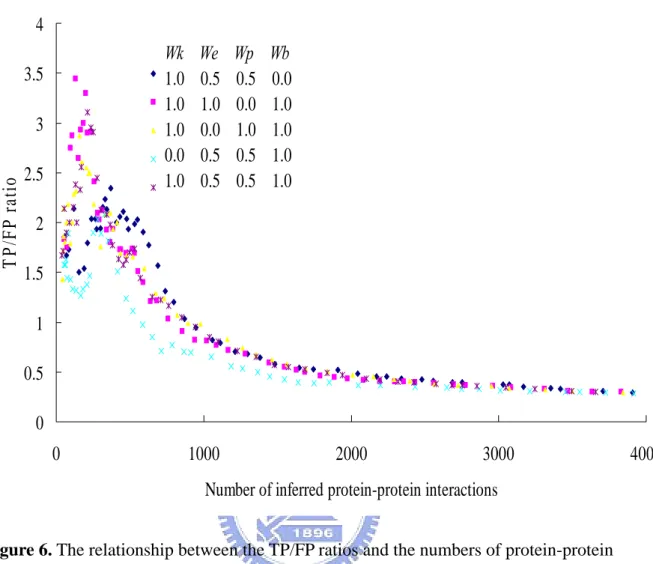
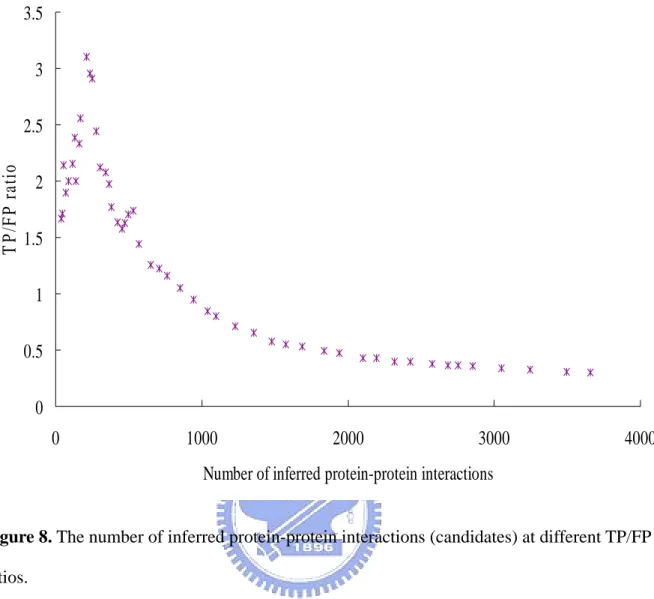
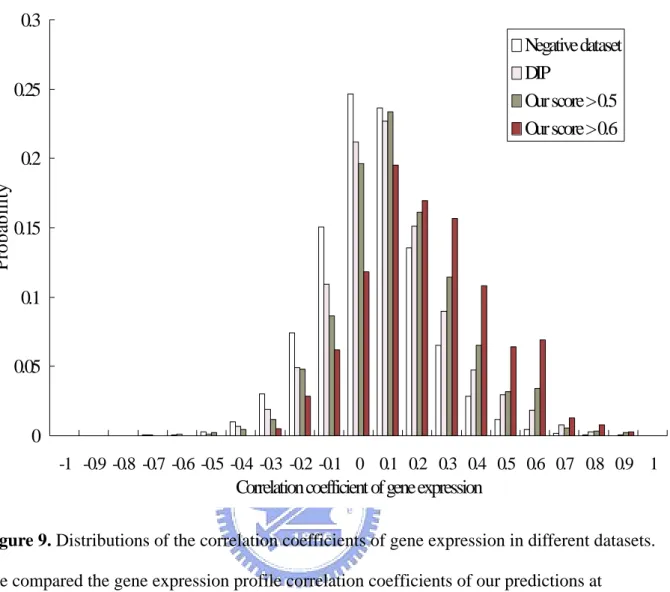
(8) List of Figures. Figure 1. The growth in the number of proteins known in the Swiss-prot versus the growth in the number of unique domains in the Pfam ········································································· 38 Figure 2. Core ideas of our method ···················································································· 39 Figure 3. The flowchart of extracting structural domain-domain interactions from PDB ··· 40 Figure 4. Overview of mapping structural domain-domain interactions into protein-protein interactions ························································································································· 41 Figure 5. An example of the protein annotation (FGF1 Human) in the Swiss-prot database ·············································································································································· 42 Figure 6. The relationship between the TP/FP ratios and the numbers of protein-protein candidates with different weight combinations of scoring terms ········································· 43 Figure 7. The relationship between the values of our scoring function and the TP/FP ratios ·············································································································································· 44 Figure 8. The number of inferred protein-protein interactions (candidates) at different TP/FP ratios ··································································································································· 45 Figure 9. Distributions of the correlation coefficients of gene expression in different datasets ·············································································································································· 46 Figure 10. The illustrations of DAPID web service ··························································· 47. VI.
(9) Chapter 1 Introduction 1.1 Motivations and Purposes The cellular machinery is a complex dynamic system with a multitude of biomolecular interactions. Simply knowing the existence of genes and proteins does not tell us much about the biological processes in which they participate. The interaction between proteins is one of the most important features of protein functions. A comprehensive description of protein-protein interactions is necessary to understand the genetic program of life. Behind protein-protein interactions there are protein domains interacting physically with one another to perform the necessary functions. Therefore, understanding protein interactions at the domain level gives a global view of the protein interaction network, and possibly of protein functions. Domains are structural subunits of proteins that can be thought of as ‘building blocks’ that are conserved during evolution. Proteins can consist of a single domain, or more frequently as a combination of several domains: in prokaryotes about one-third of all proteins are single domain while in eukaryotes the fraction is about 20% [1]. Nature is able to construct a vast array of different proteins by combining domains, and the present-day variety of domains is believed to have evolved from a relatively small number of ancestral gene sequences [2]. Domains, which are related to each other by descent from a common ancestor are said to be homologous, can be grouped together to form a superfamily. Lots of computational methods have been developed to predict protein-protein interactions. Because proteins interact with one another through their specific domains, predicting domain-domain interactions on a global scale from the entire protein interaction data set make it possible to predict previously unknown protein-protein interactions from their 1.
(10) domains. Protein sequence databases such as Swiss-prot [3] is becoming increasingly large and unmanageable, primarily as a result of the growing number of genome sequencing projects. However, many of the newly added proteins are new members of existing protein families. Typically, between 40% and 65% of the proteins found by genomic sequencing show significant sequence similarity to proteins with known function [4; 5] and usually a large fraction of them show similarity with each other [5; 6]. Figure 1 shows the number of proteins discovered each year and the number of presently known nonredundant domains found in these proteins. Although the number of proteins discovered grows at increasingly higher rates, the number of domains found appears to be asymptotically reaching a limit. Experimentally determined structures of protein complexes are deposited in the Protein Data Bank (PDB) [7]. The PDB is growing rapidly, in part due to the recent structural genomics effort. The PDB currently holds approximately 30000 structures. Each entry contains on average 2.2 protein chains, and each chain contains on average 2.1 domains [8]. Domains are considered the basal unit of protein structure, function and evolution [9]. These units fold independently, often mediate a specific biological function, and combine modularly to form larger proteins. Several approaches to the definition of domain boundaries in proteins have been developed based on sequence and structure [10]. The Pfam [11] is the most commonly used sequence-based domain definition and classification system. Domain-domain interactions can be useful for validating, annotating, and even predicting protein-protein interactions. However, large-scale experimentally determined domain-domain interactions are not available [12]. In this thesis, we have developed an approach to computationally derive protein-protein interactions and domain-domain interactions from 3D protein complexes. Using evolutionarily conserved domains defined in a protein-domain database called Pfam [11], to identify interacting domains that are consistent with the observed protein-protein interactions. Because every protein can be characterized by 2.
(11) either a distinct domain or a combination of domains, understanding domain interactions is crucial to understanding the nature and extent of biomolecular interactions. Our study identified structural binding site and map it to sequence-based domain-domain interactions solely on the basis of the information of 3D protein-protein interactions. Because proteins interact with one another through their specific domains, identify structural domain-domain interactions on a global scale from the entire protein interaction data set make it possible to predict previously unknown protein-protein interactions from their domains. Thus, domain interactions extend the functional significance of proteins and present a global view of the protein-protein interaction network within a cell responsible for carrying out various biological and cellular functions.. 1.2 Related Works Computational methods have been developed to predict protein-protein interactions. Those approaches include the Rosetta stone/gene fusion method [13; 14], the phylogenetic profile method [15] and the method combining multiple sources of data [16]. Other computational methods to predict protein-protein interaction have been presented on the basis of different principles, including the interaction domain pair profile method [17; 18] and the support vector machine learning method [19]. Gomez et al. [20] developed probabilistic models for protein-protein interactions. Sprinzak and Margalit [21] analyzed over-represented sequence-signature pairs among protein-protein interactions. The yeast two-hybrid technique is a high throughput approach that has been used to screen the yeast genome for pairwise interactions by two different groups [22; 23]. The advantage of screening the entire genome (or at least a large part of it) for interactions is offset by a high rate of experimental error, and it is vital that the false positive rate is included in any analysis of the data. The potential benefits and drawbacks of such high throughput 3.
(12) techniques have generated intense interest: see Legrain et al. [24] and von-Mering et al. [25] for reviews of this area, and Sprinzak et al. [26] for estimates of the false positive rate [2]. Given a list of interactions obtained from such experiments, absence of a protein pair from the list does not necessarily mean that the two proteins do not interact. It could be that interaction of the pair in question was not tested in the experimental set-up. This false negative probability has to be accounted for when making statistical inference based on absence from the list of interactions. We notice that, large scale experimentally determined domain-domain interaction data are not available. In the past research, usually infer domain-domain interactions from protein-protein interactions (e.g. yeast-two-hybrid experiments). However, it is known that the yeast two-hybrid assay is not accurate in determining protein-protein interactions, and the interaction data certainly contain many false positive and false negative errors [27; 28; 29]. To infer domain-domain interactions from these large scale experimentally determined protein-protein interactions might not reflect the real domain-domain interactions. The other shortcoming of past approaches is that they did not explicitly know which domain pair is the interacting domains.. 1.2.1 Probabilistic Domain-domain Interaction Models. Ng et al. [12] collected data from three sources: (i) the experimentally derived protein interaction data from DIP [30]; (ii) the intermolecular relationship data from protein complexes; and (iii) the computationally predicted data from Rosetta Stone sequences. Then they inferred putative domain–domain interactions based on the collected data through the development of InterDom, a database of interacting domains [31]. However, the accuracy of the data inferred from domain–domain interaction is not apparent. The approach of InterDom is a standard probabilistic domain-domain interaction model. In the large number of 4.
(13) interacting protein data, domain pairs which with higher occurrence frequency will denote as high interacting potential domain pairs. This approach might bias to the common domains in protein composition. Deng et al. [32] proposed a probabilistic prediction model for inferring domain interactions from protein interaction data. The maximum-likelihood estimation technique is mainly used in their method. It is known that the yeast two-hybrid assay is not accurate in determining protein-protein interactions, and the available interaction data certainly contain many false positive and false negative errors. Taking into account these errors, they apply the maximum-likelihood approach to estimate the probability of domain-domain interactions. They apply the maximum-likelihood approach to estimate the probability of domain-domain interactions and recursively to derive domain-domain interaction probabilities from the combined experimental data. The Pfam database is used to extract domain information and the MIPS [33] database is used to test their model. Finally, they compare the gene expression profile correlation coefficients of their predictions with those of random protein pairs and MIPS database. Recently, predictions of protein interactions have been performed in the context of domain-domain interactions using experimentally identified interacting protein pairs. These approaches based on statistic theories might be weak on biological meanings.. 1.2.2 Interologs. Walhout et al. [34] introduced the concept of “Interolog”: orthologous pairs of interacting proteins in different organisms. Yu et al. [35] apply this concept into a concrete interaction prediction approach, the generalized interolog mapping method. Interolog map the transfer of interaction annotation from one organism to another using comparative genomics. Yu et al. think that it is now possible to examine the degree to which protein-protein and 5.
(14) protein-DNA interactions are transferred between different organisms as a function of the underlying sequence similarities of the interacting proteins. They comprehensively assessed the transferability of protein-protein and protein-DNA interactions by analyzing the relationships between sequence similarity and interaction conservation. Their approach based on interolog to explore the protein-protein interactions in another organism. We thought that the interolog method does not take the domain information into account. If it replenishes the domain information and biological meaning, it will be more reliable and robust.. 1.3 Thesis Overview In recent years, the PDB database has experienced rapid growth. To maximize the utility of the high resolution protein-protein interaction data stored in the PDB database, we developed a novel domain-based protein-protein interaction predict approach and build a database include structural domain-domain interactions and protein-protein interactions derived from structural domain pairs. In chapter 2, we have prepared structural interaction protein pairs from PDB database. We divided structural binding site from structural contacted proteins in PDB database and mapped it to domain-domain interactions. Then, we inferred protein-protein interactions from structural domain-domain interactions. After that, we developed a computational approach to measure the similarity between the structural protein (template) and the others which we inferred (candidates). Our approach not only takes sequence similarity into account but also the biological function similarity. Finally, we also compared the gene expression profile correlation coefficients of our predictions with those of random protein pairs and DIP database, and our predictions have a higher mean correlation coefficient. In chapter 3, we show the 101483 protein-protein interactions we inferred (Table 1) and the 1008 pairs of domain-domain interactions from PDB database (Table 2). In PDB 6.
(15) database we obtain 36465 protein-protein interactions of known 3D structure making of 1008 type of domain-domain interactions. Based on these domain-domain interactions, we inferred over one million protein-protein interactions. By the way, we applied our scoring function to reduce the false positives. In addition, we demonstrated the scoring weight of each scoring term to reduce false positive rate. Finally, we applied our approach on eight common organism models and inferred 101483 protein-protein interactions which not stored in DIP. Based on the gene-expression profiles and the ratio of true to false positives (TP/FP), we determined the threshold of our scoring function as 0.5. Experimental results show that the gene-expression profiles and the ratio of true to false positives (TP/FP) are highly correlated to values of our scoring function. Chapter 4 presented some conclusions and future works. Our major contribution is to develop a novel approach to infer protein-protein interactions from domain-domain interactions. We will add more features to enhance our scoring function and use the evolutionary approach to demonstrate the scoring weight of our scoring function. Furthermore, we will visualize our achievements as a web service.. 7.
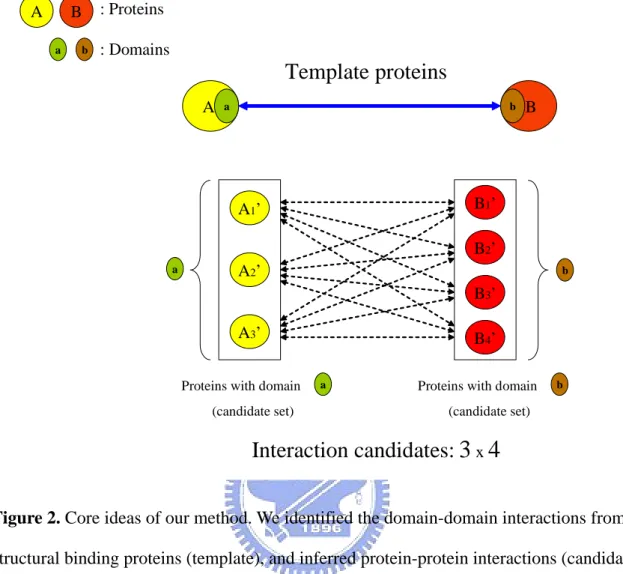
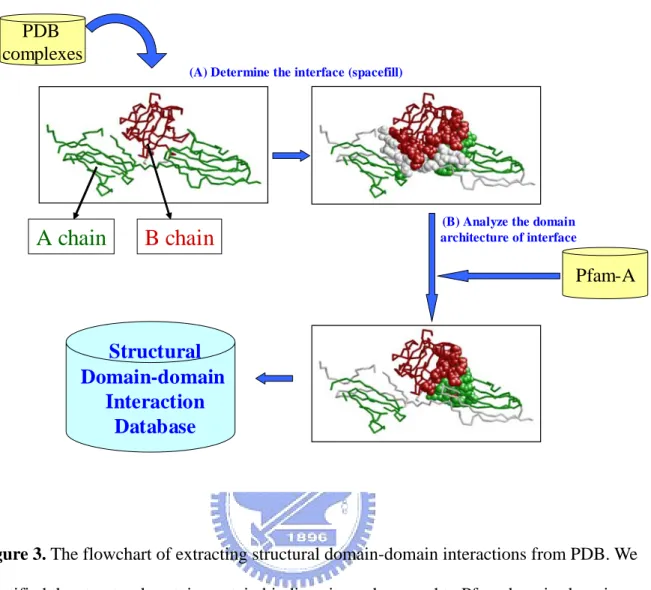
(16) Chapter 2 Materials and Methods The core idea of this thesis is illustrated in Figure 2. In this thesis, we analyzed the structural protein-protein binding sites from PDB database to identify the domain-domain interactions. Then we inferred protein-protein interactions from the structural domain-domain interactions we obtained. Our approach included two parts: Identify structural domain-domain interactions and Inferring protein-protein interactions from structural domain-domain interactions. Two types of input data were used: protein structures and domain definitions. Structures were obtained from the PDB database. Domain definitions for the PDB structures were obtained from the Pfam classification system. First, inter-atomic distances were calculated for all structures using a specified distance cutoff. We analyzed the domain architectures of protein complex binding sites from the PDB database (Figure 3A). We mapped the structural binding site into the Pfam domains to identify the binding domains (Figure 3B). We have developed an approach and a new scoring function to yield many protein-protein interaction candidates (over one million) (Figure 4). Based on the gene-expression profiles and the ratio of true to false positives (TP/FP), we adapt the thresholds of our new scoring to reduce false positive rate. Experimental results show that the gene-expression profiles and the ratio of true to false positives (TP/FP) are highly correlated to values of our scoring function.. 2.1 Preparing Dataset from PDB Database To understand how protein domains interact at the molecular level, we need to know which residues, and their constituent atoms, in each protein are interacting. This kind of data is available in the PDB database of protein structures [7] where multiple domains are present in a single structure. We used the data of PDB database published at 22nd April 2005. It holds 8.
(17) 29835 entries. We parsed the coordinate data of each Cβ atom in PDB format text file of each entry to identify the protein-protein interaction binging sites (Figure 3A). To identify the protein-protein binding site, we calculated the Cβ - Cβ distance (GLY Cα) of each residue belongs to different chain. We introduce the rule we used: the 5-8 rule. It must five or more residues contact within 8Å. The binding site information between each chain were computed and stored.. 2.2 Mapping Structural Binding Site to Domain-domain Interactions In order to identify the domain architectures of protein-protein binding sites, we mapped the structural protein-protein binding sites to the Pfam defined domains (Figure 3B). We followed the two steps below:. 2.2.1 Transform 4-Letter PDB and Chain Code to Swiss-prot Accession Number. We downloaded the “uniprot_sprot.dat.gz” (version 45) from: ftp://us.expasy.org/databases/swiss-prot/release/ The Universal Protein Resource (UniProt/Swiss-prot) [36] provides the scientific community with a single, centralized, authoritative resource for protein sequences and functional information. The database cross-references in Swiss-prot are used as pointers to information related to entries and found in data collections other than Swiss-Prot database. For example, if the X-ray crystallographic atomic coordinates of a sequence are stored in the PDB database there will be one database cross-reference pointing to each of the corresponding entries in PDB database. After uncompressed the uniprot_sprot.dat.gz, we got a huge text file. It recorded the relationship between Swiss-prot accession number and PDB chain code. We transformed each PDB chain code to Swiss-prot accession number.. 9.
(18) Unfortunately, not every entry in PDB has corresponding entry in Swiss-prot. If the PDB chain code could not find related Swiss-prot accession number, we employed BLAST [37] to identify the Swiss-prot accession number. We download: 1) Standalone BLAST 2.2.11 from: ftp://ftp.ncbi.nlm.nih.gov/blast/executables/LATEST/ 2) Swiss-prot fasta format BLAST database (version 45) from: ftp://us.expasy.org/databases/swiss-prot/release/ Use program: “formatdb” to create our own database for BLAST searching. We execute BLAST by program “blastall”. Blastall may be used to perform all five flavors of blast comparison. A typical use of blastall would be to perform a “blastp” search (protein vs. protein) of a query file called INPUT would be: blastall -p blastp -d DATABASE -i INPUT -o OUTPUT -M BLOSUM62 -G 8 -E 2 -F F The output will be placed into the result OUTPUT and the search is performed against the “DATABASE” database. Other blastall options showed above “-M BlOSUM62” which is default scoring matrix, “-G 8 –E 2” which means that open gap penalty is 8 and extend one is 2, and “-F F” is to tell blastall do not filter query sequence. In this thesis, DATABASE we use the swissprot.fasta and default setting of BLAST. We took sequence data of those PDB entries could not find corresponding entries in Swiss-prot as INPUT. BLAST will help us to identify Swiss-prot accession number of these PDB entries. We took the rank one Swiss-prot accession number of BLAST output as our query sequence.. 10.
(19) 2.2.2 Identify Domain Architectures of Structural Binding Site. We download the “swisspfam.gz” from: ftp://ftp.sanger.ac.uk/pub/databases/Pfam/ Pfam is a large collection of protein families and domains. Pfam is represented by two multiple sequence alignments and two profile-Hidden Markov Models (profile-HMMs). In swisspfam, it well defined the domain boundary on Swiss-prot protein sequences. It is great help to us to identify the binding domains. We mapped the Swiss-prot/PDB in residue level. The residue number will indicate which domain it is localized. Usually, the same gene product stored in PDB and Swiss-prot will identical in sequence data. But the residue number might shift or the N’ and C’ terminal residues in PDB might be lost. Therefore, the residue number record in Swiss-prot and PDB might not the same. We must modify the PDB residue numbers to match Swiss-prot residue numbers. In order to map the Swiss-prot/PDB in residue level, we download “pdb_chain_uniprot.lst” from: ftp://ftp.ebi.ac.uk/pub/databases/msd/sifts/text/ In pdb_chain_uniprot.lst, it contains a summary of the PDB to Swiss-prot residue level mapping. We conform to the data in pdb_chain_uniprot.lst to modify the PDB residue numbers to match Swiss-prot residue numbers. The number of residues in protein-protein binding site and located in Pfam defined domains must more than five. After the process above, we accurate known which residues provide the binding force between two protein chains and which domain they located.. 11.
(20) 2.3 Inferring Protein-protein Interactions from Domain-domain Interactions 2.3.1 Generate Protein-protein Interaction Candidates. Because of domain-domain interactions will be a good indicator to infer protein-protein interactions and domains are structural subunits of proteins that can be thought of as “building blocks” that are conserved during evolution. We can infer protein-protein interactions stride across different organisms via domain-domain interactions. For instance, we observed a domain-domain interaction in Saccharomyces cerevisiae; we can infer protein-protein interactions in other organisms (e.g. Homo sapiens) with similar domain-domain pair composition. We generated the protein-protein interaction candidates according to the domain composition of proteins; the domain is defined as Pfam domain (Figure 4). We employed the “swisspfam” to help us to identify the domain composition in proteins. We inferred over one million protein-protein interactions via domain-domain interactions which we obtained. Each structural domain pair will generate thousands of protein-protein interaction candidates. We applied our approach on eight common organism models, including Homo sapiens, Mus musculus,. Rattus. norvegicus,. Drosophila. melanogaster,. Caenorhabditis. elegans,. Saccharomyces cerevisiae, Helicobacter pylori and, Escherichia coli.. 2.3.2 Scoring Function. To generate the protein-protein interaction candidates without any criteria will contain lots of false positives in candidates. In our approach, we inferred protein-protein interactions according to domain composition in proteins. Because of lots of proteins might contain the same sequence-based domain with various biological functions. We developed a scoring function to measure the similarity between the proteins we inferred (candidates) and the 12.
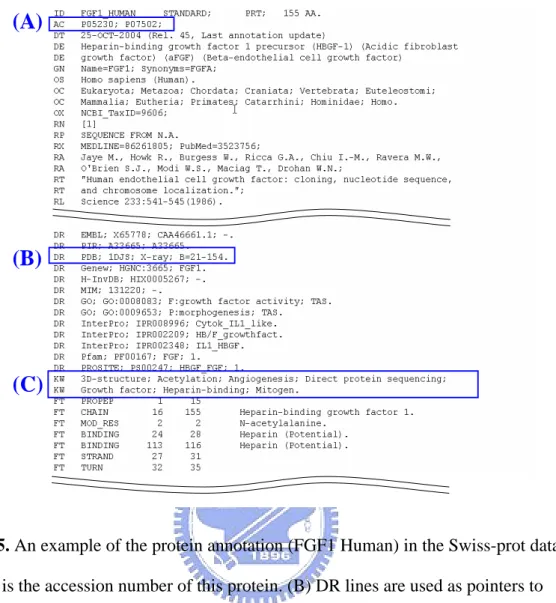
(21) original proteins we identified domain-domain interactions (templates). Our scoring function is based on biological annotation, sequence similarity and the degree of bind site conservation. Our scoring function is given as. Stotal = Wk × S k + We × Se + W p × S p + Wb × Sb where Wk , We , W p , and Wb are the weights for S k , Se , S p , and Sb .. (1). The S k is the. score to measure biological function similarity between proteins. Se and S p are the scores of measuring the sequence similarity between two proteins. Sb is the score to measure the degree of binding site conservation. We developed a novel approach to measure biological function similarity between proteins. Swiss-prot is a curated protein sequence database which strives to provide a high level of annotation. We notice the annotation in Swiss-prot will provide as a good indicator to identify the biological function similarity between proteins. We developed a scoring function to measure biological function similarity between proteins. It is similar to information retrieval. We download “uniprot_sprot.dat.gz” from: ftp://us.expasy.org/databases/swiss-prot/release/ The uniprot_sprot.dat is a high level of annotation such as the description of the function of a protein, its domains structure, post-translational modifications, variants, etc. We focus on the keywords annotation (Figure 5) of each protein. Table 3 shows the total keywords in Swiss-prot database. We consult the well-known information retrieval skill to develop our scoring function. The keywords annotated of each protein should have different importance. According to each keyword frequency, we transformed the frequency to score by TF/IDF (Term Frequency × Inverse Document Frequency) approach. Term Frequency of a word is the 13.
(22) number of its occurrence in a corpus. In our study, the TF value will be 1, because the keyword will not appear twice in a protein annotation. Inverse Document Frequency of a word is the number of document where the word occurs at least once. The IDF of each keyword is given as. IDFi = Vi = log 2s / fi. (2). where IDFi as score of keyword i (i=1 to n, n as total types of keywords in Swiss-prot), Vi as vector of keyword i, s as total number of protein stored in Swiss-prot (in this thesis s=163235), fi as the frequency of keyword i in Swiss-prot database (we remove the keyword fi < 10 and fi > 10000). After we transform the frequency of each keyword to score, we notice that some keywords might more important than others. We download “spkw2go” from: http://www.geneontology.org/external2go/spkw2go The spkw2go means that Swiss-prot keywords mapping to Gene Ontology (GO)[38]. Some keywords will repeat in this data. We consider that these repeat keywords might have more significant importance (Table 2). In our scoring function, it will calculate these keywords twice or treble. In other hand, we remove the keywords IDF of which keywords with huge frequency. Because of the keyword appear in each protein will not have significance to distinguish each other. Each keyword have its own score, a protein might contain more than one keywords. How to measure the similarity between proteins via keywords annotations? We apply the “Vector Space Model” to do this. The vector space model is given as n. ∑ (V x × V y) i. S k ( Px, Py ) =. i. i =1. ⎛ n ⎞ ⎛ n ⎞ ⎜ ∑ Vix 2 ⎟ × ⎜ ∑ Viy 2 ⎟ ⎝ i=1 ⎠ ⎝ i=1 ⎠. (3). where Px, Py are protein x and protein y, n as total unique keyword in Swiss-prot database (n dimensional vectors, in this thesis n=949), Vix, Viy as the vector strength of protein x, y in ith 14.
(23) dimension. In this scoring function, we extracted the proteins corresponding to the template protein in keywords annotation. After the S k were calculated, we normalize the score to Z-score and scale to 0~1. The normalized Z-score is used for measuring the keywords score separation between template and candidates. We employed PSI-BLAST [39] to measure the sequence similarity between proteins. In session 2.2.1 we had download the standalone BLAST and fasta format sequence data. The command to perform PSI-BLAST: blastpgp –d DATABASE –i INPUT –o OUTPUT F F –G 8 –E 2 –j 3 –t F –h 5 Program “blastpgp” take a protein query and perform PSI-BLAST search to create a position specific matrix using a protein database. Some of arguments used in PSI-BLAST are the same as BLAST. There are different options between BLAST and PSI-BLAST, such as “-j 3” which is maximum number of rounds, “-t F” which means that program do not use composition based statistics, and “-h 5” that is the e-value threshold for including sequences in the score matrix model. The e-value threshold default is 0.001. However in order to obtain correct result and best performance, we change the value from 0.001 to 5 for PSI-BLAST. The top part of output of PSI-BLAST for each round distinguishes the sequences into: sequence found previously and used in the score model, and sequences not used in the score model. The output currently includes lots of diagnostics requested by users in NCBI. To skip quickly from the output of one round to the next, search for the string “producing”, that is part of the header for each round and likely does not appear elsewhere in output. PSI-BLAST “converges” and stops if all sequences found at round i+1 below the e-value threshold were already in the model at the beginning of the round. We took the sequence of the template protein as PSI-BLAST input and change the e-value threshold to 5; the maximum number of rounds as 3. The Se , S p and Sb are base on. 15.
(24) result of PSI-BLAST result. The Se is given as S e = − log E. (4). where E means the e-value of the candidate protein. We transform e-value of PSI-BLAST output to our sequence similarity score. Then, we normalize the score to Z-score and scale to 0~1. The S p is given as S p = pos + iden. (5). where pos is the positive percentage of PSI-BLAST sequence alignment result; iden is the identical percentage of PSI-BLAST sequence alignment result. Then, we normalize the score to Z-score and scale to 0~1. The Sb is given as Sb =. bcandadate btemplate. (6). where bcandidate means that the binding site conservation percentage of PSI-BLAST sequence alignment result (candidate); btemplate is the binding site score of query protein (template). The bcandidate is given as n. bcandidates = ∑ Si. (7). i =0. where n as the length of sequence alignment of binding site, Si means that the substitution score of sequence alignment result at position i. The btemplate is completely imitating the same equation. We use the “BLOSUM62” substitution matrix to calculate the binding site score for 16.
(25) each PSI-BLAST sequence alignment result. Then, we transform the score to percentage. Then, we normalize the score to Z-score and scale to 0~1. Our purpose is to find out proteins which were composed of specific domain and similar to template protein in biological functions. We sum the four scoring terms of each protein candidate. The total score will show that how similar between template and candidates. In general, the template protein will be the highest score in our scoring function. We define a threshold to determine how the candidate similar to template protein. Our threshold is defined as the percentage between candidates and template protein.. 2.4 Verification 2.4.1 TP/FP Ratio. In order to prove our strategy is reasonable, we prepare two standard datasets, one is the positive dataset which contains 14779 Saccharomyces cerevisiae interacting protein pairs in DIP [30], the other is the negative dataset which contains 2599785 non-interacting protein pairs in Saccharomyces cerevisiae [40]. The TP/FP ratio is defined that our predicting protein-pairs overlapping with the positive set divides overlapping with the negative set [40]. We calculated the TP/FP ratio in different thresholds and different weights of each scoring term to observe the relation between TP/FP ratio and thresholds. 2.4.2 Genes Expression Profiles. Recently, it was noted that genes with similar expression profiles are likely to encode interacting proteins [41; 42]. We studied the distribution of correlation coefficients for protein pairs with predicted interaction probability greater than a certain threshold. We used the gene expression data from Hughes et al. [43]. At the same time, our predicting protein-interaction pairs, whose scores greater than 0.5 have higher probability to co-express than the ones of non-interacting set (defined in Jansen et al. , Science 2003 [40]) or DIP set in S. cerevisiae. 17.
(26) Chapter 3 Results and Discussions 3.1 Inferred Protein-protein Interactions from Domain-domain Interactions Currently, in our structural domain-domain interaction database includes information on 36465 protein chains of known 3D structure making a total of 1008 type of domain-domain interactions. Of these, we grouped these interactions into 1008 types according to the Pfam domain mediating them (Table 2). We used the domain-domain interactions to predict protein-protein interactions and assess the prediction accuracies at the protein level. After calculated the score of each protein and template, we applied these domain-domain interactions to infer protein-protein interactions on eight common organism models, including Homo sapiens, Mus musculus, Rattus norvegicus, Drosophila melanogaster, Caenorhabditis elegans, Saccharomyces cerevisiae, Helicobacter pylori and, Escherichia coli. In these. organisms, we inferred 53669 protein-protein interactions in Homo sapiens; 39689 protein-protein interactions in Mus musculus; 4461 protein-protein interactions in Rattus norvegicus; 857 protein-protein interactions in Drosophila melanogaster; 941 protein-protein. interactions in Caenorhabditis elegans; 1130 protein-protein interactions in Saccharomyces cerevisiae; 603 protein-protein interactions in Escherichia coli; 133 protein-protein. interactions in Helicobacter pylori. In total, we inferred 101483 protein-protein interactions (Table 1). It is a great quantity more than the data stored in DIP database.. 3.2 Determine the Threshold In this thesis, our scoring function contains four scoring terms and each has its own weight. We tested different weight combination of scoring terms (Figure 6). We considered that each scoring term of our scoring function has certain effect. We thought that the function similarity, sequence similarity and binding site conservation are equally important. In our 18.
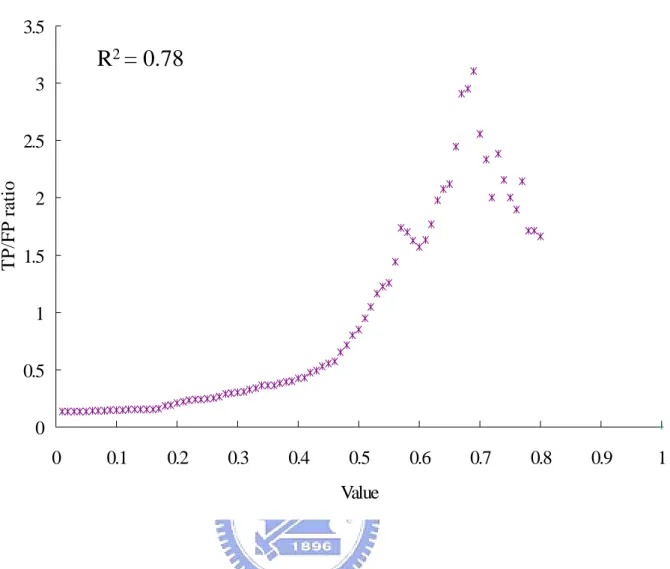
(27) opinion, We and W p are both extended from PSI-BLAST to measure the sequence similarity. In order to take each scoring term into account, we determine the Wk as 1, We as 0.5, W p as 0.5 and Wb as 1. The benchmark we used to verify our predictions is TP/FP ratio. The TP/FP ratio is defined that our predicting protein-pairs overlapping with the positive set divides overlapping with the negative set. The positive dataset which contains 14779 Saccharomyces cerevisiae interacting protein pairs in DIP [30], the other is the negative dataset which contains 2599785 non-interacting protein pairs in Saccharomyces cerevisiae [40]. Experimental results show that the TP/FP ratio is highly correlated to values of our scoring function (Figure 7). Because of Jansen et al. indicated that the TP/FP ratio greater than 1 the predictions will be more reliable [40]. The Figure 7 shows that the scores of our scoring function are highly correlated to the TP/FP ratio. We defined a threshold at TP/FP ratio as 1. When TP/FP ratio as 1 the threshold is 0.5. The threshold as 0.5 means that the score of candidate protein divides the score of template must greater than 0.5. Figure 8 shows the number of inferred protein-protein interactions (candidates) at different TP/FP ratio. In Figure 7 and Figure 8, we found that with the severer threshold the numbers of candidates were going down and the TP/FP ratios were on the rising. The TP/FP ratio will reflect the quality of our predictions. The TP/FP ratio is regarded as the accuracy of our predictions. At higher accuracy, we will get the high quality predictions, but the number of inferred protein-protein interactions will be decreased. We determine the threshold at 0.5. It is a compromise between quality and quantity. In Figure 7 and Figure 8, the TP/FP ratio is the most important information. Because of the TP/FP ratio is defined as our predicting protein-pairs overlapping with the positive set divides overlapping with the negative set. When the number of our predicting protein-pairs overlapping with the positive set is too low,. 19.
(28) the TP/FP ratio might lose its statistic meaning. And it brought out the perturbations in Figure 7 and Figure 8 when positive-overlap was insufficient.. 3.3 Correlation Coefficients of Gene Expression Genes with similar expression profiles are likely to encode interacting proteins. We study the distribution of correlation coefficients for protein pairs with predicted interaction probability greater than a certain threshold. Figure 9 shows that the gene-expression profiles are highly correlated to values of our threshold. We compared the gene expression profile correlation coefficients of our predictions with those of random protein pairs and DIP database, and our predictions have a higher mean correlation coefficient.. 3.4 Examples We sought an example from the literature to illustrate the operation and accuracy of the method. Some of the most intensively studied interactions are those between fibroblast growth factors (FGFs) and receptors. FGF signaling pathways are intricate and are intertwined with insulin-like growth factor, transforming growth factor-beta, bone morphogenetic protein, and vertebrate homologs of Drosophila wingless activated pathways. FGFs are major regulators of embryonic development: They influence the formation of the primary body axis, neural axis, limbs, and other structures. The activities of FGFs depend on their coordination of fundamental cellular functions, such as survival, replication, differentiation, adhesion, and motility, through effects on gene expression and the cytoskeleton. FGFs play key roles in morphogenesis, development, angiogenesis, and wound healing. There are more than 20 human FGFs that bind to one or more of 7 FGF receptors (FGFR1c, -1b, -2c, -2b, -3c, -3b, and -4; c and b denote isoforms IIIc & IIIb formed by alternative splicing [44]). For example, PDB ID 1DJS is a protein complex (FGFR2 complex with FGF1), the chain A of 1DJS 20.
(29) (Swiss-Prot accession number: P21802) and chain B (Swiss-Prot accession number: P05230) are interacting with each other. In DIP database, chain A is 3788N and chain B is 3787N. We analyzed the domain architecture of the interface between them. We discovered that the interaction between these two chains can be reduced to immunoglobulin domain (Pfam ID: PF00047) interact with fibroblast growth factor domain (Pfam ID: PF00167). First, we analyzed the other proteins stored in DIP which interacted with 3788N. We found the other proteins interact with 3788N all constituted with fibroblast growth factor domain. We tried to seek more other proteins which were composed of fibroblast growth factor domain. We found 22 human proteins were composed of fibroblast growth factor domain and some of them have crystal structure (1II4, 1NUN) to confirm they indeed interact with FGF2 (P21802).. 3.5 Web Service We developed a web-base database named “DAPID” to present our result. DAPID has been setup to a web service as shown in Figure 10. Users can input a Swiss-prot accession number as a query. The DAPID will return the interacting partners of the query protein. And we will show the detail information about this pair of proteins. The website of DAPID is http://gemdock.life.nctu.edu.tw/dapid/.. 21.
(30) Chapter 4 Conclusions and Future Works 4.1 Summary We developed a novel approach to infer protein-protein interactions from domain-domain interactions. Domain-domain interaction information can be useful for predicting protein interactions. Proteins with the same domain compositions and biological function might have the same type of domain-domain interactions. Without other criterion, domain-based protein-protein interaction prediction will obtain lots of false positives. We developed a scoring function based on biological function similarity and sequence similarity to reduce the false positive rate. We applied our approach on eight common organism models, including Homo sapiens, Mus musculus, Rattus norvegicus, Drosophila melanogaster, Caenorhabditis elegans, Saccharomyces cerevisiae, Helicobacter pylori and, Escherichia coli.. In these organisms, we inferred 53669 protein-protein interactions in Homo sapiens; 39689 protein-protein interactions in Mus musculus; 4461 protein-protein interactions in Rattus norvegicus; 857 protein-protein interactions in Drosophila melanogaster; 941 protein-protein. interactions in Caenorhabditis elegans; 1130 protein-protein interactions in Saccharomyces cerevisiae; 603 protein-protein interactions in Escherichia coli; 133 protein-protein. interactions in Helicobacter pylori. In total, we inferred 101483 protein-protein interactions. We employed TP/FP ratio to help us determine the threshold cutoff of our scoring function. And then we compared the gene expression profile correlation coefficients of our predictions with those of random protein pairs and DIP database, and our predictions have a higher mean correlation coefficient. Finally, we build a domain-annotated protein-protein interaction database named “DAPID”, including structural domain pairs and inferred protein-protein interactions.. 22.
(31) 4.2 Major Contributions and Future Works Here, we have developed an approach to infer protein-protein interactions from domain-domain interactions. The most important contribution of this thesis is the domain-domain interactions we obtained are real interacting domains. It is quiet different to probabilistic domain-domain interaction models. Our domain-domain interactions are more significant and reliable than probabilistic domain-domain interaction models. According to these domain-domain interactions, we predicted 101483 protein pairs on eight common organism models. It is a great quantity more than the data stored in DIP or MIPS database. Nowadays, we mapped the protein-protein binding site to Pfam domains to identify the domain-domain interactions. However, we considered that the Pfam defined domains are based on HMM-profile and multiple sequence alignment, it might lose structural information. Our method depends on the domain classification database to infer proteins which were composed of specific domains. The quality of domain classification database will great influence our predictions. In the future, we hope to infer proteins which were composed of specific domains including structural information. We will employ other domain classification systems which include structural information to improve our method. Our scoring function depends on high quality, curated annotations and sequence similarity. We employed the annotation information in Swiss-prot database and took the “keywords” to measure the protein function similarity. We only took the “keywords” information to construct our scoring function. The keywords might be too rough to classify protein functions. We will combine other annotation in Swiss-prot database (e.g. descriptions, functions and EC numbers) to improve our scoring function. Sometimes, protein-protein interactions might unnecessary belongs to the same organism (e.g. enzyme-inhibitor; virus-host proteins). Our method will ignore these kinds of 23.
(32) protein-protein interactions. We will study the domains which will interact across organisms (e.g. inhibitors and virus proteins). We will modify our approach to recover these kinds of protein-protein interactions. Another difficulty is that it is often impossible to distinguish between direct physical interactions and functional associations that may not involve direct atomic contacts between macromolecules. According to our approach, we focused on identify structural domain-domain interactions from crystal structures. These kinds of protein-protein interactions are all most the direct physical interactions. Therefore, our method might not be able to predict the transient protein-protein interactions. In the future works, we will identify other more domain-domain interactions from other data source (e.g. DIP and MIPS) to predict transient protein-protein interactions.. 24.
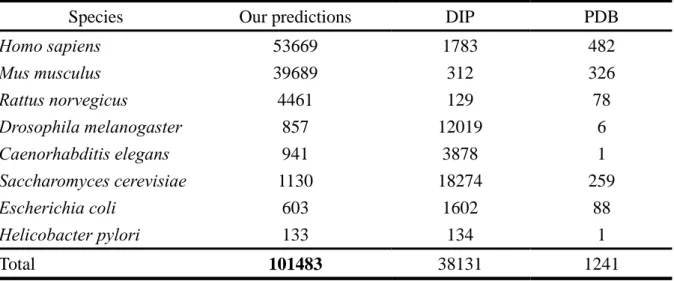
(33) Table 1. Protein-protein interactions stored in different database. In total, we inferred 101483. protein-protein interactions on eight common organism models. Species. Our predictions. DIP. PDB. Homo sapiens Mus musculus Rattus norvegicus Drosophila melanogaster Caenorhabditis elegans Saccharomyces cerevisiae Escherichia coli Helicobacter pylori. 53669 39689 4461 857 941 1130 603 133. 1783 312 129 12019 3878 18274 1602 134. 482 326 78 6 1 259 88 1. Total. 101483. 38131. 1241. 25.
(34) Table 2. 1008 Domain-domain interactions we inferred from structural protein-protein. interactions. PF00001-PF00001; PF00001-PF02978; PF00004-PF00004; PF00004-PF00705; PF00004-PF02617; PF00004-PF07499; PF00005-PF00005; PF00005-PF01032; PF00006-PF00006; PF00006-PF00231; PF00006-PF00306; PF00006-PF04568; PF00007-PF00007; PF00007-PF00236; PF00008-PF00008; PF00008-PF00089; PF00009-PF00009; PF00009-PF00889; PF00009-PF03143; PF00009-PF03764; PF00010-PF01056; PF00011-PF00011; PF00012-PF00012; PF00012-PF01025; PF00012-PF02179; PF00013-PF00013; PF00014-PF00014; PF00014-PF00051; PF00014-PF00089; PF00014-PF00431; PF00015-PF00015; PF00016-PF00016; PF00016-PF00101; PF00017-PF00017; PF00017-PF00018; PF00018-PF00018; PF00018-PF00469; PF00018-PF03114; PF00018-PF05038; PF00019-PF00019; PF00020-PF00020; PF00020-PF00229; PF00022-PF00022; PF00022-PF00063; PF00022-PF00235; PF00022-PF00626; PF00022-PF03372; PF00022-PF04045; PF00022-PF04062; PF00022-PF04699; PF00022-PF05856; PF00023-PF00023; PF00023-PF00069; PF00023-PF00554; PF00023-PF01833; PF00024-PF00024; PF00025-PF00025; PF00025-PF01369; PF00025-PF01465; PF00025-PF05351; PF00026-PF00026; PF00026-PF06394; PF00026-PF07966; PF00027-PF00027; PF00028-PF00028; PF00028-PF00514; PF00030-PF00030; PF00032-PF00355; PF00032-PF01333; PF00032-PF02167; PF00032-PF02529; PF00032-PF02939; PF00033-PF00033; PF00033-PF00355; PF00033-PF02921; PF00034-PF00034; PF00034-PF00124; PF00034-PF00141; PF00034-PF02167; PF00035-PF00035; PF00036-PF00036; PF00036-PF00063; PF00036-PF00069; PF00036-PF00612; PF00036-PF00992; PF00036-PF02063; PF00036-PF07679; PF00037-PF02427; PF00038-PF00038; PF00040-PF00040; PF00041-PF00041; PF00041-PF00103; PF00041-PF00489; PF00041-PF00758; PF00041-PF00812; PF00041-PF03039; PF00041-PF07686; PF00042-PF00042; PF00043-PF00043; PF00044-PF00044; PF00045-PF00965; PF00047-PF00047; PF00047-PF00516; PF00047-PF07654; PF00048-PF00048; PF00050-PF00050; PF00050-PF00082; PF00050-PF00089; PF00051-PF00051; PF00051-PF00079; PF00051-PF00594; PF00051-PF00713; PF00051-PF02821; PF00051-PF03974; PF00051-PF07648; PF00056-PF02866; PF00057-PF00073; PF00059-PF00059; PF00059-PF00089; PF00059-PF00092; PF00059-PF00129; PF00059-PF01826; PF00061-PF00061; PF00061-PF00576; PF00062-PF00062; PF00062-PF00969; PF00062-PF00993; PF00062-PF02709; PF00062-PF07654; PF00062-PF07686; PF00063-PF00063; PF00063-PF02736; PF00064-PF00064; PF00064-PF07654; PF00064-PF07686; PF00067-PF00067; PF00067-PF00258; PF00068-PF00068; PF00069-PF00069; PF00069-PF00134; PF00069-PF00254; PF00069-PF00688; PF00069-PF01111; PF00069-PF01214; PF00069-PF02827; PF00069-PF02984; PF00069-PF03261; PF00069-PF05350; PF00069-PF05706; PF00070-PF00070; PF00070-PF00085; PF00071-PF00071; PF00071-PF00102; PF00071-PF00169; PF00071-PF00415; PF00071-PF00454; PF00071-PF00595; PF00071-PF00621; PF00071-PF00786; PF00071-PF00996; PF00071-PF01833; PF00071-PF02115; PF00071-PF02185; PF00071-PF02196; PF00071-PF03545; PF00071-PF06456; PF00071-PF07487; PF00072-PF00072; PF00072-PF00158; PF00072-PF01627; PF00072-PF04344; PF00072-PF07194; PF00073-PF00073; PF00073-PF00084; PF00073-PF02226; PF00073-PF07654; PF00073-PF07686; PF00074-PF00074; PF00074-PF07686; PF00075-PF00075; PF00076-PF00076; PF00077-PF00077; PF00077-PF00078; PF00077-PF00540; PF00077-PF06815; PF00078-PF00078; PF00078-PF06815; PF00079-PF00079; PF00079-PF00089; PF00079-PF01033; PF00080-PF00080; PF00081-PF00081; PF00082-PF00082; PF00082-PF00280; PF00082-PF00720; PF00082-PF01483; PF00082-PF02428; PF00082-PF05922; PF00084-PF00084; PF00085-PF00085; PF00085-PF00476; PF00085-PF03372; PF00085-PF07686; PF00086-PF00112; PF00087-PF00087; PF00087-PF00135; PF00087-PF02931; PF00088-PF00088; PF00089-PF00089; PF00089-PF00228;. 26.
(35) PF00089-PF00280; PF00089-PF00299; PF00089-PF01403; PF00089-PF01826; PF00089-PF02177; PF00089-PF02821; PF00089-PF02822; PF00089-PF03974; PF00089-PF05375; PF00089-PF07648; PF00092-PF00092; PF00092-PF03921; PF00092-PF07654; PF00094-PF07686; PF00101-PF00101; PF00101-PF02788; PF00102-PF00102; PF00104-PF00104; PF00105-PF00105; PF00106-PF00106; PF00107-PF00107; PF00108-PF00108; PF00109-PF00109; PF00109-PF02801; PF00111-PF00111; PF00111-PF00175; PF00112-PF00112; PF00113-PF00113; PF00114-PF00114; PF00115-PF00116; PF00115-PF00510; PF00115-PF02046; PF00115-PF05392; PF00115-PF06481; PF00115-PF07835; PF00116-PF00116; PF00116-PF00510; PF00116-PF02297; PF00116-PF02936; PF00116-PF05392; PF00116-PF07686; PF00116-PF07835; PF00117-PF00117; PF00117-PF00425; PF00117-PF00977; PF00118-PF00118; PF00118-PF00166; PF00119-PF00137; PF00121-PF00121; PF00122-PF00122; PF00124-PF00124; PF00124-PF01405; PF00124-PF02276; PF00124-PF02419; PF00125-PF00125; PF00127-PF00127; PF00127-PF02975; PF00127-PF06433; PF00128-PF00128; PF00128-PF00138; PF00128-PF00197; PF00128-PF07686; PF00129-PF00129; PF00129-PF00798; PF00129-PF00906; PF00129-PF01454; PF00129-PF04253; PF00129-PF07654; PF00129-PF07686; PF00134-PF02234; PF00135-PF00135; PF00136-PF00969; PF00136-PF00993; PF00136-PF03104; PF00137-PF00137; PF00138-PF00138; PF00138-PF00139; PF00139-PF00139; PF00141-PF00141; PF00142-PF00142; PF00142-PF00148; PF00143-PF00143; PF00144-PF00144; PF00144-PF07467; PF00147-PF00147; PF00149-PF00149; PF00150-PF00150; PF00151-PF00151; PF00152-PF00152; PF00155-PF00155; PF00156-PF00156; PF00157-PF00157; PF00158-PF00158; PF00160-PF00160; PF00160-PF00540; PF00161-PF00161; PF00161-PF00652; PF00162-PF00162; PF00163-PF03719; PF00164-PF00575; PF00166-PF00166; PF00167-PF00167; PF00167-PF07679; PF00169-PF00169; PF00169-PF07714; PF00170-PF00170; PF00170-PF01833; PF00171-PF00171; PF00173-PF00173; PF00175-PF00175; PF00177-PF00380; PF00178-PF00178; PF00179-PF00179; PF00179-PF00632; PF00179-PF07834; PF00180-PF00180; PF00183-PF00183; PF00183-PF03234; PF00184-PF00184; PF00185-PF00185; PF00185-PF02729; PF00185-PF02748; PF00186-PF00186; PF00186-PF00303; PF00187-PF00187; PF00190-PF00190; PF00191-PF00191; PF00194-PF00194; PF00196-PF00196; PF00197-PF00197; PF00198-PF00198; PF00200-PF00200; PF00202-PF00202; PF00203-PF00416; PF00204-PF00204; PF00205-PF00205; PF00208-PF00208; PF00210-PF00210; PF00211-PF00211; PF00211-PF00503; PF00215-PF00215; PF00216-PF00216; PF00217-PF00217; PF00218-PF00218; PF00221-PF00221; PF00223-PF00223; PF00223-PF01241; PF00223-PF02427; PF00223-PF02507; PF00223-PF02531; PF00223-PF02605; PF00223-PF07465; PF00224-PF00224; PF00225-PF00225; PF00227-PF00227; PF00227-PF02251; PF00227-PF02252; PF00227-PF07724; PF00229-PF00229; PF00229-PF07654; PF00231-PF00401; PF00231-PF02823; PF00231-PF04627; PF00232-PF00232; PF00233-PF00233; PF00234-PF00234; PF00235-PF00235; PF00236-PF00236; PF00238-PF00297; PF00238-PF01246; PF00239-PF00239; PF00240-PF00240; PF00240-PF02809; PF00240-PF02845; PF00241-PF00241; PF00243-PF00243; PF00244-PF00244; PF00244-PF00583; PF00245-PF00245; PF00246-PF02244; PF00248-PF00248; PF00248-PF02214; PF00251-PF00251; PF00253-PF00318; PF00253-PF00338; PF00253-PF00417; PF00254-PF00254; PF00258-PF00258; PF00261-PF00261; PF00264-PF00264; PF00266-PF00266; PF00267-PF00267; PF00268-PF00268; PF00270-PF00270; PF00273-PF00273; PF00273-PF01468; PF00274-PF00274; PF00275-PF00275; PF00276-PF00831; PF00276-PF00832; PF00278-PF00278; PF00280-PF00280; PF00282-PF00282; PF00285-PF00285; PF00288-PF00288; PF00290-PF00290; PF00290-PF00291; PF00291-PF00291; PF00292-PF00292; PF00293-PF00293; PF00294-PF00294; PF00295-PF00295; PF00296-PF00296; PF00300-PF00300; PF00301-PF00301; PF00302-PF00302; PF00302-PF02898; PF00303-PF00303; PF00306-PF00306; PF00306-PF04568; PF00307-PF00307; PF00310-PF00310; PF00311-PF00311; PF00312-PF01250; PF00313-PF00313; PF00314-PF00314; PF00316-PF00316; PF00317-PF00462;. 27.
數據
+7
相關文件
Conserved complexes are connected sub- graphs within the bacteria-yeast alignment graph, whose nodes represent orthologous protein pairs and edges represent conserved
Based on different characteristics of known protein-protein interaction sites, several methods have been proposed for predicting interface residues using a combination of
蛋白質表面區域相似度之實驗資料來源取自 PTP 家族中,PDB ID 分別為 1CWS、1CWT、1QB0、1VHR 及 1M7R,我們將此五個蛋白質中磷酸根的座標 值去除,然後再以半徑值約
Different from protein domains, molecular interface motifs emphasize on binding interfaces, the cores to perform protein functions1. Furthermore, our results showed
Palade’s early exp had found that in mammalian, vesicle mediated transport of a protein molecule from ER to membrane about 30-60 min... Techniques for studying the secretory
在典型 DSPs 中,和 MAPK 受質間互相作用的部分是由 rhodanese domain 來 作用。在 rhodanese domain 中的 KIM 更是互相作用中的重要區域[55]。然而互相 作用不僅需要 rhodanese
LiuB 則含有 methylene blue ( 亞甲 藍),可和細胞核蛋白、嗜鹼性白 血球與淋巴細胞胞漿(嗜鹼性物質)
However, in the Protein Data Bank (PDB), there are problems about certain proteins containing Cα-only atomic coordinates and disordered backbone conformation.. For
