國立交通大學
土木工程學系
碩士論文
反復扭剪夯實試驗之扭剪角度對
砂土密度及應力之影響
Change of Density and Stress in Sand Due to
Cyclic Torsional Shear Compaction
研 究 生 : 劉 政
指導教授 : 方永壽 博士
ii
反復扭剪夯實試驗之扭剪角度對砂土密度及
應力之影響
Change of Density and Stress in Sand Due to Cyclic Torsional Shear
Compaction
研 究 生: 劉 政
Student:Cheng Liu
指導教授:方永壽 博士
Advisor:Dr. Yung-Show Fang
國 立 交 通 大 學 土 木 工 程 學 系
碩士論文
A Thesis
Submitted to the Department of Civil Engineering
College of Engineering
National Chiao Tung University
in Partial Fulfillment of the Requirements
for the Degree of
Master of Engineering
in Civil Engineering
September, 2012
Hsinchu, Taiwan, Republic of China
中華民國一零一年九月
反復扭剪夯實試驗之扭剪角度對
砂土密度及應力之影響
研究生 : 劉 政 指導教授 : 方永壽 博士
國立交通大學土木工程學系碩士班
摘要
本論文以實驗方法探討反復扭轉剪力夯實造成砂質填土之地表沉陷量,土體 內相對密度, 垂直與水平應力及 CPT 試驗錐尖阻抗的改變。本研究使用自行設計 建造之反復扭轉剪力夯實儀,施加靜態垂直應力及反復剪應力在土層表面。本研 究以氣乾之渥太華砂為填土,填入 4 層高 150 mm 之疏鬆砂土。填土初始相對密 度為 35.5 %,試體採用直徑為 300 mm 的鋼質圓盤施加垂直載重 9.2 kPa,然後施 加反復剪應力,扭剪轉角分別為+ 1°、+3°、+5°、+7° 及 +10°,反復扭剪作用為 20 次。本研究採用雷射測距儀量測土體表面沉陷量,埋設密度控制盒埋置於試體內 部以量測土壤各點之相對密度,置於土壓力計試體內部以量測垂直及水平應力變 化,以圓錐貫入儀測量土體各深度之錐尖阻抗值。根據實驗結果,本研究可獲得 以下幾項結論: 1. 加載靜態垂直荷重於四層 150 mm 厚的試體表面,造成土體表面 15 至 22.3 mm 的沉陷量;平均表面沉陷量為 19 mm,沉陷量約為試體厚度 600 mm 的 3.2%。很明顯地,靜態垂直載重是夯實鬆砂有效的方法 2. 靜態垂直加載,砂土的相對密度從 35.5%增加大約至 62.0%,比緊砂要求的 標準(Dr =70%-85%)略低。 3. 與未夯實的鬆砂內的應力相比,靜態載重對於砂土中的垂直土壓力和側向土 壓力的影響不顯著iv 4. 在垂直載重的作用後,上層之錐尖阻抗 qc 有明顯的增加。受壓後正常化錐尖 阻抗 qc / qc,loose由 1.0 增大至 4.6。 5. 在四層且每層為 150 mm 厚之土層的表面,經過以扭轉角度為±10° 扭轉 20 次後,平均表面沉陷量為 38.2 mm;由於反覆扭剪夯實造成額外的表面沉陷 量約為 19.2 mm。很明顯地,反覆扭轉剪力是有效的夯實方法 6. 若靜態載重為 9.2 kPa,且試體厚度為 150 mm,以扭轉角度為±5° 扭剪 20 次 後,土壤的相對密度可達 72%至 84%。達成之土壤相對密度隨扭剪角度之加 大而增加 7. 經過反覆扭剪夯實後,土層中的垂直土壓力沒有受到影響;然而,經過反覆 扭剪夯實後,土層中側向土壓力增加從 27%至 88%。 8. 在經過反覆扭剪夯實後,正常化的錐尖阻抗 qc / qc,loose 從 4.6 增加至 9.0。實 驗結果說明了反覆扭剪夯實明顯的增加土層中的錐尖阻抗。 關鍵字:土壤夯實;反復扭轉剪力;相對密度;砂;沉陷量;土壓力;錐尖阻抗
Change of Density and Stress in Sand Due to
Cyclic Torsional Shear Compaction
Student: Cheng Liu Advisor: Dr. Yung-Show Fang Department of Civil Engineering
National Chiao Tung University
Abstract
This paper presents experimental data on the surface settlement change of relative density, vertical and horizontal stresses, and cone resistance in a cohesionless soil mass due to static vertical load and cyclic torsional shearing compaction. A new cyclic torsional shearing compactor was with a 300 mm-diameter circular shearing disc designed and constructed at National Chiao Tung University. Air-dry Ottawa sand was used as fill material. The initial relative density of the fill was 35.5 %. The static vertical load and cyclic torsional shearing were applied on the surface of the four 150 mm-thick lifts. Then cyclic shearing was applied with rotation angles of +1°, +3°, +5°,
+
7° and +10° for 20 cycles. Surface settlement of the fill was measured with a laser distance meter. Soil density cups were buried in the cohesionless specimen to monitor the relative density of soil. Soil pressure transducers were buried in the compacted fill to measure the change of the stress. A cone penetrometer used to measure cone resistance due to compaction. Based on the test results, the following conclusions were drawn.
1. With the vertical loading q = 9.2 kPa on the surface of the four 150 mm-thick soil lift, the induced surface settlements varied from 15.0 to 22.3 mm. The average surface settlement was 19.0 mm, which was about 3.2% of the soil thickness. Static vertical loading is an effective method to compact the loose fill.
2. Static vertical loading represents the dead load of the cyclic torsional shear compactor. After the application of q = 9.2 kPa, on the average, the relative density of soil increased from 35.5% to about 62%, which was less than the target
vi
value Dr = 70-85% for dense sand.
3. As compared with that for uncompacted loose sand, the effects of static vertical loading on the vertical and horizontal earth pressure, in the compressed soil mass were not significantly.
4. The application of static vertical loading q = 9.2 kPa significantly increased the cone resistance of the compressed fill. The normalize cone resistance qc / qc,loose
increased from 1.0 to 4.6 due to static compression.
5. After 20 cycles of torsional shearing with the rotation angle of = ±10° on the surface of the four 150 mm-thick lifts, the average surface settlement was 38.2 mm (volumetric strain = 6.4%). The extra surface settlement due to the torsional shearing compaction was about 19.2 mm. Cyclic torsional shearing compaction (static plus cyclic loads) is an effective method to densify loose soil.
6. With static load q = 9.2 kPa and the lift thickness of 150 mm, after 20 cycles of torsional shearing with angle of ±5°, the relative density achieved was 72 to 84%. The compacted relative density increased with increasing angle.
7. The vertical earth pressure in the fill was not influenced by the cyclic shearing compaction. However, after cyclic shearing compaction, the horizontal earth pressure in the compacted fill increased from 27% to 88%
8. After cyclic torsional shear compaction, the normalized cone resistance qc / qc,loose
increased from 4.6 to about 9.0. Test results showed the cyclic shearing compaction effects on the cone resistance in the fill was quite obviously.
Keywords: Cyclic torsional shearing; Relative density; Sand; Settlement; Compaction;
Acknowledgements
The author wishes to give his sincere appreciation to his advisor, Dr. Yung-Show Fang for his enthusiastic advice and continuous encouragement in the past two years. If there is not the guidance from him, the thesis can not be accomplished.
Very special thanks are extended to Dr. Yi-Wen Pan, Dr. Jhih-Jhong Liao, Dr. An-Bin Huang, Dr. Shen-Yu Shan and Dr. Chih-Ping Lin for their teaching and valuable suggestions. In addition, the author also felt a great gratitude to the members of his supervisory committee, Dr. Huei-Wen Chang and Dr. Tao-Wei Feng for their suggestions and discussions.
The author must extend his gratitude to Dr. Tsang-Jiang Chen, Mr. Guan-Yu Chen, Mr. Ting-Yuen Huang, Mr. Min-Yi Huang, for their support and encouragement. Appreciation is extended to all my friends and classmates, especially for Mr. Yu-An Huang, Mr. Jia-Hao Dai, Yi-Chang Li, Mr. Cheng-You Li, Mr. Shiang-Ming Huang and Mr. Jhong-Yuan Huang for their encouragement and assistance.
Finally, the author would dedicate this thesis to his girlfriend, parents, brother and sister for their continuing encouragement and moral support.
viii
Table of Contents
Abstract (in Chinese) ... i
Abstract ... iii
Acknowledgements ...v
Table of Contents ... vi
List of Tables ... ix
List of Figures ...x
List of Symbol... xvi
Chapter 1 Introduction ...1
1.1 Objectives of Study ...1
1.2 Research Outline ...2
1.3 Organization of Thesis ...3
Chapter 2 Literature Review ...4
2.1 Soil Improvement with Densification ...4
2.1.1 Densification Techniques ...5
2.1.2 Soil Densification with Vibratory Compactor ...5
2.2 Earth Pressure At-Rest ...6
2.2.1 Coefficient of Earth Pressure At-Rest ...6
2.2.2 Jaky’s Formula ...7
2.2.3 Study of Mayne and Kulhawy ...8
2.3 Effects of Soil Compaction on Earth Pressure ...9
2.3.1 Study of Duncan and Seed ...9
2.3.2 Study of Chen and Fang ...10
2.4 Cyclic Simple Shear Test ... 11
2.4.1 Study of Youd ...12
2.4.2 Study of Hsu and Vucetic ...12
2.5.1 Study of Ishibashi et al. ...14
2.6 Densification with Cyclic Torsional Shearing ...14
2.6.1 Study of Yang ...14
2.6.2 Study of Ren ...15
2.6.3 Study of Chen ...15
2.7 Assessment of Relative Density ...16
2.8 Cone Penetration Test ...17
2.8.1 Study of Jamiolkowski et al. ...17
Chapter 3 Experimental Apparatus ...19
3.1 Soil Bin ...19
3.2 Soil Pressure transducer ...20
3.3 Cyclic Torsional Shear Compactor ...20
3.4 Cone Penetration Facility ...22
3.5 Earth-Pressure Data Acquisition System ...23
Chapter 4 Soil Characteristics ...24
4.1 Soil Properties ...24
4.2 Lubricated Side Wall Friction ...25
4.3 Control of Soil Density ...25
4.3.1 Air-Pluviation of Loose Ottawa Sand ...25
4.3.2 Measurement of Soil Density...26
Chapter 5 Testing Procedure ...28
5.1 Specimen Preparation ...28
5.2 Application of Vertical Static Load ...29
5.3 Application of Cyclic Torsional Shearing ...29
5.4 Cone Penetration Test ...30
Chapter 6 Test Results ...32
6.1 Static Load Test ...32
x
6.1.2 Density Change Due to Static Load ...33
6.1.3 Stress Change Due to Static Load ...34
6.1.4 Cone Resistance Change Due to Static Load ...35
6.2 Applied Cyclic Torsional Shearing ...35
6.3 Cyclic Torsional Shear Test ...36
6.3.1 Surface Settlement Change Due to Cyclic Torsional Shearing ...36
6.3.2 Density Change Due to Cyclic Torsional Shearing ...37
6.3.3 Stress Change Due to Cyclic Torsional Shearing ...38
6.3.4 Cone Resistance Change Due to Cyclic Torsional Shearing ...39
Chapter 7 Conclusions ...41
References ...43
Tables ...48
Figures ...51
List of Tables
Table2.1.Qualitative description of granular soil deposits ... 48 Table3.1. Characteristics of normal loading discs ... 49 Table4.1. Properties of Ottawa Sand ... 50
xii
List of Figures
Fig. 2.1. Arrangement of uniform spheres ... 51
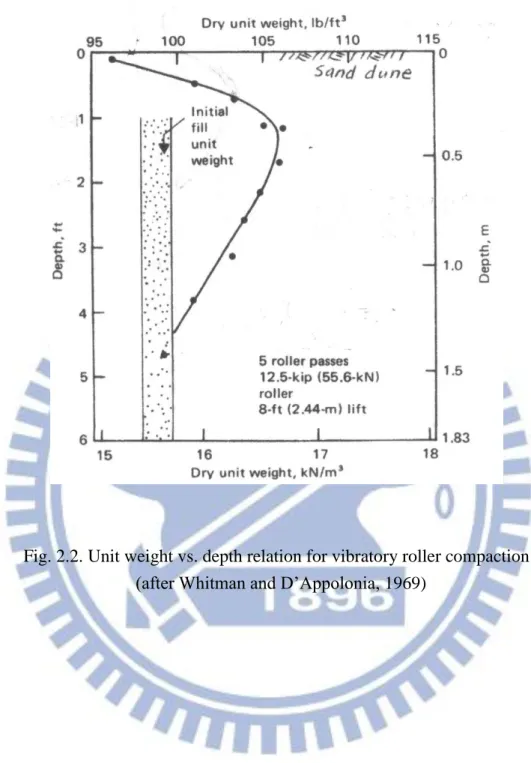
Fig. 2.2. Unit weight vs. depth relation for vibratory roller compaction ... 52
Fig. 2.3. Compacted unit weight profiles for 8-ft lift heights for 2, 5, 15, and 45 vibratory roller passes ... 53
Fig. 2.4. Approximate method for determining lift height required to achieve a minimum compacted relative density of 75% with five roller passes using data for a large lift height ... 54
Fig. 2.5. Development of in-situ stresses ... 55
Fig. 2.6. Principal Stresses on a Soil Element ... 56
OAB ... 57
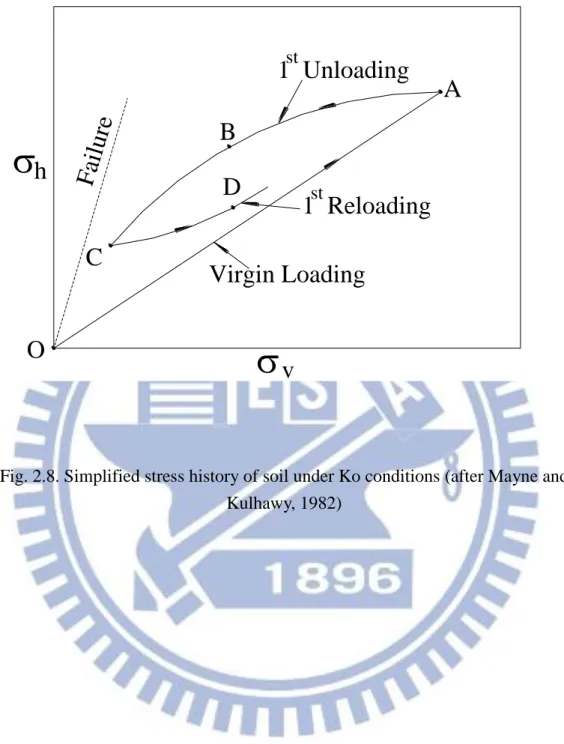
Fig. 2.8. Simplified stress history of soil under Ko conditions... 58
... 59
Fig. 2.10. Basic components of hysteretic Ko-loading/unloading model ... 60
Fig. 2.11. Comparison between Final Pressure Distributions Based on Incremental Analysis and Hand Solution... 61
Fig. 2.12. Distribution of Horizontal Earth Pressure after Compaction ... 62
Fig. 2.13. Stress path of a soil element under compaction... 63
Fig. 2.14. Horizontal Earth Pressure Estimated with Various Methods after Compaction 64 Fig. 2.15. NGI cyclic simple shear apparatus ... 65
Fig. 2.16. Stress conditions of a soil specimen cyclic horizontal shear stress ... 66
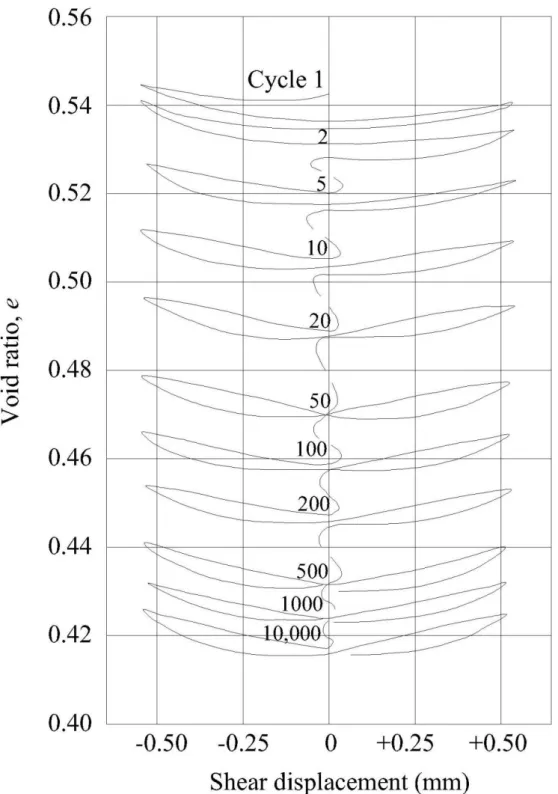
Fig. 2.17. Void ratio versus cyclic displacement for densification of a sand with successive cycles of shear ... 67
Fig. 2.18. Sketch of typical results of cyclic simple shear strain-controlled tests with definitions of volumetric cyclic threshold strain ... 68
Fig. 2.20. Variation of cyclic volumetric strain as a function of cyclic shear strain ... 70
Fig. 2.21. Change of relative density with one-way and cyclic disc shearing versus normal stress ... 71
Fig. 2.22. Change of relative density due to cyclic disc shear with number of cycles ... 72
Fig. 2.23. Change of relative density due to cyclic disc shear at different depths with high of layer ... 73
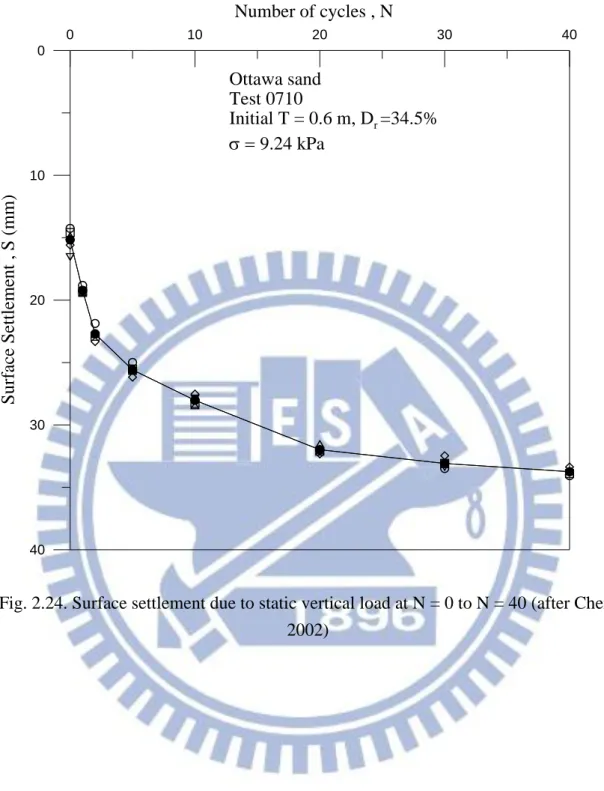
Fig. 2.24. Surface settlement due to static vertical load at N = 0 to N = 40 ... 74
Fig. 2.25. Distribution of relative density due to cyclic torsional shearing ... 75
Fig. 2.26. Distribution of relative density in lift 1 to 4 ... 76
Fig. 2.27. Relationship between Relative density and qc ... 77
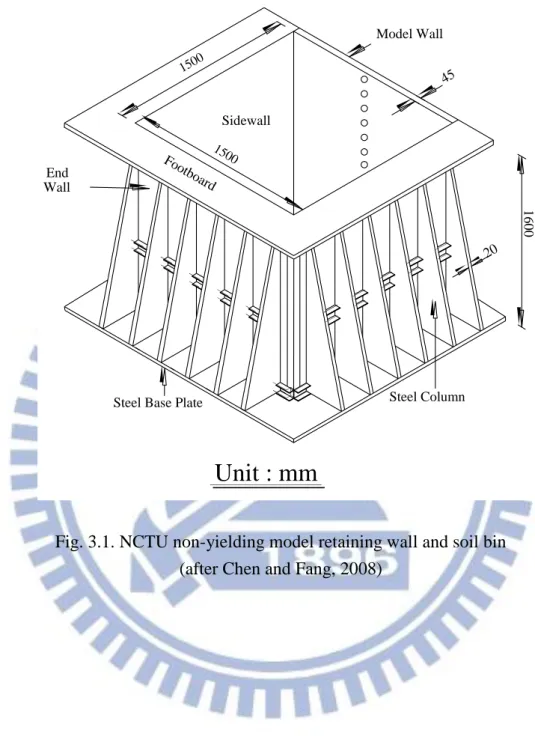
Fig. 3.1. NCTU non-yielding model retaining wall and soil bin ... 78
Fig. 3.2. Soil-Pressure Transducer (Kyowa BE-2KCM17) ... 79
Fig. 3.3. Dimensions of cyclic torsional shear compactor ... 80
Fig. 3.4. Cyclic torsional shear compactor ... 81
Fig. 3.5. Bottom of shearing disc with radial fins ... 82
Fig. 3.6. Dimensions of a radial fin ... 83
Fig. 3.7. Bottom of shearing disc with SAFETY WALK ... 84
Fig. 3.8. Dimensions of normal loading discs ... 85
Fig. 3.9. Dimensions of torque loading frame ... 86
Fig. 3.10. Torque loading frame ... 87
Fig. 3.11. Dimensions of torque wrench ... 88
Fig. 3.12. Dimensions of digital torque wrench... 89
Fig. 3.13. Torque wrench are installed on the cyclic torsional loading frame ... 90
Fig. 3.14. Cone penetration facility of CYCU ... 91
Fig. 3.15. Data acquisition system ... 92
Fig. 4.1. Grain size distribution of Ottawa sand ... 93
Fig. 4.2. Lubrication layer on the side wall ... 94
xiv
Fig. 4.4. Soil hopper ... 96
Fig. 4.5. Pluviation of Ottawa sand into soil bin ... 97
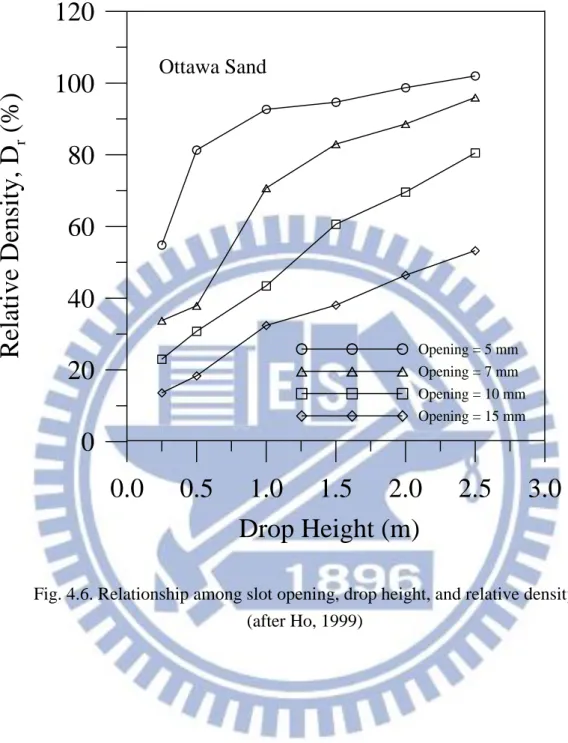
Fig. 4.6. Relationship among slot opening, drop height, and relative density ... 98
Fig. 4.7. Dimensions of soil density cup ... 99
Fig. 4.8. Soil density cup ... 100
Fig. 4.9. Soil density cups buried at different elevations ... 101
Fig. 4.10. Arrangement of soil density cups at same elevation ... 102
Fig. 4.11. Measurement of soil mass in density cup ... 103
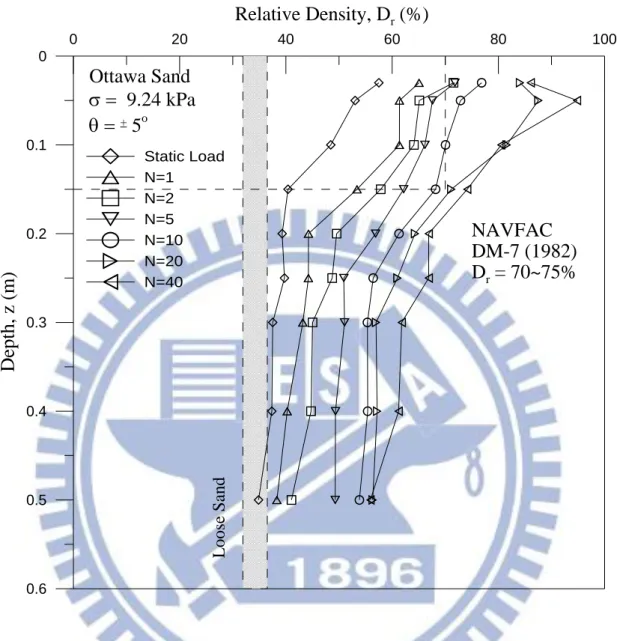
Fig. 4.12. Distribution of relative density with depth ... 104
Fig. 5.1. Soil storage ... 105
Fig. 5.2. Sand hopper and electrical scale ... 106
Fig. 5.3. Sand hopper lifted by overhead crane ... 107
Fig. 5.4. Air-pluviation of Ottawa sand into soil bin ... 108
Fig. 5.5. Portable hanging ladders and bridge board hanging on side wall ... 109
Fig. 5.6. Level soil surface with a brush ... 110
Fig. 5.7. Check density cup horizontal with a bubble level ... 111
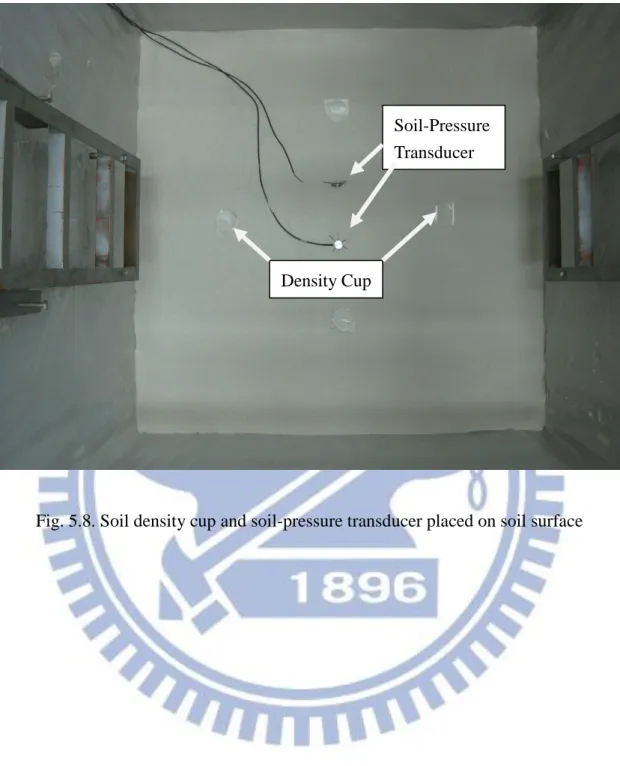
Fig. 5.8. Soil density cup and soil-pressure transducer placed on soil surface ... 112
Fig. 5.9. Soil density cups and soil-pressure transducer buried at different elevations ... 113
Fig. 5.10. Grid points on soil surface ... 114
Fig. 5.11. Hoist of CTSC into the soil bin ... 115
Fig. 5.12. 5×5 and 4×4 loading formations of disc shearing location ... 116
Fig. 5.13. Apply vertical static load on loose sand ... 117
Fig. 5.14. Fixed light dot from laser distance meter ... 118
Fig. 5.15. Apply cyclic torsional shear on loose fill ... 119
Fig. 5.16. Shear disc at initial position = 0° ... 120
Fig. 5.17. Shear disc rotated to = +5° ... 121
Fig. 5.18. Shear disc rotated to = - 5° ... 122
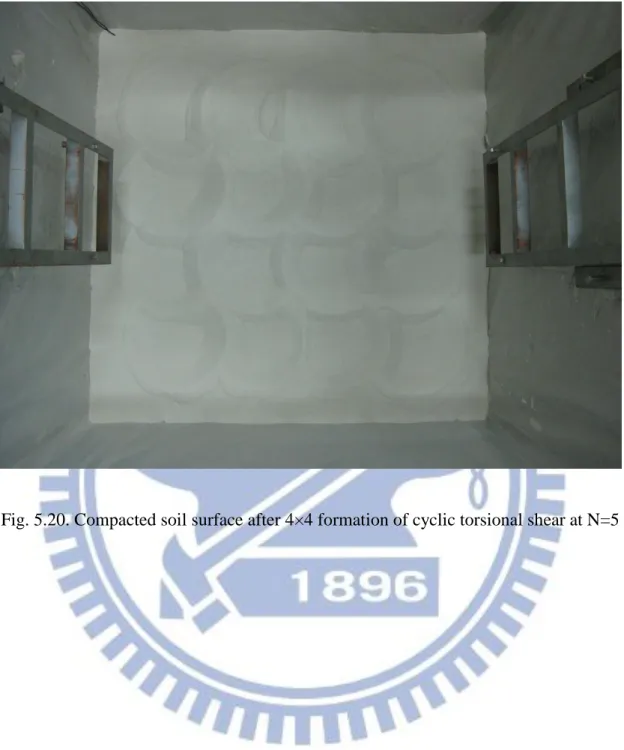
Fig. 5.20. Compacted soil surface after 4×4 formation of cyclic torsional shear at N = 5
... 124
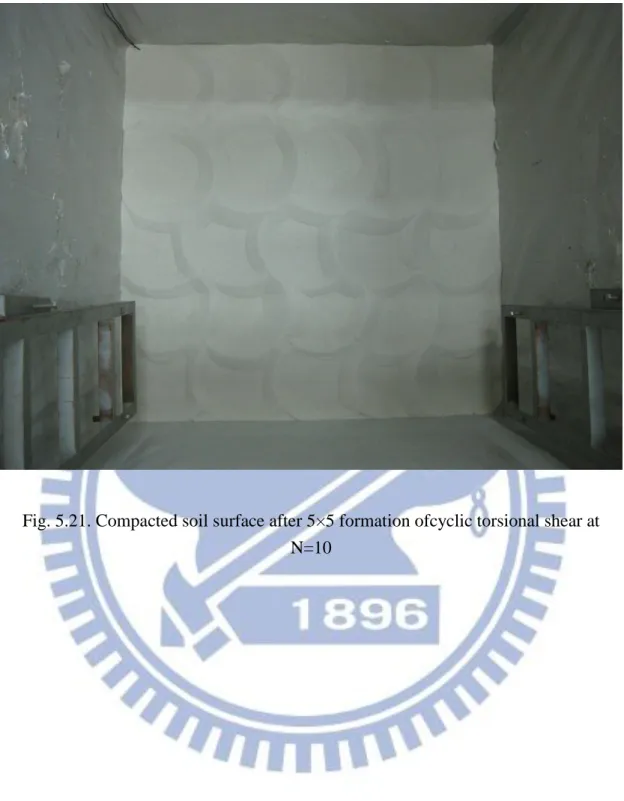
Fig. 5.21. Compacted soil surface after 5×5 formation ofcyclic torsional shear at N = 10 ... 125
Fig. 5.22. Compacted soil surface after 4×4 formation ofcyclic torsional shear at N = 20 ... 126
Fig. 5.23. Soil density cups dug out of compacted soil mass ... 127
Fig. 5.24. Scraping of soils toward edge of density cup with a spatula ... 128
Fig. 5.25. Brush away soil particles from base plate of density cup ... 129
Fig. 5.26. Arrangement of cone penetration location ... 130
Fig. 5.27. Steel beam on top of soil bin for CPT test ... 131
Fig. 5.28. Electric motor and movable plate fixed to the steel beam by the screws ... 132
Fig. 5.29. Connect cone penetrometer with electric motor ... 133
Fig. 5.30. Cone penetrometer on soil surface ... 134
Fig. 6.1. Settlement measurement with laser distance meter ... 135
Fig. 6.2. Surface settlement due to static vertical loading ... 136
Fig. 6.3. Distribution of relative density due to static vertical loading ... 137
Fig. 6.4. Distribution of relative density due to static vertical loading ... 138
Fig. 6.5. Locations of SPT to measure distribution of earth pressure ... 139
Fig. 6.6. Distribution of vertical earth pressure with depth ... 140
Fig. 6.7. Distribution of horizontal earth pressure with depth ... 141
Fig. 6.8. Distribution of cone resistance in soil mass ... 142
Fig. 6.9. Distribution of relative density after static load ... 143
Fig. 6.10. Digital torque wrench ... 144
Fig. 6.11. Torque with number of cyclic for = ±1∘, ±3∘, ±5∘, ±7∘ and ±10∘ ... 145
Fig. 6.12. Variation of torque with shearing angle ... 146
Fig. 6.13. Determine the maximum torsional shear stress at the edge of the shearing disc due to the applied torque ... 147
xvi
Fig. 6.14. Maximum shear stress with shearing angle ... 148 Fig. 6.15. Settlement after cyclic torsional shearing ... 149 Fig. 6.16. Settlement after cyclic torsional shearing ... 150 Fig. 6.17. Distribution of relative density due to cyclic torsional shearing at = ±1° .... 151 Fig. 6.18. Distribution of relative density due to cyclic torsional shearing at = ±3° .... 152 Fig. 6.19. Distribution of relative density due to cyclic torsional shearing at = ±5° .... 153 Fig. 6.20. Distribution of relative density due to cyclic torsional shearing at = ±7° .... 154 Fig. 6.21. Distribution of relative density due to cyclic torsional shearing at = ±10° .. 155 Fig. 6.22. Distribution of relative density after cyclic torsional shearing... 156 Fig. 6.23. Relative density with shearing angle ... 157 Fig. 6.24. Distribution of vertical earth pressure after cyclic torsional shear at = ±1° . 158 Fig. 6.25. Distribution of vertical earth pressure after cyclic torsional shear at = ±3° . 159 Fig. 6.26. Distribution of vertical earth pressure after cyclic torsional shear at = ±5° . 160 Fig. 6.27. Distribution of vertical earth pressure after cyclic torsional shear at = ±7° . 161 Fig. 6.28. Distribution of vertical earth pressure after cyclic torsional shear at = ±10°
... 162 Fig. 6.29. Distribution of vertical stress after static loading and cyclic torsional shearing
... 163 Fig. 6.30. Normalized vertical stress after cyclic torsional shearing ... 164 Fig. 6.31. Distribution of horizontal earth pressure after cyclic torsional shear at = ±1°
... 165 Fig. 6.32. Distribution of horizontal earth pressure after cyclic torsional shear at = ±3°
... 166 Fig. 6.33. Distribution of horizontal earth pressure after cyclic torsional shear at = ±5°
... 167 Fig. 6.34. Distribution of horizontal earth pressure after cyclic torsional shear at = ±7°
... 168 Fig. 6.35. Distribution of horizontal earth pressure after cyclic torsional shear at = ±10°
... 169
Fig. 6.36. Distribution of horizontal stress after static loading and cyclic torsional shearing ... 170
Fig. 6.37. Normalized horizontal stress after cyclic torsional shearing ... 171
Fig. 6.38. Distribution of cone resistance after cyclic torsional shear at = ±1° ... 172
Fig. 6.39. Distribution of cone resistance after cyclic torsional shear at = ±3° ... 173
Fig. 6.40. Distribution of cone resistance after cyclic torsional shear at = ±5° ... 174
Fig. 6.41. Distribution of cone resistance after cyclic torsional shear at = ±7° ... 175
Fig. 6.42. Distribution of cone resistance after cyclic torsional shear at = ±10° ... 176
Fig. 6.43. Distribution of cone resistance after cyclic torsional shearing ... 177
Fig. 6.44. Distribution of qc / qc,loose after cyclic torsional shearing ... 178
Fig. 6.45. Distribution of relative density after cyclic torsional shear at = ±1° ... 179
Fig. 6.46. Distribution of relative density after cyclic torsional shear at = ±3° ... 180
Fig. 6.47. Distribution of relative density after cyclic torsional shear at = ±5° ... 181
Fig. 6.48. Distribution of relative density after cyclic torsional shear at = ±7° ... 182
xviii
List of Symbols
Cu = Uniformity Coefficient
Dr = Relative Density
D10 = Diameter of Ottawa Sand whose Percent finer is 10%
D60 = Diameter of Ottawa Sand whose Percent finer is 60%
emax = Maximum Void Ratio of Soil
emin = Minimum Void Ratio of Soil
f = Frequency Gs = Specific Gravity
N = Number of Cycle T = Torque
z = Depth from Surface
= Normal Stress
= Unit Weight of Soil
max = Maximum Torsional Shear Stress
= Disc Rotation Angle
= Angle of Internal Friction of Soil
i = Angle of Interface Friction
sw = Angle of Side-Wall Friction
Chapter 1
INTRODUCTION
In the construction of highway embankments, earth dams, and many other engineering structures, engineers are required to compact loose soils to increase their densities. The objective of the compaction operation is to improve the engineering properties of soil such as increasing shear strength, bearing capacity, and reducing permeability and settlement. Various techniques had been used to increase the bearing capacity of shallow foundations, to increase the factor of safety against possible slope failure of embankments and earth dams, and to reduce the shrinkage and swelling of soils.
1.1 Objectives of Study
Commonly used methods for soil improvement, included compaction, vibroflotation, dynamic compaction, compaction sand pile, blasting method, vibro rod, and stone columns. Most of these engineering methods may produce significant noise and vibration during construction, thus not suitable for use in the metropolitan area. In this study, the cyclic torsional shear compaction is introduced as an alternative construction method. With this compaction method, the relative density of sand could increase from 35.5% up 85%. This method produces low noise and no low vibration. The purpose of this study is to investigate the change of soil density, change of stress, and increase of CPT cone resistance in the soil mass due to compaction.
2
1.2 Research Outline
Air-dry Ottawa sand was placed in four lifts and each lift was compacted to achieve a relative density of 75%. Each compacted lift was 0.15 m thick. The instrumented nonyielding wall facility at National Chiao Tung University in Taiwan was used to investigate the effects of vibratory compaction on the change of stresses at the soil-wall interface.
Compaction is a particular kind of soil stabilization and one of the oldest methods for improving existing soil or man-placed fills. The objective of the compaction operation is to improve the engineering properties of soil such as increasing the fill’s bearing capacity or reducing settlement. For granular soils, achieving a relative density of 70-75% is generally recommended (US Navy 1982). Hand tampers and vibratory compaction equipment are commonly used to compact the fills.
Conventionally, the earth pressure at rest is evaluated by the Jaky equation (Jaky 1944). Based on their laboratory tests, Sherif et al. (1984) found that the Jaky’s equation (Ko = 1-sin) gives good results when the backfill is loose sand, where Ko
=coefficient of earth pressure at rest and = internal friction angle of soil. When the backfill behind the wall is either compacted or vibrated to increase its density, the magnitude of at-rest stresses increases due to densification.
This paper presents experimental data associated with the surface settlement, relative density, stresses, and cone resistance acting on a nonyielding wall at different stages of soil filling and compaction. Based on the experimental data, a possible mechanism of soil behavior under cyclic torsional shearing compacting is proposed. All of the experiments mentioned in this paper were conducted in the National Chiao Tung University (NCTU) nonyielding retaining wall facility, which is briefly described in the following section.
1.3 Organization of Thesis
This paper thesis divided into the following parts:
1. Review of past investigations regarding cyclic torsional shear compaction of cohesionless soils. (Chapter 2)
2. Description of the National Chiao Tung University non-yielding soil bin, cyclic torsional shear compactor and cone penetration device. (Chapter 3) 3. Backfill characteristics and soil density control technique. (Chapter 4) 4. Description of testing procedure. (Chapter 5)
5. Experimental results of the surface settlement due to compaction, relative density distribution in soil mass, stresses induced by compaction and cone resistance in the soil due to cyclic torsional shear compaction. (Chapter 6) 6. Conclusions. (Chapter 7)
4
Chapter 2
Literature Review
Das (2010) stated that the soil at a construction site may not always be totally suitable for supporting structures such as buildings, bridges, highways, and dams. For example, in granular soil deposits, the in situ soil may be very loose and perform a large elastic settlement under loading. In such a case, the soil needs to be densified to increase its unit weight and thus its shear strength.
Sometimes the top layers of soil are undesirable and must be removed and replaced with better soils on which the structural foundation can be built. The soil used as fill should be well compacted to sustain the desired structural load. Compacted fills may also be required in low-lying areas to raise the ground elevation for construction of the foundation.
To improve its engineering properties, contractors are generally required to compact the loose soils to increase their unit weights and reducing settlements. Previous studies associated with the compaction-induced effects such as the change of soil density, the change of stresses in the soil mass and mechanism of soils under compaction are discussed in this chapter.
2.1 Soil Improvement with Densification
Kramer (1996) defined the common soil improvement techniques to mitigate seismic hazards, soil improvement method were divided into four categories including (1) densification techniques (vibrofloatation, vibro rod, dynamic compaction, blasting,
and compaction grouting); (2) reinforcement techniques (stone columns, compaction piles, and drilled inclusions); (3) grouting and mixing techniques (permeation grouting, intrusion grouting, soil mixing, and jet grouting), and (4) drainage techniques. In this thesis, only the densification of cohesionless soil were discussed.
2.1.1 Densification Techniques
Fig. 2.1 shows two of the many possible ways that a system of equal-sized spheres can be packed. Looser systems than the simple cubic packing can be obtained by carefully constructing arches within the packing, but the simple cubic packing in Fig.2.1 (a) is the loosest of the stable arrangements. The dense packings in Fig.2.1 (b) represent the densest possible state for such a system. A dense packing of soil spheres can be reached by soil densification techniques.
2.1.2 Soil Densification with Vibratory Compactor
D’Appolonia et al. (1969) proposed the vibratory rollers are particularly useful for compacting granular soils. Fig. 2.2 shows the effects of compaction of a 8-ft lift dune sand after five passes by a vibratory roller. The low unit weight that remains in the uppermost zone is due to vibration and lack of confinement in sand. Fig. 2.3 shows the compacted unit-weight profiles for the same dune sand after 2, 5, 15, and 45 roller passes. For field compaction work, the specification requires that the granular soil be compacted to a certain minimum relative density at all depths. Determination of the height of each lift depends on the type of roller and the economic number of passes. The method for determination of the lift height is shown in Fig. 2.4. For soils at all depths to reach a minimum relative density Dr = 75%, the lift thickness should be controlled to be less than 18 inch.
6
2.2 Earth Pressure At-Rest
2.2.1 Coefficient of Earth Pressure At-Rest
In Fig. 2.5(a), a soil element A located at depth z is compressed by the overburden pressure =z. During the formation of the deposit, the element A is consolidated under the pressure v. The vertical stress induces a lateral deformation against surrounding soils due to the Poisson’s ratio effect. Over the geological period, the horizontal strain is kept to be zero and the surrounding soil would develop a lateral stress to counteract the lateral deformation. A stable stress state will develop that the principal stresses acts1 and 3 on the vertical and horizontal planes, as shown in Fig. 2.5(b).
The soil in a state of static equilibrium condition is commonly termed as the Ko
condition. Donath (1891) defined the ratio of the horizontal stress h to vertical stress
v as the coefficient of earth pressure at-rest, Ko, or
v h o K (2.1)
Sincev = z, then h = K0z, where is the unit weight of soil.
For an isotropic soil element shown in Fig. 2.6, if the soil behaved as an ideal elastic material, based on the mechanics of materials, the lateral strain y can be
expressed as: y y ( x z) E E (2.2) or ( h v) h h E E (2.3)
Base on the definition of the at-rest condition, the lateral strain would be zero (εh=
0) under the application of stress state and theh = Kov. Then the Eq. 2.3can be written as:
0
)
(
1
o v o v v hK
K
E
(2.4) 1 o K (2.5)It should be mentioned that Eq. 2.5 is applicable for the isotropic and elastic materials only. However, the behavior of soil element is more complex and far from these assumptions. It is evident that the relationship between Ko and elastic parameter, Eq. 2.5 is not practical for predicting in-situ horizontal stress.
2.2.2 Jaky’s Formula
Several scholars attempted to set up a theoretical relationship between the strength properties of a soil and Ko. The empirical relationship to estimate Ko of
coarse-grained soil is discussed in the following section.
Mesri and Hayat (1993) reported that Jaky (1944) established a relationship between Ko and maximum effective angle of internal friction by analyzing a talus of
granular soil freestanding at the angle of repose. Jaky (1944) supposed that the angle of repose is analogous to the angle of internal friction . This is reasonable for a sedimentary, normally consolidated material. Jaky (1944) reasoned that the sand cone OAD in Fig. 2.7 is in a state of equilibrium and its surface and inner points are motionless. The horizontal pressure acting on the vertical plane OC is the earth pressure at-rest. Slide planes exist in the inclined sand mass. However, as OC is a line of symmetry, shear stresses can not develop on it. Hence OC is a principal stress trajectory. Based on the equations of equilibrium, Jaky expressed the coefficient of earth pressure at-rest Ko with the angle of internal friction,
8
(2.6) In 1948, Jaky presented a modified simple expression given by Eq. 2.7.
(2.7) Mayne and Kulhawy (1982) reported that, the approximate theoretical relationship
for Ko for normally consolidated soils supposed by Jaky appears valid for
cohesionless soils. Using Jaky’s equation to estimate the in-situ lateral earth pressure is reliable for most engineering purposes.
2.2.3 Study of Mayne and Kulhawy
Mayne and Kulhawy (1982) investigated the relationship between Ko and
(over-consolidation ratio)OCR for the soil with primary loading–unloading–reloading conditions. They considered the simplified stress history depicted in Fig. 2.8 for a homogeneous soil deposit with horizontal ground surface. Stress path OA represents virgin loading of the soil deposit, associated with sedimentation and normally–consolidated conditions. As represented by Fig. 2.8, the at-rest coefficient remains constant during virgin compression (Konc). Any reduction in the effective
overburden stress results in overconsolidation of the soil, represented by path ABC. As shown in Fig. 2.8, it is obviously that the overconsolidation ratio, OCR which is defined as v,max / v has a pronounced effect on the value of Ko. If loading is
reapplied, the reload relationship subsequently will follow a path similar to CD in Fig. 2.8. Subsequent unloading and reloading is likely to cause stress path to occur within the loop ABCDA.
To evaluate the behavior of horizontal stresses during vertical loading–unloading–reloading conditions. Mayne and Kulhawy (1982) reviewed laboratory data of 171 different soils tested and reported by many researchers from various sources published in the geotechnical literature. Based on the method of
sin
1
sin
3
2
1
)
sin
1
(
K
o
sin 1 o Kstatistical analysis as indicated in Fig. 2.9, Mayne and Kulhawy (1982) concluded the approximate theoretical relationship for Konc of normal consolidated soil introduced
by Jaky (1944) is in good agreement with these data. Numerous investigators have suggested that Konc may correlate with liquid limits, plasticity index, clay fraction,
uniformity coefficient, void ratio, or other index properties of the soil. However, on the basis of findings, the data collected did not confirm any of these relationships. Mayne and Kulhawy (1982) deduced that only the effective stress friction angle, and prior stress history (OCR and OCRmax) are needed to predict approximate values of
Ko.
2.3 Effects of Soil Compaction on Earth Pressure
Compaction of a loose soil can produce a stiff, low settlement-free and less permeable mass. It is usually accomplished by mechanical means that cause the density of soil to increase. At the same time the air voids were reduced.
Several theories and analytical methods had been proposed to analyze the residual lateral earth pressures induced by soil compaction. Most of these theories introduced the idea that compaction represented a form of over consolidation, where stresses resulting from a temporary or transient loading condition were retained following the removal of this load.
2.3.1 Study of Duncan and Seed
Duncan and Seed (1986) presented an analytical procedure for evaluation of peak and residual compaction-induced stresses either in the free field or adjacent to vertical, non-deflecting soil-structure interfaces. This procedure employs a hysteretic Ko
-loading model shown in Fig. 2.10. The model is adapted to incremental analytical methods for the evaluation of peak and residual earth pressures resulting from the
10
placement and compaction of soil. When the surcharge is applied on the soil surface, it will increase the vertical stress and the horizontal stress. In Fig. 2.10, as the virgin loading is applied on the soil, both v andh increase along the Ko-line (Ko = 1-sin).
Nevertheless, when the surcharge is removed, v and h would decrease along the virgin unloading path. As virgin reloading was applied again, the increment of earth pressure is less than that induced by the first virgin loading.
Seed and Duncan (1983) brought up a simple hand calculation procedure which results in good agreement with the incremental procedure described above. In Fig. 2.11, it is apparent the simple hand solution has a good agreement with the incremental procedure.
2.3.2 Study of Chen and Fang
The distribution of horizontal earth pressure against the nonyielding wall after the compaction of soil Lift 1 to Lift 5 is shown in Fig. 2.12 (a) to (e). Each compacted lift was 0.3 m thick after compaction. The variation of lateral earth pressure was monitored by the soil pressure transducers mounted on the wall. After vibratory compaction, it is clear in Fig. 2.12 (a) to (e) that an extra horizontal normal stress △h,ci was induced by compaction. The lateral stress distribution measured near the top of the backfill was almost identical to the passive earth pressure estimated with Rankine theory. From Fig. 2.12 (a) to (e), it is interesting to note that the compaction-influenced zone rose with the rising compaction surface. It was also interesting to note in Fig. 2.12(c) to (e) that, below the compaction-influenced zone, the measured horizontal stresses converged to the earth pressure at rest based on Jaky’s equation. In Fig. 2.12, data points obtained from Tests C0903 and C1141 indicated that the experimental results were quite reproducible.
nonyielding wall are displayed in Fig. 2.13. Test data shown in Fig. 2.13(a) were measured by SPT 2 and SPT 102. In the figure, the path F1 represents the stress variation due to the “filling” of the loose Lift 1. It is clear that the stress path F1 is in good agreement with Jaky’s prediction. The filling of sand Lifts 1-5 stress (paths F1-F5) caused an obvious increase in vertical pressure.
Stress path C1 represents the stress variation due to the “compaction” on the surface of soil Lift 1. During the compaction of soil Lift 1 (stress path C1), the lateral earth pressure h measured by SPT2 on the nonyielding wall increased significantly, but the vertical normal stress in soil mass was not affected by compaction. The compaction on Lift 2 (stress path C2) caused the h to increase further. However, the compaction on the surface of Lift 3 resulted in a lateral pressure reduction at SPT2 as indicated by the stress path C3. The compaction on the surface of Lifts 3 and 4 gradually brought the soil element located in front of SPT2 back to an at-rest stress condition. The horizontal earth pressure change was mainly caused by the compaction process, not soil filling. Similar trends can also be observed in Fig. 2.13 (b) and (c).
In Fig. 2.14, the experimental test results are compared with the design recommendations proposed by Broms (1971), NAVFAC DM-7.2 (US Navy 1982), Duncan and Seed (1986), Peck and Mesri (1987), and Duncan et al. (1991). Parameter values used in the pressure calculation such as the unit weight , relative density Dr, internal friction angle , wall friction angle , and cyclic compaction stress cyc are shown in Fig. 2.14. The horizontal pressure distribution suggested by the Navy Design Manual DM-7.2 was based on the analytical method proposed by Ingold (1979). The pressure distribution determined with the method proposed by Duncan et al. (1991) was obtained from the design chart for vibratory plates with a cyclic compaction stress q = 34.9 kN/m2 (5 psi).
12
2.4 Cyclic Simple Shear Test
The cyclic simple shear test is a convenient method for determining the shear modulus and damping ratio of soils. It is also a convenient device for studying the liquefaction behavior of saturated cohesion less soils. In fig.2.15, Airey and Wood (1987) showed the NGI cyclic simple shear apparatus. In the cyclic simple shear test, a soil specimen, usually 20-30 mm high with a diameter of 60-80 mm, is subjected to a vertical effective stress v and a cyclic shear stress τcyc, as shown in Fig. 2.16. The
horizontal load necessary to deform the specimen is measured by the horizontal load cell, and the shear deformation of the specimen is measured by the linear variable differential transformer LVDT.
2.4.1 Study of Youd
Youd (1972) reported the experimental results regarding the void-ratio reduction of sand due to cyclic simple shearing. Fig. 2.17 shows the gradual densification of sand by repeated shear displacement in a simple shear test. Each cycle of shear straining reduces the void ratio of the soil by a certain amount, although at a decreasing rate. Decrease in volume of the sand, as shown in Fig. 2.17, can take place only if drainage occurs freely. In the figure, after 10,000 cycles, the void ratio of sand was reduced from 0.54 to 0.42. It is obvious from the figure that cyclic shearing is an effect measure to densify the cohesioless soil.
2.4.2 Study of Hsu and Vucetic
Hsu and Vucetic (2004) studied the volume decrease of dry or partially saturated sands subjected to several cycles of cyclic shear strain amplitudes c. If the cyclic
shear strain amplitudesc1 are smaller than a certain threshold value called the volumetric cyclic threshold shear straintv (c1 <tv), their volume will not change. Such cyclic behavior is depicted schematically in Fig. 2.17. In the figure the results of three cyclic strain-controlled direct simple shear (DSS) tests conducted on dry or over time t are presented in Fig. 2.18(a). The resulting variations of vertical strain v are presented in Fig. 2.18(b). The relationship betweenc, the permanent cyclic vertical strainvc, and the number of cycles N, is presented in Fig. 2.18(c). The strain vc in Fig. 2.18(c) is taken asv at the end of cycle N, and it is also called the cyclic settlement strain.
It can be seen in Fig. 2.18(c) how below certaintv the soil does not settle (vc = 0), while above it, it settles significantly (vc > 0). Accordingly, the amplitudetv represents the boundary between two fundamentally different types of volume change behavior. Belowtv , the soil particles are not displaced with respect to each other and the soil’s mineral skeleton and volume remain practically unchanged during cycling loading. When the soil is subjected toc >tv , the particles are displaced with respect to each other irreversibly, resulting in permanent changes of the soil’s volume and microstructure. It is clear in Fig. 2.18 that the cyclic shearing is an effective method to reduce the vertical strain of soil, and to densify the soil mass.
2.5 Cyclic Torsional Simple Shear Test
Fig. 2.19 shows the cyclic torsional simple shear device proposed by Ishibashi et al. in 1985. In this device, a hollow cylindrical specimen 71.1 mm in outside diameter, 50.8 mm in inside diameter, and 142.2 mm in height, can be subjected to independent variations of axial stress, inner and outer confining pressure, and torsional shear stress
14
or strain. Thus the device closely simulates the ideal in situ condition and enable us to apply a known value of the lateral confining stress.
Static and cyclic torsional shear stresses can be applied by MTS closed-loop servo-hydraulic linear actuator by means of a torque loading rod, ball bearing spline, and axial loading piston. The movement of the MTS actuator is corrected by feedback signals either from the torque transducer for cyclic stress controlled tests, or from the rotational LVDT for cyclic strain controlled tests. The specimen is subjected to the programmed cyclic motion by the MTS commanding unit without any effect of the piston friction and torsional distortion of the loading piston and transducers.
2.5.1 Study of Ishibashi et al.
Ishibashi et al. (1985) studied the volume change of a hollow cylindrical Ottawa sand specimen subjected to cyclic torsional shearing in drained conditions. The experiments were conducted under uniform cyclic shear strains and the following conclusions were drawn. In Fig. 2.20, relationships between the cyclic volumetric strain the uniform cyclic shear straincyc for a given number of cycle is nearly linear. It is clear in Fig. 2.17 that the volume reduction of the soil specimen is significantly influenced by the cyclic shear strain load cyc and the number of cyclic shear stress application N.
2.6 Densification with Cyclic Torsional Shearing
2.6.1 Study of Yang
the soil settlement due to cyclic torsional shearing. The diameter of the shearing disc was 198 mm. The diameter of the cylindrical sandy specimen was 200 mm, and the height of the soil specimen was 105 mm. The cyclic shear tests were carried out with initial relative densities from 30 % to 50 %, and normal stresses applied from 7 kPa to 150 kPa. One-way and cyclic (N=1) shear stresses were applied on Mai Liao sand, Vietnam sand, and Ottawa sand. Fig. 2.21 shows the relative density increase due to cyclic shearing (N=1) was about twice that due to one-way shearing.
2.6.2 Study of Ren
Ren (2006) studied the soil densification due to cyclic torsional shearing. The diameter of the sandy specimen was 200 mm and the height was 105 mm. The diameter of the shear disc was 198 mm. Mailiao sand, Ottawa sand and Vietnam sand were tested with an initial relative density of 30 %. Normal stresses of 20, 60 and 100 kPa, and the shear angle 10˚, 20˚, 30˚, 60˚ and 90˚ were used for testing.
Fig. 2.22 showed the relative density of sand increased with increasing number of cyclic shear stress application N. The first 6 cycles of τcyc application was most
effective. Fig. 2.23 showed a greater relative density increment was achieved at a shallow depth. Less Dr increment due to the cyclic shear stress was observed at a
deeper depth.
2.6.3 Study of Chen
Chen (2011) presents experimental data on the settlement and relative density change due to cyclic torsional shearing compaction. A new cyclic torsional shearing compactor was designed and constructed at NCTU. The thickness (T) of the soil after compaction was 0.6 m. The initial relative density was 34.5% ± 2.3% and the vertical
16
pressure on the surface loading was 9.2 kPa. Fig.2.24 showed the soil surface settlements after 1, 2, 5, 10, 20, 30 and 40 cycles of cyclic torsional shearing. It was obvious that the soil settlement increased with increasing number of cycles (N) of torsional shearing.
In the first 2 cycles of torque application, surface settlement increased significantly. However, after N = 20, the major part of settlement has accomplished, soil particles were sheared and reached a densely-packed condition. Therefore, it was difficult to increase the settlement any further with more cyclic shear application.
Fig. 2.25 showed the relative density distributions of the compacted specimen for N = 1, 2, 5, 10, 20 and 40. Test results showed that the density distribution increased with increasing number of cycles of torsional shearing.
In fig. 2.26, cyclic torsional shearing was applied on the surface of each 0.15m-thick lift, and the distribution of relative density in Lifts 1 to 4. Test results revealed that the trend of pressure distribution in each 0.15 m-thick lift was similar. The average relative density achieved in each lift was greater than the required value of 70 %.
2.7 Assessment of Relative Density
ASTM Test Designation D-4253 (2007) provide a procedure for determining the minimum and maximum dry unit weights of granular soils. These unit weights can be used to determine the relative density of soil compacted in the field. The term relative density is commonly used to indicate the in situ denseness or looseness of a granular soil. Relative density is defined as
x 100% ( 2.10 )
Where e = in situ void ratio of the soil, emax = void ratio of the soil in the loosest state,
emin = void ratio of the soil in the densest state.
Das (2010) reported that the value of Dr may vary from a minimum of 0 % for very
loose soils to a maximum of 100 % for very dense soils. Soils engineers qualitatively describe the granular soil deposits according to their relative densities. In-place soils seldom have relative densities less than 20 to 30 %. Compacting a granular soil to a relative density greater than about 85 % is difficult. Lambe and Whitman (1969) reported that for dense soils the value of Dr was 65 to 85 % as shown in Table. 2.1.
US Navy Design Manual NAVFAC DM-7 (1982) reported the relative density was 70 to 75 % can be obtained by proper compaction procedures. Vibration compaction generally is the most effective procedure.
2.8 Cone Penetration Test
2.8.1 Study of Jamiolkowski et al.
The relationship between relative density of sand of the tip resistance qc of CPT
was investigated by Jamiolkowski et al. (1985). It was found that Fig. 2.27 illustrates the variation in cone resistance for a range of relative densities for different sands. The Ticino sand used by Baldi et al. (1986) was a clean, uniform silica sand with subangular grains and appears to have a moderate compressibility. Fig. 2.27 shows the range for five predominantly silica sands used under controlled laboratory conditions; field cases are likely to exhibit more variability. Base on the data in Fig.
18
2.27, the following relationship was established:
Dr = -98 + 66 log10 [qc / (o’)0.5] (2.11)
Chapter 3
Experimental Apparatus
To investigate the effects of cyclic torsional shear compaction on the relative density of in a cohesionless soil mass, the soil bin at National Chiao Tung University (NCTU) was used. All soil improvement experiments described in this chapter and there were conducted in the soil bin of the NCTU non-yielding model retaining wall facility. This chapter introduces the soil bin, soil pressure transducer, cyclic torsional shear compactor, cone penetration facility and data acquisition system used for laboratory experiments.
3.1 Soil Bin
The soil bin is designed to minimize the lateral deflection of sidewalls during testing. In Fig. 3.1, the soil bin was fabricated of steel plates with inside dimensions of 1,500 mm ×1,500 mm ×1,600 mm shown in Fig. 3.1 is 1,500 mm-wide, 1,600 mm-high, and 45 mm-thick. To achieve an at-rest condition, the wall material should be nearly rigid. It is hoped that the deformation of the model wall could be neglected when the soil bin is filled with cohesionless soil. In Fig. 3.1, twenty-four 20 mm-thick steel columns were welded to the four sidewalls to reduce any lateral deformation during loading. In addition, twelve C-shaped steel beams were also welded horizontally around the box to further increase the stiffness of the box.
Assuming a 1,500 mm-thick cohesionless backfill with a unit weight = 17.1 kN/m3, and an internal friction angle = 41o was pluviated into the soil bin. A 45
20
mm-thick solid steel plate with a Young’s modulus of 210 GPa was chosen as the wall material. The estimated deflection of the model wall would be only 1.22 × 10⁻³ mm. Therefore, it can be concluded that the lateral movement of the model wall is negligible.
The end-wall and sidewalls of the soil bin were made of 35 mm-thick steel plates. Outside the steel walls, vertical steel columns and horizontal steel beams were welded to increase the stiffness of the end-wall and sidewalls. If the soil bin was filled with dense sand, the estimated maximum deflection of the sidewall would be 1.86 × 10⁻³ mm. From a practical point of view, the deflection of the four walls around the soil bin can be neglected.
For this study, the thickness of the compacted soil is only 0.6 m-thick. The lateral earth pressure acting on the side wall would be lower than that due to a 1.5 m- thick backfill. As the results, the deflection of the side walls of the soil bin would be even less.
3.2 Soil Pressure transducer
To investigate the development of vertical stress σv and horizontal stress σh in the
soil mass fill, eight soil pressure transducers (Kyowa BE-2KCM17, capacity = 98.1 kN/m2) buried in the compacted soil. The strain-gage-type soil pressure transducer buried in the fill is shown in Fig. 3.2. The radial extensions attached to the transducers are used to prevent possible rotation due to filling and compaction. Calibration of the soil pressure transducers are indicated in the Appendix A of this thesis. The diameter of the SPT sensing area is 22 mm.
To enhance an effective soil compactor with less noise, and less vibration, a cyclic torsional shear compactor (CTSC) was developed at National Chiao Tung University (NCTU). Fig. 3.3 and 3.4 show the cyclic torsional shear compactor. The entire cyclic torsional shear compactor consists of four components, namely: (1) shearing disc; (2) normal loading discs; (3) torque loading frame; and (4) torque wrench. The design and construction of cyclic torsional shear compactor are discussed in this chapter. All of the experiments mentioned in this thesis were conducted with the NCTU cyclic torsional shear compactor, which is briefly introduced as follows.
To efficiently carry the applied cyclic shear stress from the disc to the soil, 12 steel radial steel fins were carved on the bottom of the shearing disc as shown in Fig. 3.5. Fig. 3.6 shows, the steel radial fin was 2 mm-thick, 4 mm-wide and wedge angle of the fin was 90∘. During testing, the steel fin would cut into the soil mass. To provide adequate friction between the base of the disc and the soil, the bottom of the shearing disc is covered with a layer of anti-slip frictional material called SAFETY WALK (3M). The SAFETY WALK was attached to the disc bottom on the fan-shaped areas between the steel fins as shown in Fig. 3.7. Table 3.1 shows the dimension and mass of the normal loading discs. As shown in Fig. 3.8, the outside-diameter normal loading discs is 290 mm, the diameter of the screw rod hole is 21.6 mm, the diameter of the torque shaft hold is 43 mm, and the diameter of the hoist screw hole is 10.25 mm. Without any normal loading disc, the mass of the CTSC is 24.3 kg. Adding 2 pieces of 19.8 kg and 2 pieces of 1.05 kg loading discs, the total mass of the entire CTCS is 66.0 kg. It should be mentioned that this thesis is intended to report on the preliminary experimental data obtained from a light-weight cyclic torsional shear compactor.
Fig. 3.9 and Fig. 3.10 shows the dimensions of the torque loading frame at the top of the torsional shear device. The hoist ring was screwed on top of the frame so that
22
torsional shear compactor be lifted and lowered by the overhead crane in the laboratory. Two hexagon caps were fixed on the arms of the torque frame, which enable the torque wrench to be hooked up to the torque frame. The applied torque was transmitted from the torque wrench, to the torque frame, then to the torque shaft and shear disc as illustrated in Fig. 3.3.
Fig. 3.11 (a) shows, the three torque wrenches are 600, 430, and 128 mm long. Fig. 3.11 (b) shows the torque wrench made of stainless steel. During testing, proper wrench length was selected so that no collision between the torque wrench with the sidewall of the soil bin would occur. The torque wrench was attached to the torque loading frame to induce torsional shear on the loose fill.
The digital torque wrench shown in Fig. 3.12 and Fig. 3.13 was used to measure the torque applied to the soil. The digital torque wrench has a digital torque value readout. Accuracy in the clockwise direction was ±1%, and the accuracy in the counterclockwise direction was ± 2%. Readout units included N-m, ft-lb, in-lb and kg-cm. The digital torque wrench made by OLY SCIENTIFIC Equipment Ltd. (model 921/200E) was 530 mm. Long the maximum operation range is 200 N-m. The square peg is 12.7 mm x 12.7 mm.
3.4 Cone Penetration Facility
The cone penetration facility was used to estimate the change of soil properties before and after cyclic shear compaction. This facility belong to Department of Civil Engineering, Chung Yuan Christian University (CYCU). Continuous measurements were obtained with the CPT facility. As shown in Fig. 3.14 (a) to (c), the CYCU CPT facility is composed of following these parts: (1) mini-cone penetrometer;(2) electric motor and speed control device; and (3) CPT data acquisition device (including micro signal conditioning device, DA-16 anlong to digital converter, and the lap-top
computer). A load cell was installed at the bottom of the penetrometer near the cone, to measure the cone resistance qc. After connecting the cone penetrometer to the
electric motor, the mini-cone was pushed into the soil mass at a constant speed. For this study, the speed of penetration was controlled to be 5.0 mm/s. The digital signals from the load cell of the cone penetrometer were filtered and amplified by micro signal conditioning device. Then, the experimental data were digitized by the D to A converter (USB DA-16). The digital signals were transmitted to the lab-top computer (Fig. 3.14 (b)) for storage and analysis. The mini-cone used for this study has a 60 degree apex angle and a diameter of 9 mm. The standard cone has a cross section area of 1000 mm2. But the cross-section area of the mini-cone is only 63.62 mm2.
3.5 Earth-Pressure Data Acquisition System
A earth-pressure data acquisition system was used to collect and store the considerable amount of earth pressure data generated during the tests. In the Fig. 3.15 (a) and (b) the data acquisition system is composed of the following four parts: (1) dynamic strain amplifiers (Kyowa: DPM601A and DPM711B); (2) AD/DA card (NI BNC-2090); and (3) Personal Computer. The analog signals from the sensors were filtered and amplified by the dynamic strain amplifiers. Then, the analog experimental data were digitized by an A/D-D/A card. The digital signals were then transmitted to the personal computer for storage and analysis. The software LabView was used for data collection and recording.
24
Chapter 4
Soil Characteristics
The characteristics of the fill used for soil improvement experiments are introduced in this chapter. The reduction of friction between the soil and lubricated side wall is discussed. The control and measurement of soil density distribution in the fill are also introduced.
4.1 Soil Properties
Air-dry Ottawa sand (ASTM C-778) was used throughout this investigation. Physical properties of the soil include Gs = 2.65, emax = 0.76, emin = 0.50, D60 = 0.39
mm, and D10 = 0.26 mm. Grain-size distribution of the backfill is shown in Fig. 4.1.
Major factors considered in choosing Ottawa sand as the fill material are summarized as follows.
1. Its round shape, which avoids the effect of angularity of soil grains.
2. Its uniform distribution of grain size (coefficient of uniformity Cu = 1.5), which
avoids the effects due to soil gradation.
3. High rigidity of solid grains, which reduces possible disintegration of soil particles under loading.
4. Its high permeability, which allows fast drainage and therefore reduces water pressure behind the wall.
4.2 Lubricated Side-wall Friction
To simulate the field condition of a infinite half space for the compaction constitute, the shear stress between the fill and the side walls of the soil bin should be minimized to nearly frictionless. To reduce the friction between side wall and fill Fang et al. (2004) suggested to was a lubrication layer fabricated with plastic sheets. Two types of plastic sheeting, one thick and two thin plastic sheets, were adopted to reduce the interface friction. All plastic sheets were hung vertically on the side walls before the backfill was deposited as shown in Fig. 4.2.
In this study, two thin (0.009 mm-thick) and one thick (0.152 mm-thick) plastic sheets were adopted for the soil improvement experiments. Fig. 4.3 shows the variation of side-wall friction angle sw as a function of the normal stress v for the plastic sheet method (1 thick + 2 thin sheeting) reported by Fang et al. (2004). The measured side-wall friction angle with this method is about 7.5°. For all experiments in this paper, the lubrication layers were wall applied on four side walls of the soil bin.
4.3 Control of Soil Density
4.3.1 Air-Pluviated of Loose Ottawa Sand
To achieve a uniform soil density in the backfill, Ottawa sand was deposited by air-pluviation method into the soil bin. The air-pluviation method had been widely used for a long period of time to reconstitute laboratory sand specimens. Rad and Tumay (1987) reported that pluviation is the method that provides reasonably homogeneous specimens with desired relative density. Lo Presti et al. (1992) reported
26
that the pluviation method could be performed for greater specimens in less time. Das (2010) suggested that, for granular soil deposits, the relative density Dr of
15~50%, is defined as loose, Dr = 50~70% is defined as medium, and Dr = 70~85% is
defined as dense. For the air-pluviation method, Fig. 4.4 shows the soil hopper let the sand flow through a calibrated slot opening at the lower end. A picture of the soil pluviating processes is shown in Fig. 4.5. To achieve a loose backfill, Chen (2003) adopted the drop height of 1.0 m and hopper slot opening of 15 mm. In this study, the drop height of 1.0 m and the hopper slot-opening of 15 mm were also selected to achieve the loose fill. In Fig. 4.6, the expected relative density of soil was about 35% by Ho (1999).
4.3.2 Measurement of Soil Density
To observe the distribution of soil density in the soil bin, soil density cups were made. The soil density cup made of acrylic is illustrated in Fig. 4.7. The circular cup wall was only 10 mm-high, so that the shear deformation and volume reduction could occur in the cup during testing. A picture of the soil density cup is shown in Fig. 4.8. During the preparation of the 0.6 m thick loose soil specimen, density cups were buried in the soil mass at different elevations and different locations in the backfill as shown in Fig. 4.9 and Fig. 4.10. After the loose soil had been filled up to 0.6 m from the bottom of the soil bin by air-pluviation, density cups were dug out from the soil mass carefully. Fig. 4.11 shows the mass of the cup and soil in the cap was measured with an electrical scale.
For a 0.6 m thick air-pluviated Ottawa sand layer, the distribution of soil density with depth is shown in Fig. 4.12. For the loose sand, the mean unit weight is 15.6 kN/m2, the mean relative density is Dr = 35.5 % with the standard deviation of 0.8%.
Das (2010) suggested that for the granular soil deposit with a relative density 15% Dr 50% is defined as loose sand. The relative density achieved in Fig. 4.12 is quite loose and uniform with depth.
28
Chapter 5
Testing Procedure
The procedure to conduct the cyclic torsional shear tests are introduced in this chapter. The testing procedure can be divided into three parts: (1) specimen preparation; (2) application of vertical static load; (3) application of cyclic torsional shear; and (4) cone penetration. These parts will be introduced in the following sections with pictures. The “plastic-sheets” lubrication layers were hung on the sidewalls of the soil bin before testing.
5.1 Specimen Preparation
Fig. 5.1 shows air-dry Ottawa sand in the soil storage container. Fig. 5.2 shows sand was shoveled from the soil storage to the sand hopper, and the mass of the fill was measured with an electrical scale. Fig. 5.3 shows the sand hopper was lifted by overhead crane in the laboratory. Fig. 5.4 shows Ottawa sand was deposited by air-pluviation method into the soil bin. The drop height was controlled to be 1.0 m and the hopper slot-opening of 15 mm were selected to achieve a loose fill, Fig. 5.5 (a) and (b) show portable hanging ladders were placed on top of the sidewalls, and a bridge board was placed between the ladders. Throughout the test, the operator will stay on the bridge board to avoid any unexpected surcharge on the soil specimen.
Leveling of the pluvuated soil surface by the graduate student with a brush is shown in Fig. 5.6. Four density cups were placed on each 50 mm-thick soil layer. A
total of 44 density cups were buried in the fill. Fig. 5.7 shows how check the density cup horizontal with a bubble level. Placement of a soil density cup and soil-pressure transducer on the soil surface is shown in Fig. 5.8. Fig. 5.9 shows density cups and soil-pressure transducers were buried in the soil mass at different elevations in the fill. Eight soil pressure transducers were placed at the depths of 100, 250, 400 and 550 mm The soil pulviation and density cup placement operations were repeated unit a backfill thickness T = 0.6 m was reached.
5.2 Application of Vertical Static Load
The procedure to apply the vertical static load q on top of the air-pluviated loose sand is introduced. The cyclic torsional shear compactor (24.3 kg) and the loading discs (41.7 kg) used to apply static load has a mass of 66 kg. Diameter of the circular footing is 0.3 m and the vertical static load q = 9.2 kPa. Fig. 5.10 illustrates the grid points for the vertical load application. For the first row of static load, the center of circular load was applied at 1A, 1C, 1E, 1G and 1I.
Fig. 5.11 shows the CTSC was hoisted with overhead crane into the soil bin. Fig. 5.12 (a) shows the vertical static load q was applied on the loose sand with 5x5 formation. Fig. 5.13 shows the circular static vertical load was applied on the surface of the fill with the 5x5 loading formation.
5.3 Application of Cyclic Torsional Shearing
In this study, the cyclic torsional shear was applied on the soil surface for = ±1o, ±3o, ±5o, ±7o and ±10o. Fig. 5.14 showed a light dot from the laser distance meter on the angle steel bar was used as a fixed point to the soil surface. Fig. 5.15 shows the cyclic torsional shear was applied by the operator on the loose fill to increase its