國
立
交
通
大
學
國立交通大學管理學院碩士在職專班
經營管理組
碩
士
論
文
影響台灣地區國際觀光旅館成本效率之因素:資料包
絡分析法之應用
Factors of Cost Efficiency of International Tourist
Hotels in Taiwan : An Application of Data Envelopment
Analysis
研 究 生:廖振舟
指導教授:胡均立 教授
影響台灣地區國際觀光旅館成本效率之因素:資料包絡分析法之
應用
研究生:廖振舟 指導教授:胡均立教授
國立交通大學管理學院碩士在職專班經營管理組
中 文 摘 要
本論文在分析台灣國際觀光旅館(ITH)的旅客國籍來源與成本效率的關
係。在民國 85 至 96 年期間,華僑旅客的數量對與成本效率有負向關係,
本國旅客,北美旅客和日本旅客對成本效率有正向關係。至今亞洲旅客(包
含大陸觀光客),歐洲旅客和澳洲旅客,則對成本效率沒有顯著關係。同
時,台灣國際觀光旅館加入連鎖體系,距離最近國際機場較近,會改善成
本效率。
此外,本論文將台灣國際飯店所在位置區分為台北,高雄,台中,花蓮
和風景區。發現台北和風景區的國際飯店其成本效率較佳,高雄的國際飯
店成本效率較差。台中和花蓮的國際飯店則對成本效率沒有顯著關係。
關鍵詞:旅客國籍來源, 成本效率, 國際觀光旅館。
Factors of Cost Efficiency of International Tourist Hotels in
Taiwan : An Application of Data Envelopment Analysis
Student:Jern-Jou Liao Advisors:Dr.Jin-Li Hu
The Master Program of Business and Management
College of Management
National Chiao Tung University
ABSTRACT
This paper analyzes the effects of nationality sources on cost efficiency of
international tourist hotels (ITHs) in Taiwan. From 1996 to 2007, the numbers
of overseas Chinese tourists have significantly negative effects on cost
efficiency, while the numbers of native, North American and Japanese tourist
have significantly positive effects on cost efficiency. The number of other
Asian tourists (including mainland Chinese tourists), European and Australian
tourists has no significant effect on cost efficiency. Meanwhile, the chain
system and shorter distance to the nearest international airport significantly
improve cost efficiencies.
Moreover, this study labels the location of the hotel for Taipei, Kaohsiung,
Taichung, Hualien and scenic area and discovers hotels located in Taipei and
scenic area are good for cost efficiency; hotels in Kaohsiung are poor to cost
efficiency. Taichung and Hualien hotels have no concern to cost efficiency.
誌謝
在職場十多年後,閃過重拾書包回學校的念頭。很幸運的,第一次
考試就進入了交大經館所。回顧這兩年來,家庭方面,兩個兒子的前後
誕生;工作方面,服務的公司遭逢 2008 金融海嘯因而結束;學業方面,
工科背景的我得紮實的修滿 42 學分。正因為得來不易,讓我更加的珍惜
上天的賜予。
論文的誕生,學位的取得,最要感謝的就是我的指導教授胡均立博
士,書審的交大老師,丁承博士和林介鵬博士給予的指導與建議。更要
感謝口試委員葉家瑜博士和方進義博士的寶貴建議。另外也要感謝陳金
足老師的幫忙,使得內容更加充實。
還要感謝所上謝安慈小姐,專班學長姐,同屆的同學,學弟妹,碩
士班的學弟妹,及我們阿立家族的成員們,是你們豐富我兩年的求學之
旅。
最後,我要將學位的成果獻給我的父母親,岳父母,兄嫂們,親愛
的內人及兩個可愛的兒子。尤其是內人怡如,為了照顧兩個活潑的兒子
浩宸和漢崴,和幫助我能順利畢業,暫時犧牲了工作及進修的機會,心
中的感激,世上沒有任何語言可以形容。
廖振舟 謹致
中華民國九十九年六月十五日
Table of Contents
中文提要
………
i
ABSTRACT
………
ii
誌謝
………
iii
Table of Contents
………
iv
List of Tables
………
v
List of Figures
………
vi
1. Introduction………
1
2. Literature
review………
3
3.
Methodology and Data………
7
3.1.
DEA-CCR Model and Input-oriented CCR Cost
Efficiency Model………
7
3.2. Tobit
analysis………
8
3.3.
Data Sources and Variable Definition………
8
4.
Empirical Result and Discussion………
10
4.1. Descriptive
Statistics……… 10
4.2. Cost
Efficiencies………
10
4.3.
Trends of Technical, Allocative and Cost
Efficiencies………
11
5.
Concluding Remarks……… 13
References
………
15
Appendix 1
OTE, AE, CE scores during 1996~2007……… 17
Appendix 2
Best Top 10 Cost-Efficient Hotels during 1996 ~
2007……… 29
Appendix 3
Chinese vs. English Names of ITH in
Taiwan………
31
List of Tables
Table 1 Literature of the hotel frontier efficiency………
6
Table 2 Descriptive statistics of outputs, inputs, and input prices……
11
Table 3 Top 10 best Cost efficiency Taiwan ITH during 1996 ~
2007……… 12
List of Figures
Figure 1 Numbers of Tourists by Nationality (Hotel check-in
numbers)……… 3
Figure 2 Numbers of Tourists by Top 3 Nationality (Hotel check-in
numbers)……… 4
Figure 3 Trend of International Tourist Hotel Efficiency Scores in Taiwan
1. Introduction
Tourists’ consumption is the main revenue stream of international tourist hotels (ITHs)
and the amount of them usually affects the operations of these hotels. However, tourists’
nationalities also result in different operational performances. According to the report of
Tourism 2020 Vision (United National World Tourism Organization (UNWTO), 2009), the
global tourism market will grow from 1.006 billion in 2010 to 1.561 billion person-time in
2020, and tourism-related revenue will hit US$2 trillion. The Asia-Pacific market is forecast
of grow from 195 million in 2010 to 397 million person-visits in 2020. In Taiwan, overall
tourism revenues have increased steadily. Foreign exchange income from tourism went from
NT$158.5 billion have in 2002 to NT$187.1 billion in 2008, but since 2002 Taiwan’s tourism
industry has remained at NT$200 billion. Taiwan is at the phase of maturity and growth
appears limited. Therefore, developing international tourism and earning foreign exchange
are important ways to enhance overall tourism income in Taiwan. At present, tourism has
become the main source for many countries to earn foreign exchange and is important in the
global economic development, but it is a complex industry. With the change of demands
within Taiwan’s tourism market, international tourist hotels have become one of its key and
necessary factors.
According to the statistics of the Tourism Bureau in Taiwan, from January to November
2009 the person-time amount for visitors in Taiwan reached 3,945,198, which is 12.94%
higher than the same period of the previous last year. The number of tourist visitors to
Taiwan grew by 28.46%, hitting 2,031,637 person-time, which set a historical record, and
accounted for 51% of the visitors to Taiwan. Most of the foreign visitors are from Asian
countries, like Mainland China, Japan, Hong Kong, and Macao. Indeed, the top five sources
of foreign tourists are Hong Kong & Macao, Japan, Southeast Asia, the U.S., and Singapore.
With most business travelers from Japan, Southeast Asia, the U.S., Mainland China, and Hong
Kong & Macao. To date, Taiwan has a total of 95 hotels, of which 65 are international tourist
hotels and 34 are general tourist hotels. The occupancy rates of international tourist hotels in
August 2009 were as follows: 71.66% in Taipei, 63.21% in Kaohsiung, 61.58% in Taichung,
66.16% in Hualien, and 51.59% in other areas. Therefore, international tourist hotels play
critical roles in the domestic tourism and hotel industry (Tourism Bureau, 2009). However,
our study is limited by the panel data’s latest public year which is 2007, whereas China
tourists are not separated until 2007’s report.
their average daily consumption was US$211.46, of which the expenditure on hotels
accounted for the most (44.74%), followed by shopping (23.02%) (Tourism Bureau, 2008).
This indicates that international tourist hotels are the most significant beneficiaries from
tourism industry development. However, in a severely competitive environment, the hotel
industry is encountering new impacts and challenges. Hotels should urgently enhance
service quality and operational performance, construct unique images, strengthen service
standards, and demonstrate their characteristics, styles, and multiple functions in order to
satisfy the demands of customers from different backgrounds. Operational performance is
closely associated with the sustainable development of hotels, and influences related
industries. When facing industrial competition, hotels not only should effectively control
costs for profits and growth, but also properly improve operational effectiveness. Therefore,
how to enhance productivity and effectively use resources to achieve maximum efficiency is
an important issue for hotel managers.
0
1,000,000
2,000,000
3,000,000
4,000,000
5,000,000
6,000,000
7,000,000
1996 1997 1998 1999 2000 2001 2002 2003 2004 2005 2006 2007
Australia
Europe
Overseas
Others
North America
Asia
Japan
Native
Figure 1. Numbers of Tourists by Nationality (Hotel check-in numbers)
Data sources: Operating Report of International Tourist Hotels in Taiwan (1996~2007)
Figure 2 is another form of the bar chart to understand the trend of the major 3 tourists’
nations. Taiwan and Japan tourists account for 70% from the overall. We know Asian
tourist which contains China tourist is ramping up rapidly since 2008 but during the period in
this study. During the 1996~2007, the Chinese tourists are included in the Asia area.
0
500,000
1,000,000
1,500,000
2,000,000
2,500,000
3,000,000
1996 1997 1998 1999 2000 2001 2002 2003 2004 2005 2006 2007
Native
Japan
Asia
Figure 2. Numbers of Tourists by Top 3 Nationality (Hotel check-in numbers)
Data sources: Operating Report of International Tourist Hotels in Taiwan (1996~2007)
2. Literature review
The World Travel and Tourism Council (WTTC, 2007) indicated that the global tourism
industry scale in 2000 was about 10.8% (US$3.58 trillion) of global GDP. It is estimated
that by 2010, the global tourism industry scale will reach 11.6% (US$6.59 trillion) of global
GDP. In 2000, there were 0.19 billion people working in the tourism industry around the
world, and it is estimated to be 0.25 billion people by 2010. The tourism industry is
important to both the job market and economic growth.
Past research studies on the evaluation of tourist hotels performances were mostly based
on financial ratio analysis. Greenberg (1986) employed cost-volume analysis to probe the
influence of capital in hotels and the change of sales on business revenues. Anderson et al.
(1999b) analyzed the operational efficiency of 48 tourist hotels in the U.S. in 1994 by
Stochastic Frontiers Analysis (SFA). The input variables included the number of employees,
the number of rooms, casino and entertainment expenditures, and food expenditure and other
expenditure, while the output variables included income of rooms, income of casino and
entertainment, and income of food and others. The results showed that the average
efficiency of 48 tourist hotels was up to 89.4%. Anderson et al. (1999) studied the
operational efficiency of 48 tourist hotels in the U.S. by Data Envelopment Analysis (DEA).
The input variables included the number of full-time employees, the number of rooms,
casino-related operation expenditure, and food expenditure and other expenditure, while the
output variables included total revenue. They found that the average efficiency of 48 hotels
was 42%. In other words, in order to maintain efficient output, 58% of expenditure can be
decreased.
Tsaur (2001) investigated 53 international tourist hotels in Taiwan in 1996-1998 by DEA
and found that the average efficiency of these hotels was 87.33%. Hwang and Chang (2003)
analyzed the efficiency of international tourist hotels in Taiwan and the change of efficiency
in 1994-1998 by DEA. Their analysis was based on relative efficiency in 1998 and change
of efficiency in 1994-1999 for 45 international tourist hotels. The study on the operational
efficiency and progress of international tourist hotels found that the operational efficiency of
international tourist hotels in Taiwan was significantly different according to types of market,
customer source, and managerial models. Barros (2004) studied the operational performance
of tourist hotels in Portugal and analyzed 43 tourist hotels in 2001 by DEA under 7 input
variables and 3 output variables. The mean of overall technical efficiency scores was 91%
and that of pure technical efficiency scores was 94.5%, indicating that most international
tourist hotels in Taiwan are efficient.
Yang and Lu (2006) studied the relative performances of 56 international tourist hotels in
Taiwan by DEA and found that the scale returns of most of the hotels were low, mainly due to
a severely competitive market. The relative efficiency of international tourist hotels located
in scenic areas was higher than those in cities. Moreover, the relative efficiency of
international tourist hotels located near international airports was lower than those far from
international airports. Through SFA, Chen (2007) probed the operational performance of 55
international tourist hotels in Taiwan in 2002 and included 3 input variables and total business
income as the output variable. The results showed that the average efficiency of
international tourist hotels was 80%. A comparison on the operational performances of
chain and non-chain tourist hotels indicated that the efficiency of chain hotels was higher than
ordinary independent international tourist hotels. Hu et al. (2010) simultaneously estimated
cost efficiency scores and factor cost inefficiency of 66 international tourist hotels in Taiwan
during 1997-2006 by one-stage SFA. They used 3 input variables, 3 output variables, and 5
environmental variables. The empirical results show that the average efficiency of
international tourist hotels in Taiwan reached 91.15%. Moreover, chain international tourist
hotels, guides, and distance from international airports showed significant influences on the
operational performance of international tourist hotels.
Because of different market positioning, international tourist hotels in Taiwan have
different customer sources. The studies on evaluating the performance in the hotel industry
use various input and output items. Input items include labor, capital, materials & energy,
number of employees, number of rooms, total square measure of food department, and
business expenditure, while output items include occupancy rate, food amount, total business
income, room income, food income, other income, return on investment before tax, average
actual room price received, average employee output of food department, international chain
hotels, distance from international airports, and construction of evaluation model on hotel
performance (Johnson & Ball,1989; Hwang & Chang, 2003; Hu et al., 2010). As Table 1
shows, most studies tend to evaluate hotel performance by the financial ratio or operational
data, and the findings are inconsistent. Moreover, there is a lack of studies on the number of
foreign guests in hotels. Thus, this study aims to focus on the nationalities of guests in
international tourist hotels and to probe into the influence of their nationalities on the overall
technical and cost efficiency of international tourist hotels in Taiwan. This study also
evaluates the operational efficiency of international tourist hotels by DEA, which analyzes
issues upon multiple inputs and output efficiency in order to explore the relatively inefficient
hotels and to serve as a reference for international tourist hotels.
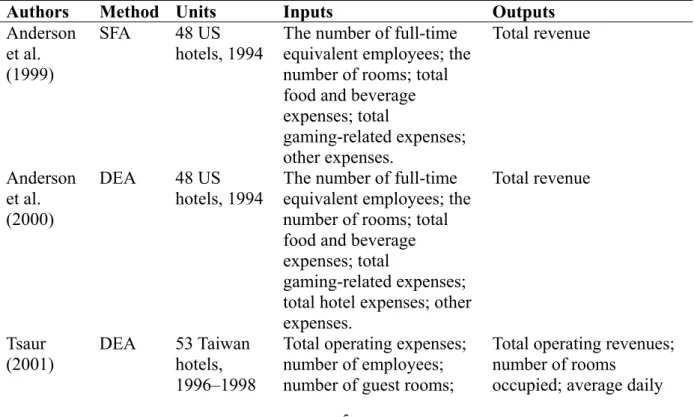
Table 1.
Literature of the hotel frontier efficiency
Authors Method
Units
Inputs
Outputs
Anderson
et al.
(1999)
SFA 48
US
hotels, 1994
The number of full-time
equivalent employees; the
number of rooms; total
food and beverage
expenses; total
gaming-related expenses;
other expenses.
Total revenue
Anderson
et al.
(2000)
DEA 48
US
hotels, 1994
The number of full-time
equivalent employees; the
number of rooms; total
food and beverage
expenses; total
gaming-related expenses;
total hotel expenses; other
expenses.
Total revenue
Tsaur
(2001)
DEA 53
hotels,
Taiwan
1996–1998
Total operating expenses;
number of employees;
number of guest rooms;
Total operating revenues;
number of rooms
total floor space of the
catering division; number
of employees in room
division; number of
employees in catering
division; catering cost.
rate; average production
value per employee in the
catering division; total
operating revenues of the
room division; total
operating revenues of the
catering division
Hwang
and
Chang
(2002)
DEA 45
Taiwan,
hotels,1998
number of employees;
number of guest rooms;
total floor space of the
catering division;
operational costs.
Room revenue; food and
beverages revenue; other
revenues
Hwang
and
Chang
(2003)
DEA 45
Taiwan
hotels,
1994–
1998
Number of full-time
employees; guest rooms;
total area of meal
department; operating
expenses.
Room revenue; food and
beverages revenue; other
revenues
Barros
(2004)
DEA 43
hotels,
Pousada,
2001
Full-time workers; cost of
labor; rooms; surface area
of the hotel; book value of
property; operational
costs; external costs.
Sales; number of guests;
nights spent.
Yang and
Lu (2006)
DEA 56
Taiwan,
hotels,
2002
Total operating expenses;
number of employees;
number of guest rooms;
total area of catering
division.
Total operating revenues;
average occupancy rate;
average room rate;
average production;
value per employee in the
catering division; average
production value of
catering division.
Chen
(2007)
SFA 55
Taiwan,
hotels,
2002
cost of labor;
total food and beverage
expenses; materials costs
Total revenue.
Hu et al.
(2009)
DEA 66
Taiwan,
hotels,
1997~2006
number of employees;
number of guest rooms;
total floor space of the
catering division.
Room revenue; food and
beverages revenue; other
revenues
Hu et al.
(2010)
SFA 66
hotels,
Taiwan,
1997~2006
number of employees;
number of guest rooms;
total floor space of the
catering division.
Room revenue; food and
beverages revenue;
other revenues
3. Methodology and Data
3.1 DEA-CCR Model and Input-oriented CCR Cost Efficiency Model
Data envelopment analysis (DEA) is a linear programming methodology to measure the
efficiency of multiple decision-making units (DMUs) using multiple inputs and outputs. This
methodology constructs the frontier in the same period. This paper defines the DMU as an
international tourist hotel.
We choose to use the input-oriented method among DEA’s various models. A more
commonly spoken language is described as follows: “By how much can input quantities be
proportionally reduced without changing the output quantities produced?”
Assume that there are K inputs, L inputs price, and M outputs for each DMU (
×N) . The
following is the linear program for DEA-CCR Mode:
Min
θ,λθ
s.t. -q
i+ Qλ
≥0
θx
i- Xλ
≥0
λ
≥0 (1)
Following is the liner program for Input-oriented CCR Cost Efficiency Model:
* i
Min
λ,x
w
’ ix
i*s.t. -q
i+ Qλ
≥ 0
x
i*-
Xλ
≥ 0
λ
≥ 0 (2)
where q
iis a M
×1 vector of output for the i-th DMU and x
iis a K
×1 vector of input for the
i-th DMU; Q is a M
×N output matrix; and X is a K×N input matrix; λ is a N×1 vector of
constants representing the weight of each DMU; w
iis a vector of input prices for the i-th
DMU and x
i* is the cost- minimizing vector of input quantities for the i-th DMU, given that
the input prices w
iand the output levels q
i. The cost efficiency (CE) of the i-th DMU can be
calculated from:
CE = w
’ixi*/ w
’ixi (3)
efficient DMU.
3.2 Tobit analysis
Some environmental variables may affect the DMUs’ efficiency. Therefore, whether
these environment variables will actually have influence on the efficiency among the DMUs
plays a very important role on this study.
Tobit censored regression analysis is related a good tool to investigate whether these
environment variables: Natives, overseas Chinese, North America, Japan, Asia, European and
Australia tourists have an effect on the efficiency scores. We can express the equation as
following:
Ineff
i=α + Z
iβ + u
i
if α+Z
iβ+u
i>
0 (4)
= 0 if α+Z
iβ+u
i≤0
i=1,2,…,N
where N is the number of DMUs; Ineff
ipresents cost inefficiency scores in this study; Z
iis
the vector of dependent variables as called environment variables; β is a vector of unknown
parameters that we want to estimate; and u
iis the error term following a normal distribution
with zero mean and constant variance.
3.3 Data Sources and Variable Definitions
This study uses unbalanced panel data from the period 1996 to 2007. We collect all
tourism variables from the annual Operating Report of International Tourist Hotels in Taiwan
published by the Taiwan Tourism Bureau. We choose all the international tourist hotels
with complete data in the report for each year. The numbers of observations from 1996 to
2007 are as follows: 1996 (49 DMUs), 1997 (51 DMUs), 1998 (52 DMUs), 1999 (54
DMUs), 2000 (54 DMUs), 2001 (54 DMUs), 2002 (55 DMUs), 2003 (57 DMUs), 2004 (57
DMUs), 2005 (56 DMUs), 2006 (57 DMUs), and 2007 (56 DMUs), making 652 observations
in total.
Output variables:
Total revenues of food and beverages (y
1), including incomes from sale of food,
snacks, alcohol, beverages in dining room, coffee room, banquet, and night club (tips are not
included), measured in units of thousand NT$ dollars.
Total revenues of rooms (y
2), including incomes from lease of rooms (tips are not
Other revenues (y
3), including incomes other than the two items mentioned above.
They include operating revenues from lease of store spaces, laundry, swimming pool, ball
courts, barber-shop, beauty salons and bookstores, measured in units of thousand NT$
dollars.
Inputs variables:
Number of guest rooms (x
1), including the amount of guest rooms that can be
provided for tourists by an international tourist hotel. Accordingly, the unit of measurement
is simply "rooms", without subsequent adjustment being made for size or quality.
Number of employees (x
2), including total employees who are involved in the
operation of international tourist hotels, including medium- and high-ranking executives,
guest room and catering staff, cooks, maintenance crews, and repairmen.
Total floor space of catering division (x
3), including the total floor space used by the
operational units of all hotels’ catering facilities, measured in square feet.
Input prices:
Average price of room operations (w
1), referring to the total operating expenses per
room, measured in NT$ dollars/room. We use the total revenue of a hotel divided by the
number of rooms.
Average employee annual wage (w
2), referring to the salary and related expenses
per employee, measured in NT$ dollars/individual.
Average price of F&B (food and beverages) operations (w
3), referring to the
catering department expenses per square meter of floor space, measured in NT$
dollars/square meter.
Environmental variables:
Check-in number of Tourists by nationally: The numbers of native, overseas
Chinese, North American, Japanese, Asian, European and Australian tourists.
Hotel locations: Hotels located in Taipei, Kaohsiung, Tai-Chung, Hua-lien and
scenic.
Chain: “0” represents independent managements and “1” represents the hotels
joining an international chain type
Distance to airport: “0” represent the distance between hotels to the nearest
Taiwan international airport being less than 70km and “1” means farther than 70km
Year: 1996 is year 1 and 1997 is year 2, and so on.
.
GDP deflators. The unit of outputs and inputs price is NT dollar. Descriptive statistics of the
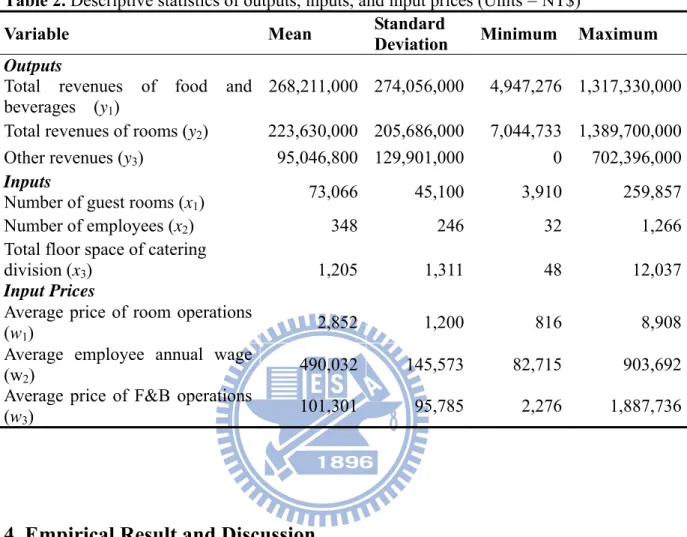
variables are summarized in Table 2.
Table 2. Descriptive statistics of outputs, inputs, and input prices (Units = NT$)
Variable Mean
Standard
Deviation
Minimum Maximum
Outputs
Total revenues of food and
beverages (y
1)
268,211,000 274,056,000 4,947,276 1,317,330,000
Total revenues of rooms (y
2)
223,630,000 205,686,000 7,044,733 1,389,700,000
Other revenues (y
3) 95,046,800
129,901,000
0
702,396,000
Inputs
Number of guest rooms (x
1)
73,066 45,100 3,910 259,857
Number of employees (x
2) 348
246
32
1,266
Total floor space of catering
division (x
3)
Input Prices
1,205 1,311 48 12,037
Average price of room operations
(w
1)
2,852 1,200 816 8,908
Average employee annual wage
(w
2)
490,032 145,573 82,715 903,692
Average price of F&B operations
(w
3)
101,301 95,785 2,276 1,887,736
4. Empirical Result and Discussion
4.1 Descriptive Statistics
Table 2 provides descriptive statistics for all variables in the model. The average value
of the total revenues of food and beverages (y
1) is NT$268,211,000, total revenues of room
revenue (y
2) are NT$223,630,000 and other revenues (y
3) are NT$95,046,800 during the past
ten years 1996-2007. Standard deviations of outputs are quite large due to different sizes of
these international tourist hotels.
4.2 Cost Efficiencies
By using the Deap 2.1 software kindly provided by Professor Tim Coelli, we compute the
cost efficiency scores of each DMU from 1996 to 2007. Figure 3 is the trend chart from the
average value of each year.
From the operating report, we find some hotels were closed and some hotels were opened
in some years or during some time periods. For example, DMU 33 located in Tai-Chung,
which has no data after 2004 and its technical efficiency and cost efficiency are the poorest
among all DMUs. The total slack to this hotel in 1996 is: guest rooms could be reduced
from 18,193 to 4,593 for a 74.8% reduction, employees could be reduced from 90 to 25 for a
72% reduction, and total floor space of the catering division could be reduced from 140 to 26
for a 81.2% reduction. Nevertheless, we suggest managers to not just use these numbers as
their simple strategy but to conduct a deeper study on how to improve the efficiency.
Complete cost efficiency, overall technical efficiency and allocation efficiency scores
tables (total 12 tables per year) during 1996 ~ 2007 are in Appendix 1. Also refer Appendix
4 for the plot and formula how to get OTE, TE and AE. In this study, we find out the top 10
best cost efficiency Taiwan hotels each year, record their scores and label them in top 10
ranking numbers. See Appendix 2 for the complete table and see Table 3 for the brief one. 7
of 10 are located in Taipei (DMU#2, 19, 21, 22, 23, 24 and 25). 2 of 10 are located in scenic
area (DMU#47 and 51) and one is located in Tai-Nan (DMU#53). Table 3 shows, Taiwan
hotels in metropolis, especially in Taipei that is Taiwan’s capital, play very important role in
whole Taiwan ITHs. The Tobit regression analysis also supports this finding.
Table 3. Top 10 best Cost efficiency Taiwan ITH during 1996 ~ 2007
DMU#
Taiwan ITH Name
CE Ranking
22
Grand Formosa Regent Taipei
1
21
Grand Hyatt Taipei
2
24
Far Eastern Plaza Hotel Taipei
3
23
The Sherwood Hotel Taipei
4
19
Howard Plaza Hotel
5
25
The Westin Hotel (since 1999.10)
6
47
Hotel Royal Chihpen Spa
7
51
The Lalu Sun Moon Lake (since 2002.2)
8
2
The Ambassador Hotel
9
53 Hotel
Tainan
10
4.3 Trends of Technical, Allocation and Cost Efficiencies
From below trend chart, we found from 2002 to 2005, cost efficiency slowly
downgrades. Later, this study will provide more explanation after Tobit regression’s findings
when we add an environmental variable that is “year” and find the cost efficiency become
lower year by year during our study years (1996 ~ 2007). The Japanese tourist numbers
significantly fall down in 2003 due to SARS issue while native tourists increased in the same
year. Even though, the increase in native tourists also still cannot pull up the ITH cost
efficiency(Also see Figure 2, changes in year 2003).
0.721
0.596
0.818
0.741
0.756
0.747
0.745
0.720
0.732
0.743
0.753
0.752
0.748
0.752
0.610
0.613
0.611
0.627
0.637
0.630
0.633
0.648
0.656
0.629
0.628
0.817
0.811
0.811
0.835
0.882
0.854
0.854
0.857
0.867
0.831
0.829
0.50
0.55
0.60
0.65
0.70
0.75
0.80
0.85
0.90
0.95
1996
1997
1998
1999
2000
2001
2002
2003
2004
2005
2006
2007
OTE
CE
AE
Figure 3. Trends of international Tourist Hotel Efficiency Score in Taiwan (1996-2007)
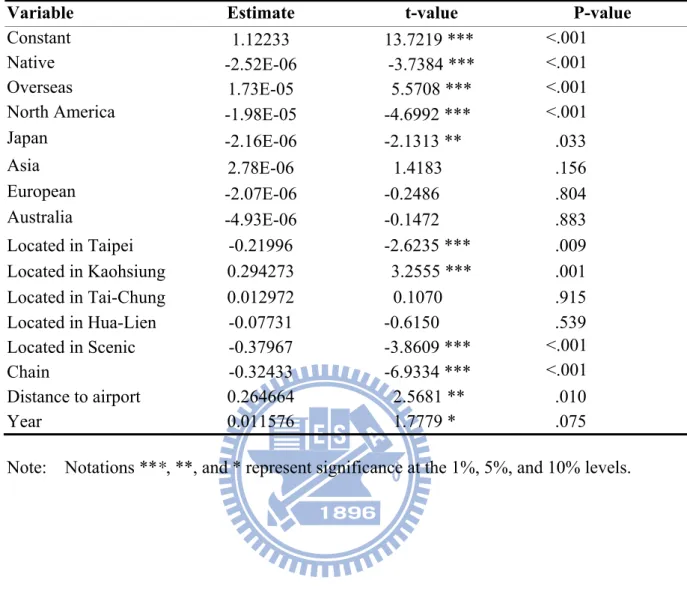
We convert the cost efficiency into cost inefficiency as cost inefficiency = 1/(cost
efficiency) – 1. Table3 lists the Tobit regression results on cost inefficiency and shows that
numbers of natives, North American, Japanese, and Australian tourists will increase cost
efficiency of ITHs in Taiwan. The numbers of overseas Chinese and European tourists will
decrease cost efficiency. The number of Asian tourists has no significant effects on cost
efficiency. Since May 2008, the government in Taiwan has emphasized attracting Mainland
Chinese tourists in order to promote international hotels, but there is no significant result so
far to support this hypothesis. The chain store system significantly increases the ITHs’ cost
efficiency. Shorter distances from hotel to the international airport will increase cost
efficiency. Moreover, the ITHs’ cost efficiency gradually went down from 1996 to 2007.
Note that the numbers of natives and Japanese tourists significantly improved the
efficiency. The Japanese tourist numbers significantly fell in 2003 due to SARS. However,
native tourists increased in the same year. The increase in native tourists alone still cannot
pull up the ITHs’ cost efficiency.
Moreover, this study labels the hotels locations for Taipei, Kaohsiung, Taichung, Hualien
and scenic and discover hotels in Taipei and scenic are good for cost efficiency; hotels in
Kaohsiung are poor to cost efficiency. Taichung and Hualien hotels have no concern to cost
efficiency
Table 4. Results of Tobit Regression on Cost Inefficiency
Variable Estimate
t-value
P-value
Constant
1.12233 13.7219
***
<.001
Native
-2.52E-06 -3.7384
***
<.001
Overseas
1.73E-05 5.5708
***
<.001
North America
-1.98E-05 -4.6992
***
<.001
Japan
-2.16E-06
-2.1313 **
.033
Asia
2.78E-06 1.4183 .156
European
-2.07E-06 -0.2486
.804
Australia
-4.93E-06 -0.1472
.883
Located in Taipei
-0.21996
-2.6235 ***
.009
Located in Kaohsiung
0.294273
3.2555 ***
.001
Located in Tai-Chung
0.012972
0.1070
.915
Located in Hua-Lien
-0.07731
-0.6150
.539
Located in Scenic
-0.37967
-3.8609 ***
<.001
Chain -0.32433
-6.9334
***
<.001
Distance to airport
0.264664
2.5681 **
.010
Year 0.011576
1.7779
*
.075
Note: Notations ***, **, and * represent significance at the 1%, 5%, and 10% levels.
5. Concluding Remarks
The major findings of this paper are as follows: During 1996 to 2007 the numbers of
overseas Chinese tourists significantly worsened cost efficiency, while the numbers of native,
North American and Japanese tourists have significantly improve cost efficiency. With
regard to Asian, European and Australian tourists, there are no relationships with cost
efficiencies. The chain system and a shorter distance to the nearest international airport will
both improve cost efficiency. The ITHs in Taiwan have becomes more cost-inefficient
during 1996 to 2007.
Due to the showdowns and recessions in Taiwan’s economic development over the past
ten years, cost efficiency has become a major concern for these international tourist hotels to
sustain their operations. This study finds significantly positive effects on cost efficiency by
increasing tourists from Taiwan, North America, Japan, and Australia. Therefore, the
service design and marketing strategies can be targeted at tourists from these sources in order
to promote a Taiwan ITHs’ cost efficiency. Moreover, the chain system significantly
improves cost efficiency. Small and medium-sized ITHs can hence earn network effects,
marketing benefits, joint promotion, quality management, and brand values by joining chain
systems.
The 2010 Taipei International Flora Exposition will be held from Novenmber 2010 to
April 2011. This will definitely attract plenty of Japan tourists to visit Taipei. As for
native tourists, more of them will increase ITHs’ cost efficiency. This is also necessary for a
Taiwan ITHs due to the average of occupancy rate is not always 100%. Joining a worldwide
chain system will increase an ITH’s exposure to global tourists. Future study may do more
accurate analysis on Chinese tourists after new panel data are published with separated China
tourist numbers.
Moreover, this study discovers hotels in Taipei and scenic are good for cost efficiency;
hotels in Kaohsiung are poor in cost efficiency. Taichung and Hualien hotels have no concern
to cost efficiency. Before year 2000, government really puts main resources in North Taiwan
(Taipei) and ignores south Taiwan. This paper also supports such a proposition.
.
The last environmental variable is year. The result tells us a warning message that from
1996 to 2007 the overall cost efficiency gradual decline. This is a serious phenomenon to all
Taiwan hotel CEOs and high-level government officers.
References
Anderson, R. I., Fish, M., Xia, Y., and Mixhello, F. (1999a). Measuring efficiency in the hotel
industry: a stochastic approach. International Journal of Hospitality Management 18,
45–57.
Anderson, R. I., D, Lewis, D., and Parker, M.E. (1999b). Another look at the efficiency of
corporate travel management departments. Journal of Travel Research 37, 267–272.
Anderson, R. I., Scott, J. and Fok, R. (2000), Hotel industry efficiency: An advanced linear
programming examination. American Business Review, 18, 40-48.
Barros, C. P. (2004), A stochastic cost frontier in the Portuguese hotel industry. Tourism
Economics, 10, 177–192.
Chen, C. F. (2007), Applying the stochastic frontier approach to measure hotel managerial
efficiency in Taiwan. Tourism Management, 28, 696–702.
Coelli, T. (1996), A Guide to FRONTIER Version 4.1: A Computer Program for Stochastic
Frontier Production and Cost Function Estimation, CEPA Working Paper 96/7,
Department of Econometrics, University of New England, Armidale NSW Australia
.
Greenburg, C. (1986). Analyzing restaurant performance: Relating cost and volume to profit.
Cornell Hotel and Restaurant Administration Quarterly, 27, 9-11.
Hwang, S. N., and Chang, T. Y. (2003), Using data envelopment analysis to measure hotel
managerial efficiency change in Taiwan. Tourism Management, 24, 357-369.
Hu, J. L., Chiu, C. N., Shieh, H. S., and Huang, C.H. (2010), A stochastic cost efficiency
analysis of international tourist hotels in Taiwan. International Journal of Hospitality
Management, 29, 99-107.
Hu, J. L., Shieh, H. S., Huang, C.H., and Chiu, C. N. (2009), Cost efficiency of international
tourist hotels in Taiwan: A data envelopment analysis application. Asia Pacific Journal of
Tourism Research, 14, 371-384.
Johnson, K., and Ball, S. (1989), Productivity Measurement in Hotels. Tourism Marketing
and Management Handbook, Englewood (NJ): Prentice - Hall, 319-323.
Tourism Bureau of Taiwan (2010), Website: http://admin.taiwan.net.tw
Tsaur, S. H. (2001), The operating efficiency of international tourist hotels in Taiwan. Asia
Pacific Journal of Tourism Research, 6, 73–81.
UNWTO (2008). Website: http://www.unwto.org/index.php.
World Tourism Organization (UNWTO) (2008), Retrieved October 26, 2008, from
http://www.worldtourism.org
Yang, C., and Lu, W. M. (2006), Performance benchmarking for Taiwan’s international
tourist hotels. Information Systems and Operational Research, 44, 229–245.
Appendix 1
OTE, AE, CE scores during 1996~2007
Year 1996
ITH Name DMU# OTE AE CE ITH Name DMU# OTE AE CE
The Grand Hotel 1 0.836 0.547 0.458 The Ambassador Hotel Kaohsiung
28 0.644 0.859 0.553 The Ambassador Hotel 2 0.905 0.912 0.825 Han-Hsien international Hotel 29 0.568 0.873 0.496 Mandarina Crown Hotel 3 0.587 0.876 0.514 Grand Hi-Lai Hotel 30 0.908 0.745 0.676
Imperial Taipei 4 0.384 0.813 0.312 Park Hotel 33 0.277 0.920 0.255
Gloria Prince Hotel 5 0.663 0.948 0.628 Hotel National 34 0.621 0.718 0.446
Emperor Hotel 6 1.000 0.560 0.560 Plaza International Hotel 35 1.000 1.000 1.000
Hotel Riverview Taipei 7 0.626 0.731 0.457 Evergreen Laurel Hotel 36 0.752 0.906 0.681 Caesar Park Taipei 8 0.838 0.817 0.685 Howard Plaza Hotel Taichung 37 1.000 0.626 0.626
Golden China Hotel 9 0.683 0.798 0.544 Marshal Hotel 40 0.415 0.868 0.360
Brother Hotel 11 0.882 0.908 0.801 Chinatrust Hotel Hualien 41 0.726 0.736 0.535
Santos Hotel 12 0.635 0.707 0.449 Parkview Hotel 42 0.657 0.835 0.549
The Ritz Landis Hotel 13 0.768 0.912 0.700 Hotel Landis China Yangmingshan
44 0.779 0.815 0.635
United Hotel 14 1.000 0.710 0.710 The Grand Hotel Kaohsiung 45 0.684 0.794 0.543
Sheraton Taipei Hotel 15 0.990 0.843 0.835 Caesar Park Hotel Kending 46 1.000 0.916 0.916 Taipei Fortuna Hotel 16 0.487 0.837 0.408 Hotel Royal Chihpen Spa 47 0.899 0.970 0.872 Holiday Inn Asiaworld Taipei 17 0.887 0.894 0.793 Taoyuan Holiday Hotel 52 0.745 0.599 0.446
Hotel Royal Taipei 18 0.855 0.879 0.752 Hotel Tainan 53 1.000 0.729 0.729
Howard Plaza Hotel 19 1.000 1.000 1.000 Ta Shee Resort Hotel 54 1.000 0.999 0.999 Rebar Crowne Plaza Taipei 20 0.728 0.998 0.727 Jen Dow International Hotel 59 0.419 0.793 0.332
Grand Hyatt Taipei 21 1.000 0.989 0.989 Plaza Hotel 60 0.582 0.469 0.273
Grand Formosa Regent Taipei 22 1.000 1.000 1.000 Le Midi Hotel Chitou 61 0.829 0.918 0.761 The Sherwood Hotel Taipei 23 1.000 1.000 1.000 Miramar Garden Taipei 63 0.614 0.797 0.490 Far Eastern Plaza Hotel Taipei 24 0.973 0.894 0.870 Chinatrust Hotel Sun Moon
Lake
64 0.603 0.814 0.491
Hotel Kingdom 26 0.474 0.758 0.360 Ming-Ren Hotel 65 0.351 0.825 0.290
Year 1997
ITH Name DMU# OTE AE CE ITH Name DMU# OTE AE CE
The Grand Hotel 1 0.671 0.758 0.509 The Ambassador Hotel Kaohsiung
28 0.657 0.860 0.565
The Ambassador Hotel 2 0.974 0.847 0.825 Han-Hsien international Hotel 29 0.634 0.826 0.524 Mandarina Crown Hotel 3 0.551 0.904 0.498 Grand Hi-Lai Hotel 30 0.921 0.713 0.657 Imperial Taipei 4 0.475 0.560 0.266 Howard Plaza Hotel Kaohsiung 31 1.000 0.598 0.598
Gloria Prince Hotel 5 0.690 0.960 0.662 Park Hotel 33 0.297 0.899 0.267
Emperor Hotel 6 0.909 0.597 0.542 Hotel National 34 0.563 0.856 0.482
Hotel Riverview Taipei 7 0.543 0.761 0.413 Plaza International Hotel 35 0.467 0.917 0.428 Caesar Park Taipei 8 0.734 0.848 0.622 Evergreen Laurel Hotel 36 0.678 0.849 0.576 Golden China Hotel 9 0.540 0.900 0.486 Howard Plaza Hotel Taichung 37 0.833 0.781 0.651
San Want Hotel 10 0.801 0.947 0.758 Marshal Hotel 40 0.490 0.787 0.385
Brother Hotel 11 0.816 0.914 0.746 Chinatrust Hotel Hualien 41 0.628 0.828 0.520
Santos Hotel 12 0.661 0.772 0.511 Parkview Hotel 42 0.825 0.764 0.631
The Ritz Landis Hotel 13 0.780 0.896 0.699 Hotel Landis China
Yangmingshan 44 0.778 0.891 0.693
United Hotel 14 0.942 0.712 0.671 The Grand Hotel Kaohsiung 45 0.730 0.710 0.519 Sheraton Taipei Hotel 15 0.962 0.843 0.811 Caesar Park Hotel Kending 46 1.000 0.917 0.917 Taipei Fortuna Hotel 16 0.563 0.745 0.419 Hotel Royal Chihpen Spa 47 1.000 0.971 0.971 Holiday Inn Asiaworld Taipei 17 1.000 1.000 1.000 Grand Formosa Hotel 48 0.736 0.816 0.601 Hotel Royal Taipei 18 0.832 0.913 0.760 Taoyuan Holiday Hotel 52 0.665 0.626 0.416
Howard Plaza Hotel 19 1.000 1.000 1.000 Hotel Tainan 53 1.000 0.768 0.768
Rebar Crowne Plaza Taipei 20 0.748 0.969 0.725 Ta Shee Resort Hotel 54 1.000 0.949 0.949 Grand Hyatt Taipei 21 1.000 1.000 1.000 Jen Dow International Hotel 59 0.438 0.708 0.310 Grand Formosa Regent Taipei 22 1.000 0.981 0.981 Le Midi Hotel Chitou 61 0.875 0.907 0.794 The Sherwood Hotel Taipei 23 1.000 1.000 1.000 Miramar Garden Taipei 63 0.617 0.803 0.496 Far Eastern Plaza Hotel Taipei 24 1.000 0.874 0.874 Chinatrust Hotel Sun Moon
Lake
64 0.696 0.713 0.496
Hotel Kingdom 26 0.466 0.684 0.319 Ming-Ren Hotel 65 0.484 0.740 0.358
Year 1998
ITH Name DMU# OTE AE CE ITH Name DMU# OTE AE CE
The Grand Hotel 1 0.726 0.835 0.606 The Ambassador Hotel Kaohsiung
28 0.598 0.902 0.539 The Ambassador Hotel 2 0.927 0.903 0.838 Han-Hsien international Hotel 29 0.630 0.929 0.585 Mandarina Crown Hotel 3 0.568 0.889 0.505 Grand Hi-Lai Hotel 30 0.952 0.662 0.631 Imperial Taipei 4 1.000 0.958 0.958 Howard Plaza Hotel Kaohsiung 31 0.750 0.762 0.571
Gloria Prince Hotel 5 0.660 0.905 0.597 Park Hotel 33 0.337 0.869 0.293
Emperor Hotel 6 0.859 0.628 0.539 Hotel National 34 0.587 0.897 0.526
Hotel Riverview Taipei 7 0.588 0.730 0.429 Plaza International Hotel 35 0.494 0.962 0.476 Caesar Park Taipei 8 0.715 0.914 0.654 Evergreen Laurel Hotel 36 0.626 0.894 0.560 Golden China Hotel 9 0.562 0.918 0.516 Howard Plaza Hotel Taichung 37 0.866 0.831 0.720
San Want Hotel 10 0.978 0.898 0.879 Marshal Hotel 40 0.445 0.795 0.354
Brother Hotel 11 1.000 0.834 0.834 Chinatrust Hotel Hualien 41 0.551 0.894 0.493
Santos Hotel 12 0.636 0.903 0.574 Parkview Hotel 42 0.740 0.911 0.674
The Ritz Landis Hotel 13 0.783 0.819 0.641 Hotel Landis China
Yangmingshan 44 0.691 0.827 0.572
United Hotel 14 0.580 0.738 0.428 The Grand Hotel Kaohsiung 45 0.695 0.703 0.489
Sheraton Taipei Hotel 15 0.928 0.939 0.871 Caesar Park Hotel Kending 46 0.882 0.968 0.854 Taipei Fortuna Hotel 16 0.380 0.926 0.352 Hotel Royal Chihpen Spa 47 1.000 1.000 1.000 Holiday Inn Asiaworld Taipei 17 1.000 1.000 1.000 Grand Formosa Hotel 48 0.743 0.917 0.681 Hotel Royal Taipei 18 0.799 0.908 0.726 Howard Beach Resort Kending 49 1.000 0.704 0.704 Howard Plaza Hotel 19 1.000 1.000 1.000 Taoyuan Holiday Hotel 52 0.586 0.701 0.411 Rebar Crowne Plaza Taipei 20 0.819 0.932 0.763 Hotel Tainan 53 0.900 0.775 0.698 Grand Hyatt Taipei 21 1.000 1.000 1.000 Ta Shee Resort Hotel 54 0.916 0.921 0.844 Grand Formosa Regent Taipei 22 1.000 0.973 0.973 Jen Dow International Hotel 59 0.416 0.867 0.361
The Sherwood Hotel Taipei 23 1.000 1.000 1.000 Plaza Hotel 60 1.000 0.734 0.734
Far Eastern Plaza Hotel Taipei 24 1.000 0.965 0.965 Le Midi Hotel Chitou 61 0.952 0.941 0.896
Hotel Kingdom 26 0.451 0.728 0.328 Miramar Garden Taipei 63 0.621 0.825 0.512
Holiday Garden Kaohsiung 27 0.453 0.849 0.385 Chinatrust Hotel Sun Moon Lake
Year 1999
ITH Name DMU# OTE AE CE ITH Name DMU# OTE AE CE
The Grand Hotel 1 0.902 0.840 0.758 Han-Hsien international Hotel
29 0.635 0.913 0.580
The Ambassador Hotel 2 0.994 0.887 0.882 Grand Hi-Lai Hotel 30 0.855 0.777 0.664
Mandarina Crown Hotel 3 0.667 0.794 0.529 Howard Plaza Hotel Kaohsiung
31 0.642 0.851 0.547
Imperial Taipei 4 0.686 0.936 0.642 Park Hotel 33 0.434 0.752 0.327
Gloria Prince Hotel 5 0.713 0.870 0.620 Hotel National 34 0.650 0.860 0.559
Emperor Hotel 6 1.000 0.535 0.535 Plaza International Hotel 35 0.558 0.926 0.516
Hotel Riverview Taipei 7 0.619 0.773 0.478 Evergreen Laurel Hotel 36 0.678 0.865 0.586 Caesar Park Taipei 8 0.734 0.913 0.670 Howard Plaza Hotel
Taichung
37 0.722 0.825 0.595 Golden China Hotel 9 0.657 0.875 0.575 The Splendor Taichung 38 0.788 0.700 0.552
San Want Hotel 62 0.932 0.890 0.829 Marshal Hotel 40 0.459 0.862 0.396
Brother Hotel 11 1.000 0.893 0.893 Chinatrust Hotel Hualien 41 0.527 0.873 0.460
Santos Hotel 12 0.597 0.944 0.564 Parkview Hotel 42 0.657 0.847 0.556
The Ritz Landis Hotel 13 0.793 0.883 0.700 Hotel Landis China Yangmingshan
44 0.681 0.851 0.580
United Hotel 14 0.695 0.790 0.549 The Grand Hotel Kaohsiung 45 0.975 0.610 0.595
Sheraton Taipei Hotel 15 1.000 0.889 0.889 Caesar Park Hotel Kending 46 0.853 0.943 0.804 Taipei Fortuna Hotel 16 0.396 0.888 0.352 Hotel Royal Chihpen Spa 47 1.000 0.978 0.978 Holiday Inn Asiaworld Taipei 17 1.000 1.000 1.000 Grand Formosa Hotel 48 0.764 0.966 0.738 Hotel Royal Taipei 18 0.775 0.873 0.676 Howard Beach Resort
Kending
49 1.000 0.752 0.752 Howard Plaza Hotel 19 1.000 1.000 1.000 Taoyuan Holiday Hotel 52 0.471 0.806 0.379 Rebar Crowne Plaza Taipei 20 0.823 0.884 0.727 Hotel Tainan 53 0.882 0.856 0.755 Grand Hyatt Taipei 21 1.000 1.000 1.000 Ta Shee Resort Hotel 54 1.000 0.922 0.922 Grand Formosa Regent Taipei 22 1.000 1.000 1.000 Hotel Royal Hsinchu 55 0.611 0.788 0.482 The Sherwood Hotel Taipei 23 1.000 1.000 1.000 Jen Dow International Hotel 59 0.376 0.794 0.298 Far Eastern Plaza Hotel Taipei 24 1.000 0.903 0.903 Plaza Hotel 60 0.683 0.553 0.378
Hotel Kingdom 26 0.369 0.850 0.313 Le Midi Hotel Chitou 61 0.958 0.841 0.805
Holiday Garden Kaohsiung 27 0.530 0.806 0.427 Miramar Garden Taipei 63 0.529 0.891 0.471 The Ambassador Hotel Kaohsiung 28 0.751 0.877 0.659 Chinatrust Hotel Sun Moon
Year 2000
ITH Name DMU# OTE AE CE ITH Name DMU# OTE AE CE
The Grand Hotel 1 0.753 0.845 0.636 The Ambassador Hotel Kaohsiung
28 0.642 0.936 0.601 The Ambassador Hotel 2 0.793 0.959 0.760 Han-Hsien international Hotel 29 0.479 0.976 0.468 Mandarina Crown Hotel 3 1.000 0.665 0.665 Grand Hi-Lai Hotel 30 0.683 0.872 0.596 Imperial Taipei 4 0.733 0.893 0.654 Howard Plaza Hotel Kaohsiung 31 0.524 0.900 0.471 Gloria Prince Hotel 5 0.562 0.916 0.515 The Splendor Kaohsiung 32 0.730 0.780 0.569
Emperor Hotel 6 1.000 0.535 0.535 Park Hotel 33 0.278 0.789 0.219
Hotel Riverview Taipei 7 0.614 0.691 0.425 Hotel National 34 0.562 0.874 0.491
Caesar Park Taipei 8 0.648 0.954 0.618 Plaza International Hotel 35 0.488 0.857 0.418 Golden China Hotel 9 0.642 0.806 0.517 Evergreen Laurel Hotel 36 0.664 0.837 0.555 San Want Hotel 10 0.907 0.881 0.799 Howard Plaza Hotel Taichung 37 0.671 0.844 0.566 Brother Hotel 11 0.915 0.916 0.837 The Splendor Taichung 38 0.972 0.807 0.785
Santos Hotel 12 0.673 0.838 0.564 Marshal Hotel 40 0.466 0.899 0.419
The Ritz Landis Hotel 13 0.808 0.883 0.714 Chinatrust Hotel Hualien 41 0.534 0.873 0.465
United Hotel 14 0.938 0.681 0.639 Parkview Hotel 42 0.594 0.853 0.507
Sheraton Taipei Hotel 15 0.878 0.830 0.729 Hotel Landis China Yangmingshan
44 0.721 0.915 0.660 Taipei Fortuna Hotel 16 0.429 0.824 0.353 The Grand Hotel Kaohsiung 45 0.875 0.685 0.600 Holiday Inn Asiaworld
Taipei 17 1.000 0.817 0.817 Caesar Park Hotel Kending 46 0.827 0.926 0.766
Hotel Royal Taipei 18 0.754 0.905 0.683 Hotel Royal Chihpen Spa 47 1.000 0.930 0.930
Howard Plaza Hotel 19 1.000 1.000 1.000 天祥晶華渡假酒店 48 0.655 0.822 0.538
Rebar Crowne Plaza Taipei 20 0.797 0.899 0.717 墾丁 Howard Plaza Hotel 49 1.000 0.761 0.761 Grand Hyatt Taipei 21 1.000 1.000 1.000 Taoyuan Holiday Hotel 52 0.546 0.689 0.376 Grand Formosa Regent
Taipei
22 1.000 1.000 1.000 Hotel Tainan 53 0.965 0.897 0.866
The Sherwood Hotel Taipei 23 1.000 0.994 0.994 Ta Shee Resort Hotel 54 0.782 0.950 0.743 Far Eastern Plaza Hotel
Taipei 24 1.000 0.893 0.893 Hotel Royal Hsinchu 55 0.644 0.921 0.593
The Westin Hotel 25 1.000 0.845 0.845 Jen Dow International Hotel 59 0.352 0.811 0.286
Hotel Kingdom 26 0.359 0.960 0.344 Plaza Hotel 60 1.000 0.655 0.655
Year 2001
ITH Name DMU# OTE AE CE ITH Name DMU# OTE AE CE
The Grand Hotel 1 0.652 0.917 0.598 Han-Hsien international Hotel
29 0.545 0.867 0.473
The Ambassador Hotel 2 0.893 0.903 0.806 Grand Hi-Lai Hotel 30 0.609 0.891 0.542
Mandarina Crown Hotel 3 1.000 1.000 1.000 Howard Plaza Hotel Kaohsiung
31 0.558 0.826 0.460
Imperial Taipei 4 0.790 0.850 0.671 The Splendor Kaohsiung 32 0.565 0.854 0.483
Gloria Prince Hotel 5 0.547 0.960 0.525 Park Hotel 33 0.298 0.788 0.235
Emperor Hotel 6 0.849 0.597 0.507 Hotel National 34 0.560 0.849 0.475
Hotel Riverview Taipei 7 0.649 0.626 0.406 Plaza International Hotel 35 0.471 0.822 0.387 Caesar Park Taipei 8 0.626 0.940 0.589 Evergreen Laurel Hotel 36 0.818 0.733 0.599 Golden China Hotel 9 0.659 0.773 0.510 Howard Plaza Hotel
Taichung
37 0.607 0.863 0.524
Brother Hotel 11 0.855 0.897 0.767 The Splendor Taichung 38 1.000 1.000 1.000
Santos Hotel 12 0.696 0.792 0.552 Marshal Hotel 40 0.406 0.835 0.339
The Ritz Landis Hotel 13 0.828 0.883 0.731 Chinatrust Hotel Hualien 41 0.750 0.780 0.585
United Hotel 14 0.847 0.728 0.617 Parkview Hotel 42 0.715 0.828 0.593
Sheraton Taipei Hotel 15 0.838 0.937 0.786 Hotel Landis China Yangmingshan
44 0.714 0.905 0.647 Taipei Fortuna Hotel 16 0.478 0.780 0.373 The Grand Hotel Kaohsiung 45 0.580 0.921 0.534 Holiday Inn Asiaworld Taipei 17 1.000 0.817 0.817 Caesar Park Hotel Kending 46 0.918 0.824 0.757 Hotel Royal Taipei 18 0.809 0.901 0.729 Hotel Royal Chihpen Spa 47 1.000 0.882 0.882 Howard Plaza Hotel 19 1.000 0.943 0.943 Grand Formosa Hotel 48 0.763 0.900 0.687 Rebar Crowne Plaza Taipei 20 0.733 0.840 0.616 Howard Beach Resort
Kending
49 1.000 0.724 0.724
Grand Hyatt Taipei 21 1.000 1.000 1.000 The Hibiscus Resorts 50 0.418 0.893 0.373
Grand Formosa Regent Taipei 22 1.000 1.000 1.000 Taoyuan Holiday Hotel 52 0.575 0.656 0.377 The Sherwood Hotel Taipei 23 1.000 0.930 0.930 Hotel Tainan 53 0.918 0.993 0.912 Far Eastern Plaza Hotel Taipei 24 0.989 0.958 0.948 Ta Shee Resort Hotel 54 0.657 0.948 0.623
The Westin Hotel 25 1.000 1.000 1.000 Hotel Royal Hsinchu 55 0.658 0.937 0.617
Hotel Kingdom 26 0.370 0.912 0.337 The Ambassador Hotel
HsinChu
56 1.000 0.825 0.825 Holiday Garden Kaohsiung 27 0.472 0.789 0.372 Jen Dow International Hotel 59 0.307 0.791 0.243
Year 2002
ITH Name DMU# OTE AE CE ITH Name DMU# OTE AE CE
The Grand Hotel 1 0.633 0.917 0.580 Grand Hi-Lai Hotel 30 0.620 0.903 0.559
The Ambassador Hotel 2 0.940 0.912 0.858 Howard Plaza Hotel
Kaohsiung 31 0.600 0.808 0.485
Mandarina Crown Hotel 3 1.000 1.000 1.000 The Splendor Kaohsiung 32 0.564 0.867 0.489
Imperial Taipei 4 0.613 0.944 0.579 Park Hotel 33 0.363 0.785 0.285
Gloria Prince Hotel 5 0.658 0.892 0.587 Hotel National 34 0.555 0.834 0.463
Emperor Hotel 6 0.909 0.550 0.500 Plaza International Hotel 35 0.443 0.839 0.371
Hotel Riverview Taipei 7 0.626 0.667 0.418 Evergreen Laurel Hotel 36 0.825 0.753 0.621 Caesar Park Taipei 8 0.628 0.968 0.608 Howard Plaza Hotel
Taichung
37 0.647 0.861 0.557 Golden China Hotel 9 0.657 0.757 0.497 The Splendor Taichung 38 1.000 0.935 0.935
Brother Hotel 11 0.957 0.840 0.803 Marshal Hotel 40 0.452 0.851 0.384
Santos Hotel 12 0.603 0.891 0.537 Chinatrust Hotel Hualien 41 0.753 0.768 0.578
The Ritz Landis Hotel 13 0.794 0.925 0.734 Parkview Hotel 42 0.661 0.966 0.638
United Hotel 14 0.649 0.935 0.607 Hotel Landis China
Yangmingshan
44 1.000 0.727 0.727 Sheraton Taipei Hotel 15 0.392 0.973 0.382 The Grand Hotel Kaohsiung 45 0.581 0.906 0.526 Taipei Fortuna Hotel 16 0.447 0.858 0.384 Caesar Park Hotel Kending 46 1.000 0.905 0.905 Holiday Inn Asiaworld Taipei 17 0.939 0.918 0.862 Hotel Royal Chihpen Spa 47 1.000 0.890 0.890
Hotel Royal Taipei 18 0.704 0.956 0.673 Grand Formosa Hotel 48 0.969 0.860 0.834
Howard Plaza Hotel 19 1.000 0.870 0.870 Howard Beach Resort Kending
49 1.000 0.746 0.746 Rebar Crowne Plaza Taipei 20 0.706 0.833 0.588 The Hibiscus Resorts 50 0.459 0.996 0.457 Grand Hyatt Taipei 21 1.000 1.000 1.000 Taoyuan Holiday Hotel 52 0.448 0.737 0.330 Grand Formosa Regent Taipei 22 1.000 1.000 1.000 Hotel Tainan 53 0.943 0.960 0.905 The Sherwood Hotel Taipei 23 1.000 0.988 0.988 Ta Shee Resort Hotel 54 0.615 0.920 0.565 Far Eastern Plaza Hotel Taipei 24 1.000 1.000 1.000 Hotel Royal Hsinchu 55 0.683 0.914 0.625 The Westin Hotel 25 1.000 0.967 0.967 The Ambassador Hotel
HsinChu 56 0.941 0.991 0.932
Hotel Kingdom 26 0.358 0.922 0.330 Formosan Naruwan Hotel 57 0.532 0.919 0.489
Holiday Garden Kaohsiung 27 0.422 0.900 0.380 Tayih Landis Tainan Hotel 58 0.591 0.891 0.527
The Ambassador Hotel Kaohsiung 28 0.723 0.900 0.651 Plaza Hotel 60 0.451 0.765 0.345
Year 2003
ITH Name DMU# OTE AE CE ITH Name DMU# OTE AE CE
The Grand Hotel 1 0.665 0.912 0.607 Grand Hi-Lai Hotel 30 0.688 0.872 0.600
The Ambassador Hotel 2 0.987 0.916 0.905 Howard Plaza Hotel
Kaohsiung 31 0.731 0.712 0.520
Mandarina Crown Hotel 3 1.000 1.000 1.000 The Splendor Kaohsiung 32 0.554 0.848 0.470
Imperial Taipei 4 0.608 0.806 0.491 Park Hotel 33 0.404 0.628 0.254
Gloria Prince Hotel 5 0.746 0.890 0.664 Hotel National 34 0.560 0.826 0.462
Emperor Hotel 6 0.570 0.665 0.379 Plaza International Hotel 35 0.422 0.772 0.326
Hotel Riverview Taipei 7 0.592 0.672 0.398 Evergreen Laurel Hotel 36 0.895 0.728 0.652 Caesar Park Taipei 8 0.651 0.981 0.638 Howard Plaza Hotel
Taichung
37 0.765 0.754 0.577 Golden China Hotel 9 0.611 0.724 0.442 The Splendor Taichung 38 0.805 0.870 0.700
San Want Hotel 10 0.946 0.967 0.915 Marshal Hotel 40 0.566 0.748 0.423
Brother Hotel 11 0.951 0.832 0.791 Chinatrust Hotel Hualien 41 0.857 0.714 0.612
Santos Hotel 12 0.461 0.857 0.396 Parkview Hotel 42 0.751 0.810 0.608
The Ritz Landis Hotel 13 0.882 0.870 0.768 Farglory Hotel 43 0.994 0.734 0.729
United Hotel 14 0.645 0.833 0.537 Hotel Landis China
Yangmingshan
44 0.901 0.878 0.790 Sheraton Taipei Hotel 15 0.553 0.937 0.519 The Grand Hotel Kaohsiung 45 0.597 0.936 0.559 Taipei Fortuna Hotel 16 0.363 0.908 0.329 Caesar Park Hotel Kending 46 1.000 0.795 0.795 Holiday Inn Asiaworld Taipei 17 0.690 0.729 0.503 Hotel Royal Chihpen Spa 47 1.000 0.743 0.743
Hotel Royal Taipei 18 0.693 0.969 0.671 Grand Formosa Hotel 48 1.000 0.743 0.743
Howard Plaza Hotel 19 1.000 0.828 0.828 Howard Beach Resort Kending
49 1.000 0.649 0.649 Rebar Crowne Plaza Taipei 20 0.824 0.768 0.633 The Hibiscus Resorts 50 0.467 0.809 0.378 Grand Hyatt Taipei 21 1.000 0.960 0.960 The Lalu Sun Moon Lake 51 1.000 1.000 1.000 Grand Formosa Regent Taipei 22 1.000 1.000 1.000 Taoyuan Holiday Hotel 52 0.470 0.719 0.338 The Sherwood Hotel Taipei 23 1.000 0.848 0.848 Hotel Tainan 53 0.948 0.953 0.904 Far Eastern Plaza Hotel Taipei 24 1.000 1.000 1.000 Ta Shee Resort Hotel 54 0.598 0.939 0.562
The Westin Hotel 25 0.973 0.848 0.825 Hotel Royal Hsinchu 55 0.628 0.893 0.560
Hotel Kingdom 26 0.515 0.655 0.337 The Ambassador Hotel
HsinChu
56 0.743 0.951 0.707 Holiday Garden Kaohsiung 27 0.465 0.787 0.366 Formosan Naruwan Hotel 57 0.605 0.849 0.513 The Ambassador Hotel Kaohsiung 28 0.788 0.883 0.696 Tayih Landis Tainan Hotel 58 0.706 0.843 0.595 Han-Hsien international Hotel 29 0.623 0.847 0.527
Year 2004
ITH Name DMU# OTE AE CE ITH Name DMU# OTE AE CE
The Grand Hotel 1 0.710 0.830 0.590 Grand Hi-Lai Hotel 30 0.719 0.887 0.637
The Ambassador Hotel 2 1.000 0.901 0.901 Howard Plaza Hotel
Kaohsiung 31 0.643 0.717 0.461
Mandarina Crown Hotel 3 1.000 0.934 0.934 The Splendor Kaohsiung 32 0.595 0.866 0.515
Imperial Taipei 4 0.705 0.716 0.505 Hotel National 34 0.555 0.844 0.469
Gloria Prince Hotel 5 0.666 0.854 0.568 Plaza International Hotel 35 0.524 0.733 0.384
Emperor Hotel 6 0.695 0.506 0.352 Evergreen Laurel Hotel 36 0.887 0.681 0.604
Hotel Riverview Taipei 7 0.649 0.560 0.364 Howard Plaza Hotel Taichung
37 0.715 0.739 0.528 Caesar Park Taipei 8 0.799 0.724 0.578 The Splendor Taichung 38 0.697 0.911 0.635
Golden China Hotel 9 0.629 0.708 0.445 Marshal Hotel 40 0.512 0.694 0.355
San Want Hotel 10 0.769 0.935 0.719 Chinatrust Hotel Hualien 41 0.734 0.733 0.538
Brother Hotel 11 1.000 0.890 0.890 Parkview Hotel 42 0.688 0.818 0.563
Santos Hotel 12 0.552 0.781 0.431 Farglory Hotel 43 0.946 0.775 0.734
The Ritz Landis Hotel 13 0.796 0.899 0.716 Hotel Landis China Yangmingshan
44 0.770 0.983 0.757
United Hotel 14 0.678 0.742 0.502 The Grand Hotel Kaohsiung 45 0.728 0.811 0.590
Sheraton Taipei Hotel 15 0.588 0.842 0.496 Caesar Park Hotel Kending 46 1.000 0.750 0.750 Taipei Fortuna Hotel 16 0.364 0.790 0.288 Hotel Royal Chihpen Spa 47 0.992 0.695 0.690 Holiday Inn Asiaworld Taipei 17 0.773 0.659 0.510 Grand Formosa Hotel 48 0.728 0.825 0.601 Hotel Royal Taipei 18 0.691 0.942 0.651 Howard Beach Resort
Kending
49 1.000 0.632 0.632 Howard Plaza Hotel 19 0.774 0.928 0.718 The Hibiscus Resorts 50 0.506 0.688 0.348 Rebar Crowne Plaza Taipei 20 0.617 0.948 0.585 The Lalu Sun Moon Lake 51 1.000 1.000 1.000 Grand Hyatt Taipei 21 1.000 0.945 0.945 Taoyuan Holiday Hotel 52 0.495 0.662 0.328 Grand Formosa Regent Taipei 22 1.000 1.000 1.000 Hotel Tainan 53 0.860 0.883 0.759 The Sherwood Hotel Taipei 23 1.000 0.868 0.868 Ta Shee Resort Hotel 54 0.770 0.915 0.705 Far Eastern Plaza Hotel Taipei 24 1.000 1.000 1.000 Hotel Royal Hsinchu 55 0.604 0.896 0.541 The Westin Hotel 25 0.952 0.903 0.859 The Ambassador Hotel
HsinChu
56 0.714 0.921 0.658
Hotel Kingdom 26 0.531 0.596 0.317 Formosan Naruwan Hotel 57 0.528 0.871 0.460
Holiday Garden Kaohsiung 27 0.625 0.648 0.405 Tayih Landis Tainan Hotel 58 0.766 0.785 0.602 The Ambassador Hotel Kaohsiung 28 0.797 0.854 0.680 Evergreen Plaza
Hotel(Tainan)
66 0.539 0.918 0.495 Han-Hsien international Hotel 29 1.000 0.666 0.666
Year 2005
ITH Name DMU# OTE AE CE ITH Name DMU# OTE AE CE
The Grand Hotel 1 0.701 0.849 0.595 Grand Hi-Lai Hotel 30 0.693 0.901 0.625
The Ambassador Hotel 2 1.000 0.889 0.889 Howard Plaza Hotel
Kaohsiung 31 0.629 0.753 0.473
Imperial Taipei 4 0.674 0.798 0.538 The Splendor Kaohsiung 32 0.571 0.890 0.508
Gloria Prince Hotel 5 0.987 0.795 0.785 Hotel National 34 0.625 0.726 0.454
Emperor Hotel 6 0.836 0.420 0.351 Plaza International Hotel 35 0.602 0.744 0.448
Hotel Riverview Taipei 7 0.647 0.584 0.378 Evergreen Laurel Hotel 36 0.870 0.715 0.621 Caesar Park Taipei 8 0.937 0.665 0.623 Howard Plaza Hotel
Taichung
37 0.636 0.834 0.531 Golden China Hotel 9 0.587 0.767 0.450 The Splendor Taichung 38 0.700 0.860 0.602
San Want Hotel 10 0.772 0.857 0.662 Marshal Hotel 40 0.510 0.803 0.410
Brother Hotel 11 1.000 0.783 0.783 Chinatrust Hotel Hualien 41 0.744 0.645 0.480
Santos Hotel 12 0.612 0.796 0.488 Parkview Hotel 42 0.610 0.856 0.522
The Ritz Landis Hotel 13 0.963 0.825 0.795 Farglory Hotel 43 0.770 0.881 0.679
United Hotel 14 0.775 0.706 0.547 Hotel Landis China
Yangmingshan
44 0.819 0.940 0.770 Sheraton Taipei Hotel 15 0.968 0.807 0.781 The Grand Hotel Kaohsiung 45 0.979 0.591 0.579 Taipei Fortuna Hotel 16 0.417 0.746 0.311 Caesar Park Hotel Kending 46 1.000 0.734 0.734 Holiday Inn Asiaworld Taipei 17 0.758 0.696 0.528 Hotel Royal Chihpen Spa 47 0.993 0.687 0.682
Hotel Royal Taipei 18 0.689 0.983 0.677 Grand Formosa Hotel 48 0.671 0.884 0.593
Howard Plaza Hotel 19 0.912 0.841 0.768 Howard Beach Resort Kending
49 0.958 0.653 0.626 Rebar Crowne Plaza Taipei 20 0.604 0.967 0.584 The Hibiscus Resorts 50 0.379 0.955 0.362 Grand Hyatt Taipei 21 1.000 1.000 1.000 The Lalu Sun Moon Lake 51 1.000 1.000 1.000 Grand Formosa Regent Taipei 22 1.000 1.000 1.000 Taoyuan Holiday Hotel 52 0.687 0.546 0.375 The Sherwood Hotel Taipei 23 1.000 0.880 0.880 Hotel Tainan 53 0.899 0.709 0.638 Far Eastern Plaza Hotel Taipei 24 0.970 0.958 0.929 Ta Shee Resort Hotel 54 0.537 0.804 0.432
The Westin Hotel 25 1.000 1.000 1.000 Hotel Royal Hsinchu 55 0.590 0.924 0.545
Hotel Kingdom 26 0.522 0.604 0.315 The Ambassador Hotel
HsinChu
56 0.746 0.978 0.730 Holiday Garden Kaohsiung 27 0.602 0.684 0.411 Formosan Naruwan Hotel 57 0.544 0.916 0.498 The Ambassador Hotel Kaohsiung 28 0.732 0.888 0.650 Tayih Landis Tainan Hotel 58 0.676 0.803 0.543 Han-Hsien international Hotel 29 0.667 0.981 0.655 Evergreen Plaza
Hotel(Tainan)