行政院國家科學委員會專題研究計畫 成果報告
應用衛星遙測與灰系統理論探討台灣氣候因子對植被長期
適應環境之影響
計畫類別: 個別型計畫 計畫編號: NSC93-2313-B-002-095- 執行期間: 93 年 08 月 01 日至 94 年 07 月 31 日 執行單位: 國立臺灣大學農藝學系暨研究所 計畫主持人: 黃文達 共同主持人: 蔡養正,張新軒 報告類型: 精簡報告 處理方式: 本計畫可公開查詢中 華 民 國 95 年 1 月 4 日
Grey Relational Analysis of the Effect of Climate Factors on the Satellite
Remote Sensing Normalized Difference Vegetation Index (NDVI) in Mt.
Huangzui area
Wen-Dar Huang1*, Jan-Chang Chen2, Ming-Huang Hsu1, Zhi-Wei Yang2, Shin-Shinge Chang1, Yang-Zenq Tsai1, Kwang-Yin Huang3, Li-Chang Lu3, Chaur-Tzuhn Chen4, Jr-Shi Yang5, Chi-Ming Yang2*
1
Department of Agriculture, National Taiwan University, Taipei, Taiwan 110, Republic of China
2
Institute of Botany, Academia Sinica, Nankang, Taipei, Taiwan 115, Republic of China
3
Conservation Research Division, Yangminshan National Park Administration, Hsulin, Taipei, Taiwan 112, Republic of China
4
Department of Forest, National Pingtung University of Science and Technology, Neipu, Pingtung, Taiwan 912, Republic of China
5
Department of Mechanical Engineering, Tamkang University, Tamshui, Taipei County, Taiwan 251, Republic of China
*Corresponding author: Email: [email protected] (WDH).
[email protected](CMY). These authors contribute equally to this paper.
Abstract
Eight sets of SPOT satellite imageries, covering nine years from 1994 to 2002 and are equivalent to eight months, were used to monitor the seasonal changes in the normalized difference vegetation index (NDVI) of the Mt. Huangzui area in the Yangminshan National Park at northern Taiwan. The grey system theory was applied to analyze the contribution degree of the five climate factors on the satellite remote sensing NDVI of four major vegetation such as Axonopus affinis、Miscanthus foridulus、Eurya crenatifolia and broad leaf vegetation. The grey relational analysis showed that the contribution degree of climate factors to satellite NDVI is: monthly mean temperature>daily
cumulative irradiance>daily insolation percentage>monthly mean relative humidity> monthly cumulative precipitation. This suggested that light and temperature play more important role in the satellite NDVI than water in the Mt. Huangzui area.
Keywords: Climate factor, Grey relational analysis, Normalized difference vegetation index, NDVI, Satellite remote sensing, Mt. Huangzui area.
Introduction
Satellite remote sensing has been used in plant science research to monitor long-term and great-scale changes in vegetation (Oechel and Reid, 1984; Jakubauskas et al., 1990), photosynthesis of terrestrial plants (Field et al., 1994), changes in canopy structure and density (Malanson and Trabaud, 1987), recovery of primary production (Specht, 1981; Tucker and Sellers, 1986), regrowth rates and biomass production of the forest (Viedma et al., 1996), rates and models of recovery (Viedma et al., 1997), and other aspects of the ecological recovery process.
The climate status, often associated with light, temperature, precipitation, relative humidity, wind, and so forth, are fundamental forest parameters affecting the growth of vegetation. The spectral identification and analysis of chlorophyll for the remote sensing of vegetation have made significant progress in the past three decades (Hsu et al., 2003). However, in nature, the upwelling radiance from the forest is a combined effect of all vegetation components in the forest affected by the complex climate status. It is very important to determine how the total reflectance signal results from individual constituent of climate status. No solution can be found in the traditional mathematics and statistics. However, the grey system theory can solve this problem.
The grey system theory, founded by Deng (1982), is used for systems when part of information is clear and some is not. With only a limited number of data, the theory can effectively deal with the poor, incomplete, or uncertain problems of a system. It is used to study the relationship between known and unknown information. It includes six methodologies: grey generation, grey relational analysis, grey modeling, grey prediction, grey decision making, and grey control (Deng, 1982 and 1989). Since its appearance, more and more researchers in various fields have applied the theory to the handling of their data. Grey relation analysis, within grey system theory, is meant to describe the
posture relationship between one main factor and all the other factors in a given system. The known information is based on standard patterns (reference or control patterns). The grey relational value thus is used to reflect the relationship between a reference condition and a test condition. Grey relational analysis has been used to find out the most important factor affecting a subject, such as a topological effect on an ecological environment (Che and He, 1993), a serum marker’s effect on the detection of liver fibrosis (Chen and Tan, 1995), the relationship between lint yield and cotton fiber quality (Chen, 1990), or the relationship between main quality and agronomic characters of wheat (Guo et al., 1991).
Recently, grey relational analysis was successfully used to compare the degree of contribution of individual antioxidant to total antioxidative capacity or function in various measurement systems, and grey decision making was also used to identify which herb plants had the highest antioxidative capacity and function for marketing (Chung, 2001). Grey relational analysis was successfully employed to connect satellite remote sensing data monitored in space and chlorophyll biochemical data detected on earth. In this way, chlorophylls and their derivatives with less or non-polar chemical structures were found to contribute much more to the normalized difference vegetation index (NDVI) than those with more polarity. The former are located in the thylakoid membrane and the latter in the stroma, of higher plant chloroplast (Yang, 2001).
In a previous study, combining the satellite data and grey system theory, we found that the water-related climate factors, such as precipitation and relative humidity, play more important role in satellite remote sensing brightness index (BRI) of carpetgrass in Mt. Huangzui area than the temperature-related climate factors, such as insolation percentage, temperature, and irradiance (Huang et al., 2003). In this study, we further employ grey relational analysis to pinpoint the most important contribution or to compare the contribution degree of five climate variables determined on the ground to the NDVI of four vegetation in Mt. Huangzui area monitored by SPOT satellite in space.
Materials and Methods
Study site
Mt. Huangzui is located in the east part of Yangminshan National Park at northern Taiwan and is one of the Datun volcanic group composed by more than twenty volcanoes in the park. The geology is mainly andesite. Mt. Huangzui with its height of 912 m is a conical volcano. The peak of Mt. Huangzui is of wide area with U-shape, of which the orifice points to the north (Fig. 1). It has a volcanic crater, around 500 m in diameter and 60 m in depth. It has been listed as the conservation zone in 1983 due to the primitive landscape and abundant ecology (Huang, 2002).
Climate data
The climate data covering from 1993 to 2002 and including monthly mean temperature, daily cumulative irradiance, mean insolation percentage, monthly cumulative precipitation, and monthly relative humidity, were released from the Central Bureau of Weather, Department of Transportation, Executive Yuan, Republic of China. The weather data were recorded by the Chisingshan Station, around 7 km far from Mt. Huangzui.
Satellite data
Eight sets of orthorectified SPOT satellite digital data of process level 10 were purchased from the Center for Space and Remote Sensing Research, National Central
University at Chungli City, Hsin-Chu County, Taiwan. The data were collected on 12/11/1994, 1/6/1995, 3/15/1996, 5/15/1997, 7/22/1996, 8/17/1999, 11/14/1997, and 6/23/2002, equivalent to December, January, March, May, July, August, November and June in a year, respectively. All imagery was free of cloud.
Image Processing
Hybrid classification including supervised and non-supervised classification methods was used to optimize the classification of ground vegetation in the landslide area and to promote classification accuracy. The ground investigation was conducted on 10/14/2002 to confirm the satellite remote sensing data.
Normalized difference vegetation index (NDVI)
The reflectance index of vegetation used in this study was defined by the equation (IR-R)/(IR+R), generally named normalized difference vegetation index (NDVI).
Grey relational analysis
The five constituents of climate status were treated as a comparison or test series, and satellite NDVI was used as a reference series. The basic principle and method of grey relational analysis are as follows (Deng, 1982 and 1989).
(1) Normalization of original data series:
Mean value normalization method is applied in the data series treatment. For example:
data series is *= 0 x ) ) 1 ( ) ( ,..., ) 1 ( ) 3 ( , ) 1 ( ) 2 ( , ) 1 ( ) 1 ( ( x k x x x x x x x
. If the mean value of the original data isX ,
then the mean value normalization data series becomes x*0= ( (1), (2), (3),..., ( ))
X k x X x X x X x where X =
∑
= n k x 1 ) ( k n 1 .(2) The grey relational coefficient γ is defined as follows :
γ(x0(k), xj(k)) = ) ( ) ( max max ) ( ) ( ) ( ) ( max max ) ( ) ( min min 0 0 0 0 k x k x k j k x k x k x k x k j k x k x k j j j j j − + − − + − ζ ζ where j = 1 , … , m; k = 1 , … , n
j is the identification coefficient; its value is taken as [0,1], usually,
γ = 0.5.
x0 is the reference data series.
xj is the test data series.
) ( ) (
0 k x k
x − j is the absolute value (norm) of the difference
between x0(k) and xj(k). ) ( ) ( min min 0 k x k x k
j − j is called the secondary minimum
difference which is selected in all j. ) ( ) ( min 0 k x k x
k − j is called the first minimum difference which
is selected in all k. all the same as max max.
(3) The grey relational grade is
= )) ( ), ( ( 0 * k x k x j γ )) ( ), ( ( 0 * k x k x j γ
∑
= n k k x n 1 0( ( 1 γ j k x ( )) ), .The grey relational grade has the following characteristics: a. . 0≤γ* ≤1
b. The more similar the test data xj(k) is to the reference data x0(k), the larger the grey
relational grade value γ*.
c. Only if the reference series x0(k) is exactly equal to the test series xj(k), does the grey
Results and Discussion
Mt. Huangzui and Vegetation
Today’s Mt. Huangzui was formed when the volcanic eruption took place approximately 600,000-800,000 years ago and was formed by the molten lava and pyroclastic rock at the volcanic crater, which is located at the peak of the mountain. An U-shape volcanic crater surrounded by the east, west, and south edges, was also formed during the volcanic eruption. It was found during the ground truth investigation on 10/14/2002 that around twenty buffalo habitat at Huangzui Pond and swamp and nude area in the volcanic crater. A big shadow puddle and naked area was also found in the east edge and may become a big shadow lake during the rain season (Fig. 2).
The dominant patch of vegetation in Mt. Huangzui area are: Axonopus affinis,
Miscanthus foridulus, Eurya crenatifolia, and broad-leaved plants (Fig. 2). Today’s
carpetgrass A. affinis in Mt. Huangzui area was transplanted from outside when the Japanese occupied Taiwan after 1895 in order to raise buffalo. Before transplanting, the major vegetation M. foridulus on the edges and/or volcanic crater was cut off (Chang, 1991; Chang et al., 1992).
Apparently, the carpetgrass land on the three edges and in the center area of volcanic crater can be remotely sensed by SPOT satellite more than 800 km high in space. The distribution of M. foridulus was demonstrated by light-green in satellite image (Fig. 1). The carpetgrass land at the west and south edges is about 500 m long and narrow, whereas that at the east edge is similarly long and wide. This might be caused by the steepness of the west and south edges and the flat-top at the east edge. A big patch of A.
Climate status
The climate data cited in this study ranged from 1993 to 2002 and included monthly mean temperature, daily cumulative irradiance, daily mean insolation percentage, monthly relative humidity, and monthly cumulative precipitation. Among the five climate factors, the former three showed a similar pattern of annual cycle. They gradually and almost instantaneously increased during late winter and spring, and reached the maximal during the summer, then gradually decreased in autumn and reached to the minimal in winter. The daily insolation percentage runs more smoothly than the other two (Fig. 3A-C). The pattern of monthly relative humidity totally reversed to the above three. However, the monthly relative humidity always kept at the high level, between 87% and 94% (Fig. 3D). The average monthly cumulative precipitation between January and September within nine years is always more than 250 mm. November and December are the rainy season in Mt. Huangzui area and the average precipitation reached to 524 mm and 427 mm, respectively (Fig. 3E).
Normalized difference vegetation index (NDVI)
The spatial distribution of vegetation’s NDVI revealed several characteristics (Fig. 4 and 5):
First, the U-shape pointing to the north and surrounded by the west, south, and east edges can be easily distinguished from other vegetation around in all seasons, especially in the period between May-November (Fig. 4C-4G). The Huangzui Pond and its surrounding swamp or nude area is in the central part of the volcanic crater. A shadow puddle also can be found in the east edge in all seasons. The image forming the horseshoe
is the carpetgrass A. affinis propagating along the three edges.
Second, the vegetation’s NDVI in each pixel always vary seasonally or periodically, forming an annual cycle (Fig. 4 and 5A). The NDVI in total winter ranging from December to February (Fig. 4H and 4A) and early spring in March (Fig. 4B) was the minimal even down to the level less than 0.1, whereas that during the May-August period (Fig. 4C to 4F) was the maximal up to the level more than 0.5.
Third, in spite of total or individual vegetation such as broad leaf, A. affinis, M.
foridulus, and E. crenatifolia, the change of their NDVI are parabola type (Fig. 5), like
the curve of monthly mean temperature, daily cumulative irradiance, and daily insolation percentage (Fig. 3A-C). That is, the maximal NDVI is always distributed in May-August period and the minimal in December-March period, as well as that shown in Fig. 4. Except the winter, the NDVI of broad leaf is much greater than those of A. affinis, M.
foridulus, and E. crenatifolia. Among the latter vegetation, the NDVI of M. foridulus is a
little greater than that of E. crenatifolia, which is also a little greater than that of A. affinis. In summer, while the NDVI of broad leaf is at the level of 0.55, those of other vegetation are around 0.45, causing the NDVI of total vegetation is 0.5. In winter, no apparent difference was found among the NDVI of all vegetation.
Forth, comparison between the curve patterns of climate factors (Fig. 3) and that of NDVI (Fig. 5) suggest that monthly mean temperature and daily cumulative irradiance have more relation to the NDVI of total or individual vegetation than daily insolation percentage, which also has more relation than monthly relative humidity and monthly cumulative precipitation.
Grey relational analysis
It is known that the traditional statistics cannot solve the problem of the extent to which individual factor contributes to a subject. However, the grey system theory is able to make up for the weakness of traditional statistics. We, therefore, applied the method of grey relational analysis to determining the contribution degree of the five climate factors to the NDVI of several vegetation remotely monitored by SPOT satellite.
The seasonal change of NDVI of four vegetations such as A. affinis, M. foridulus, E.
crenatifolia, and broad-leaved plants, and five climate factors were firstly
mean-normalized, according to grey relational analysis (Table 1).
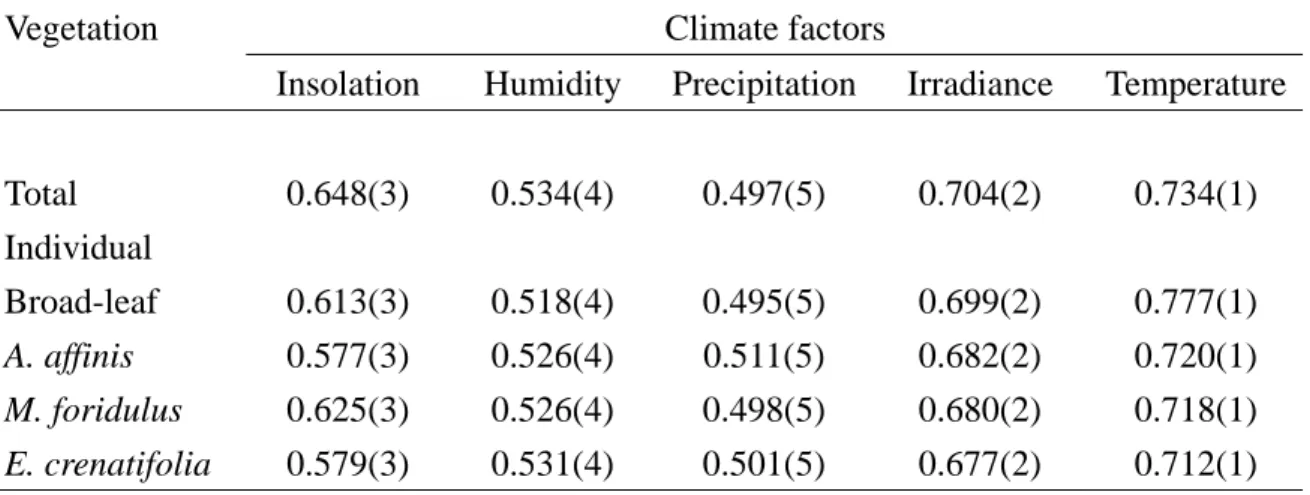
The grey relational values were further calculated on the basis of mean normalization result (Table 2). In spite of total or individual vegetation, the grey relational values are: monthly mean temperature>daily cumulative irradiance>daily insolation percentage > monthly mean relative humidity > monthly cumulative precipitation, which also stand for their grey relational order and contribution degree. That is, the monthly mean temperature plays the most important role to the NDVI of total or individual vegetation in Mt. Huangzui area, whereas the daily cumulative irradiance second, and the daily insolation percentage the third. The monthly mean relative humidity was at the forth place. The monthly cumulative precipitation always plays the least importance.
This data completely reversed to the effects of the same climate factors on the satellite brightness index (BRI) of carpetgrass A. affinis in Mt. Huangzui area (Huang et al., 2003). This is because the meanings of NDVI and BRI are totally reversed. Therefore, various climate factors make different contributions to satellite NDVI. However,
temperature and light among the five climate factors make the most important contribution to the vegetation index. Furthermore, it seems that cumulative irradiance plays a more important role than insolation in the satellite NDVI, and that relative humidity and cumulative precipitation are even less significant.
Since daily cumulative irradiance and daily insolation percentage apparently affect the temperature and are related to sunlight, and monthly mean relative humidity and monthly cumulative precipitation are related to water, which is abundant in whole year in Mt. Huangzui area, temperature and sunlight obviously make more contribution to the vegetation’s NDVI than water.
monthly cumulative precipitation>monthly mean relative humidity>daily insolation percentage>monthly mean temperature>daily cumulative irradiance。
Literature Cited
1. 李培芬。1985。牛隻活動對磺嘴山生態之影響。陽明山國家公園管理處。台灣台 北。 2. 張新軒。1992。磺嘴山(含擎天崗)地區動物(牧牛)對環境影響之研究與管理實施 計畫:類地毯草草種復育工作。陽明山國家公園管理處。台灣台北。 3. 張新軒、陳茂墻、卜瑞雄。1991。磺嘴山(含擎天崗)地區動物(牧牛)對環境影響 之研究與管理。陽明山國家公園管理處。台灣台北。 4. 陳文恭、蔡清彥。1983。陽明山國家公園之氣候。內政部營建署。台灣台北。 5. 鄧聚龍、郭洪。1996。灰預測原理與應用。全華科技圖書股份有限公司。台灣台 北。 6. 楊棋明、楊智旭、趙璧玉。1999。市售黑豆與黃豆抗氧化力之灰預測比較。中華 民國營養學會雜誌,24: 201-214。 7. 趙璧玉、湯淑貞、楊智旭、彭嵐霖、楊棋明。2000。十一種台灣紅色鄉土蔬菜甲 醇萃取物抗氧化力及延長時間之灰關聯分析。中華營養學會年會。 8. 楊志維。2001。衛星遙測與灰系理論應用於水稻營養生長期之監測。國立台灣大 學農藝學系碩士論文。(指導教授:張新軒、蔡養正、楊棋明) 9. 趙璧玉、楊智旭、游添榮、楊棋明。2001。黑豆與黃豆個別類抗氧化物含量對其 抗氧化力之灰關聯分析。2001 年灰色系統理論與應用學術研討會論文集,pp. E28-35。國立雲林科技大學水土資源及防災科技研究中心。10 月 25~26 日。 10. 黃文達、蔡養正、張新軒、楊智旭、楊棋明。2003。高等植物捕光蛋白對葉綠素 a/b 比值貢獻度之灰關聯分析。中華農學會報。(審稿中) 11. 鍾愛嵐、楊棋明、彭嵐霖、楊智旭、趙璧玉。2001。青草植物抗氧化評估之灰關 聯分析與灰決策。2001 年灰色系統理論與應用學術研討會論文集,pp. E117-123。 國立雲林科技大學水土資源及防災科技研究中心。10 月 25~26 日。 12. 鄭雅任。1993。類地毯草生育特性之研究。國立台灣大學農藝學系碩士論文。(指導教授:張新軒、蔡養正)
13. Anderson, G. L., Everitt, J. H., Richardson, A. J. and Escobar, D. E. 1993. Using satellite data to map false broomweed (Ericameria austrotexana) infestations on south Texas rangelands. Weed Technol. 7: 865-871.
14. Chao, P. Y., J. S. Yang, and C. M. Yang. 2000. The grey prediction models on chlorophyll degradation of cucumbers during brining. J. Grey System 12: 187-198. 15. Che, K. J. and He, H. Y. 1993. Grey relational analysis and topological prediction on
ecological environment. J. Grey Sys. 5:147-162.
16. Chen, Y. K. and Tan, X. R. 1995. Grey relational analysis on serum markers of liver fibrosis. J. Grey Sys. 7:63-74.
17. Choudhury, B. J. 1987. Relationships between vegetation indices, radiation
absorption, and net photosynthesis evaluated by sensitivity analysis. Remote Sens. Environ. 22:209-233.
18. Chu, Y. H., Chao, P. Y., Yang, J. S., Peng, L. L. and Yang, C. M. 2003. Grey relational analyzing the flavonoid contents and antioxidative activities of eight vegetables. J. Grey System. 15: 67-72.
19. Deng, J. L. 1982. Control problems of grey systems. Systems and Control Lett. 5: 288-294.
20. Deng, J. L. 1989. Introduction to grey system theory. J. Grey System 1: 1-24.
21. Everitt, J. H., Ingle, S. J., Gausman, H. W. and Mayeux, H. S. Jr., 1984. Detection of false broomweed (Ericameria austrotexana) by aerial photography. Weed Sci. 32: 621-624.
22. Guo, R. L. 1994. Conception on grey crop breeding science. J. Grey Sys. 6:57-270. 23. Huang, K. Y. 2002. The Datun volcano group. Yangminshan National Park
Administration, Ministry of Interior, Executive Yuan, ROC. Taipei, Taiwan.
24. Huang, W. D., Chen, J. C., Hsu, M. H., Yang, Z. W., Chang, S. S., Tsai, Y. Z., Huang, K. Y., Lu, L. C., Chen, C. T. and Yang, C. M. 2003. Grey relational analysis of the
effect of climate factors on the satellite remote sensing brightness index of carpetgrass in Mt. Huangzui. Chinese Agron. J. 13:59-66.
25. Hsu, M. H. 2003. Studies on the relationship of pigment contents and reflectance spectra in the leaves of sweet potato. Ph. D. dissertation. Department of Agronomy, National Taiwan University. Taipei, Taiwan, Republic of China.
26. Hsu, M. H., Huang, W. D., Yang, Z. W., Tsai, Y. Z., Chang, S. S. and Yang, C. M. 2003. Remote sensing of pigment content in sweet potato leaves by reflectance spectra. Chinese Agron. J. 13: 99-110.
27. Lass, L. W. and Callihan, R. H. 1993. GPS and GIS for weed surveys and management. Weed Technol. 7: 249-254.
28. Peters, A. J., Reed B. C., Eve, M. D. and McDaniel, K. C. 1992. Remote sensing of Broom snakeweed (Gutierrzia sarothrae) with NOAA-10 spectral processing. Weed Tecnol. 6: 1015-1020.
29. Roughgarden, J., Running, S. W. and Matson, P. A. 1991. What does remote sensing do for ecology. Ecology 72: 1918-1922.
30. Steven, M. D. and Clark, J. A. 1990. Application of remote sensing in agriculture. University Press, Cambridge.
31. Ward, C. Y. and Watson, V. H. 1973. Bahiagrass and carpetgrass: Forages Sci. Grassl. Agric. Pp. 314-320.
32. Wu, J. T., Chen, S. R., Chen, J. C., Peng, L. L., Yang, J. S. and Yang, C. M. 2003. Chi-Chi earthquake-caused landslide: grey relational analysis of physico-chemical variables and water body reflectance of a landslide-dammed lake monitored by SPOT satellite. The Science of Total Environment (accepted with minor revision)
33. Yang, C. M., J. S. Yang, C. K. Yang, and C. H. Chou. 1999. Long-term research on chlorophyll cycling in the Yuanyang Lake Nature Preserve I. The grey prediction models on chlorophyll degradation of Chamaecypari. var. formosana leaf
.
Photosynthetica 37: 499-508.
34. Yang, C. M., J. C. Chen, L. L. Peng, J. S. Yang, and C. H. Chou. 2002. Chi-Chi earthquake-caused landslide: grey prediction model for pioneer recovery monitored by satellite images. Bot. Bull. Acad. Sin. 43: 69-75.
35. Yang, C. M., Chen, J. C., Peng, L. L., Yang, J. S. and Chou, C. H. 2002. Chi-Chi earthquake-caused landslide: grey prediction model for pioneer vegetation recovery monitored by satellite images. Bot. Bull. Acad. Sin. 43: 69-75.
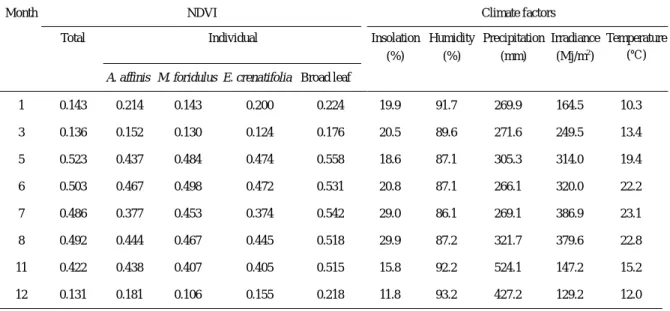
Table 1. The NDVI of total and individual vegetation and five climate factors according to the data of figure 3 and 5.
Month NDVI Climate factors
Total Individual Insolation (%) Humidity (%) Precipitation (mm) Irradiance (Mj/m2) Temperature (℃)
A. affinis M. foridulus E. crenatifolia Broad leaf
1 0.143 0.214 0.143 0.200 0.224 19.9 91.7 269.9 164.5 10.3 3 0.136 0.152 0.130 0.124 0.176 20.5 89.6 271.6 249.5 13.4 5 0.523 0.437 0.484 0.474 0.558 18.6 87.1 305.3 314.0 19.4 6 0.503 0.467 0.498 0.472 0.531 20.8 87.1 266.1 320.0 22.2 7 0.486 0.377 0.453 0.374 0.542 29.0 86.1 269.1 386.9 23.1 8 0.492 0.444 0.467 0.445 0.518 29.9 87.2 321.7 379.6 22.8 11 0.422 0.438 0.407 0.405 0.515 15.8 92.2 524.1 147.2 15.2 12 0.131 0.181 0.106 0.155 0.218 11.8 93.2 427.2 129.2 12.0
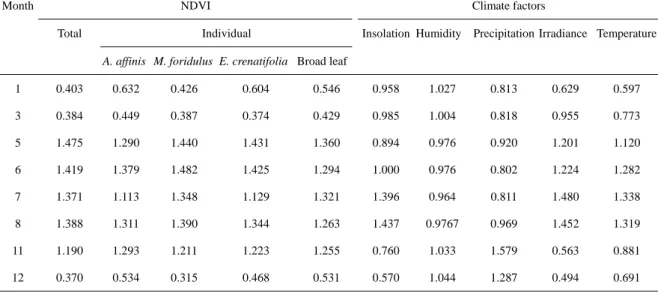
Table 2. The mean normalization value of the NDVI of total and individual vegetation and five climate factors according to the data of figure 3 and 5.
Month NDVI Climate factors
Total Individual Insolation Humidity Precipitation Irradiance Temperature
A. affinis M. foridulus E. crenatifolia Broad leaf
1 0.403 0.632 0.426 0.604 0.546 0.958 1.027 0.813 0.629 0.597 3 0.384 0.449 0.387 0.374 0.429 0.985 1.004 0.818 0.955 0.773 5 1.475 1.290 1.440 1.431 1.360 0.894 0.976 0.920 1.201 1.120 6 1.419 1.379 1.482 1.425 1.294 1.000 0.976 0.802 1.224 1.282 7 1.371 1.113 1.348 1.129 1.321 1.396 0.964 0.811 1.480 1.338 8 1.388 1.311 1.390 1.344 1.263 1.437 0.9767 0.969 1.452 1.319 11 1.190 1.293 1.211 1.223 1.255 0.760 1.033 1.579 0.563 0.881 12 0.370 0.534 0.315 0.468 0.531 0.570 1.044 1.287 0.494 0.691
Table 3. Grey relational grade and order of the effects of climate factors on the total and individual vegetation in Mt. Huangzui area. The numbers in parentheses are the grey relational order.
Vegetation Climate factors
Insolation Humidity Precipitation Irradiance Temperature
Total 0.648(3) 0.534(4) 0.497(5) 0.704(2) 0.734(1) Individual Broad-leaf 0.613(3) 0.518(4) 0.495(5) 0.699(2) 0.777(1) A. affinis 0.577(3) 0.526(4) 0.511(5) 0.682(2) 0.720(1) M. foridulus 0.625(3) 0.526(4) 0.498(5) 0.680(2) 0.718(1) E. crenatifolia 0.579(3) 0.531(4) 0.501(5) 0.677(2) 0.712(1)
West edge Huangzui Pond East edge Shallow puddle South edge
Figure 1. Geographic location of Mt. Huangzui area in the Yangminshan National Park at northern Taiwan. The satellite image was taken on 6/23/2002. The light-green imagery on the edge is the carpetgrass land. The east, west, and south edges formed an U-shape volcanic crater, of which the orifice points to the north. The white and yellow in the center is the Huangzui Pond and nude area around.
N
D
C
B
A
Figure 2. Color photo of Mt. Huangzui. All the pictures were taken on 10/14/2002 during the ground truth investigation. (A) An U-shape volcanic crater surrounded by the east, west, and south edges; (B) Huangzui Pond and swamp and nude area in the volcanic crater; around twenty buffalo habitat in this area; (C) The carpetgrass, puddle and naked area in the east edge; (D) The carpetgrass in the west edge.
y = -0.379x2 + 5.2617x + 3.7118 R2 = 0.9192 0 5 10 15 20 25 1 2 3 4 5 6 7 8 9 10 11 12 Irrad ian ce (J/m 2) re A. Temperatu y = -7.3802x2 + 93.2x + 58.139 R2 = 0.8893 0 50 100 150 200 250 300 350 400 450 1 2 3 4 5 6 7 8 9 10 11 12 In so latio n (%) B. Irradince y = -0.3102x2 + 3.6902x + 13.746 R2 = 0.5156 0 5 10 15 20 25 30 35 1 2 3 4 5 6 7 8 9 10 11 12 C. Insolation T emperature ( ℃ )
Month Month Month
y = 0.2002x2 - 2.4702x + 94.41 R2 = 0.9557 85 86 87 88 89 90 91 92 93 94 1 2 3 4 5 6 7 8 9 10 11 12 D. Humidity Month Hu mid ity (%) Precip itatio n (mm) y = 2.8032x2 - 17.375x + 289.65 R2 = 0.7804 0 100 200 300 400 500 600 1 2 3 4 5 6 7 8 9 10 11 12 E. Precipitation Month
Figure 3. Climate data of Mt. Huangzui area covering from 1993 to 2002. The data were the average of (A) monthly mean temperature, (B) daily cumulative irradiance, (C) daily insolation percentage, (D) monthly mean relative humidity, and (E) monthly cumulative precipitation.
(A) 1995/01/06 SP (B) 1996/03/15 (F) 1999/08/17 (C) 1997/05/15 (G) 1997/11/14 (D) 2002/06/23 (H) 1994/12/11 HP HP SP SP SP HP HP SP HP SP HP SP SP HP HP (E) 1996/07/22
Figure 4. The spatial distribution of NDVI in the Mt. Huangzui area monitored by eight sets of SPOT satellite data taken from 1994 to 2002. The red arrows point to the
Huangzui pond (HP) and shadow puddle (SP) in the volcanic crater and east edge, respectively.
igure 5. The seasonal change in the NDVI of total and individual vegetation in the Mt. y = -0.0118x2 + 0.168x - 0.0939 R2 = 0.7521 0 0.1 0.2 0.3 0.4 0.5 0.6 1 2 3 4 5 6 7 8 9 10 11 12 y = -0.0101x2 + 0.1475x + 0.0007 R2 = 0.6714 0 0.1 2 3 0.4 0.5 0.6 1 2 3 4 5 6 7 8 9 10 11 12 Month 0. 0. N DVI N DVI N DVI N DVI y = -0.0073x2 + 0.1065x + 0.0425 R2 = 0.5736 0 0.1 0.2 0.3 0.4 0.5 0.6 1 2 3 4 5 6 7 8 9 10 11 12 D. Miscanthus foridulus tifolia
Month Month Month
E. Eurya crena N D V I Month y = -0.0084x2 + 0.1197x + 0.0099 R2 = 0.5877 0 0.1 0.2 0.3 0.4 0.5 0.6 1 2 3 4 5 6 7 8 9 10 11 12 y = -0.0114x2 + 0.1598x - 0.0857 R2 = 0.7356 0 0.1 0.2 0.3 0.4 0.5 0.6 1 2 3 4 5 6 7 8 9 10 11 12 F Huangzui area.