Validity of the Loewenstein Occupational Therapy Cognitive
Assessment in People With Intellectual Disabilities
KEY WORDS • cognition • mentally disabled persons • psychometrics • reproducibility of results • visual perception
Yuh Jang, PhD, OTR, is Assistant Professor, School of Occupational Therapy, College of Medicine, National Taiwan University, Taipei, Taiwan.
Jen-suh Chern, PhD, OTR, is Assistant Professor, Department of Occupational Therapy, Chang Gung University, Taoyuan, Taiwan.
Keh-chung Lin, ScD, OTR, is Director, Division of Occupational Therapy, Department of Physical Medicine and Rehabilitation, National Taiwan University Hospital, Taipei, Taiwan, and Associate Professor and Chair, School of Occupational Therapy, College of Medicine, National Taiwan University, 17, F4, Xu Zhou Road, Taipei, Taiwan; [email protected]
We examined the psychometric properties (internal consistency, concurrent criterion validity, and known-group validity) of the Loewenstein Occupational Therapy Cognitive Assessment (LOTCA) in people with intellectual disabilities. A total of 111 people with intellectual disabilities and 19 people with no disabilities were included. We used Cronbach’s alpha, Spearman’s rho, the Kruskal–Wallis test, and one-way analysis of variance for analysis, where appropriate. Results showed good internal consistency on Orientation, Visual Perception, Spatial Perception, Visuomotor Organization, and Thinking Operations subscales (Cronbach’s αs = .82, .74, .76, .86, and .80, respectively), but not on the Motor Praxis subscale (α = .48). We found significant correla-tions between participants’ performance on the Pictorial IQ test and disability level and scores on the LOTCA. The known-group validity of the LOTCA in people with intellectual disabilities was satisfactory. We concluded that the LOTCA is a suitable instrument for measuring cognitive abilities and visual perception in people with intellectual disabilities.
Jang, Y., Chern, J.-S., & Lin, K.-C. (2009). Validity of the Loewenstein Occupational Therapy Cognitive Assessment in people with intellectual disabilities. American Journal of Occupational Therapy, 63, 414–422.
Yuh Jang, Jen-suh Chern, Keh-chung Lin
W
ork is a major daily activity for most people and requires the possession of work behaviors, work skills, aptitudes, and physical capacities to fulfill specific work demands (Jacobs, 1991). Of all disabilities, diminished cognitive ability is considered one of the most significant barriers to the execution of skilled tasks (Silverstein, Kilgore, Fisher, Harley, & Harvey, 1991) because basic cognitive abili-ties that enable a person to acquire, store, retrieve, interpret, organize, and use information are thought to be prerequisite to managing everyday encounters with the environment (Najenson, Rahmani, Elazar, & Averbuch, 1984). Cognitive evaluation has frequently been used as a basis for determining a person’s ability to work in clinical practice. Previous research results revealed that poorer performance in cognitive evaluation was significantly associated with greater likelihood of unem-ployment (Kalechstein, Newton, & van Gorp, 2003) and poorer performance of most activities of daily living (Golisz & Toglia, 2003).Since the enactment of the Physically and Mentally Disabled Citizens Protection Act (1980) and the Act of Special Education (1984), cognitive evaluation tools have increasingly been used in Taiwan to assess clients’ cognitive functions, design employment services, and develop individualized educational plans for vocational rehabilitation and educational programs. Conventionally, the Wechsler Adult Intelligence Scale (WAIS; Wechsler, 1997) and other intelligence tests have been used to measure IQ. Such tests may not be suitable for people with moderate or severe disabilities because they require some ability to follow commands, nor can such tests accurately predict how a person’s abilities and deficiencies will affect his or her management of everyday occupational tasks. Therefore, an assessment tool
is needed that is psychometrically sound and can be used to help plan interventions for people with disabilities (Askenasy & Rahmani, 1988).
The Loewenstein Occupational Therapy Cognitive Assessment (LOTCA) was based on cognitive neuropsycho-logical and developmental theories and on the developers’ clinical experience (Itzkovich, Elazar, Averbach, & Katz, 2000). The LOTCA was designed to measure the basic cognitive abilities and visual perception of clients ages <70 with neurological dysfunction and provide a profile of the client’s cognitive status to establish a baseline for the pur-pose of planning intervention goals and monitoring changes during treatment. Test completion of the LOTCA requires that examinees use only simple verbal or motor responses. The LOTCA also provides alternate methods of administra-tion for examinees with expressive language problems. Katz, Itzkovich, Averbuch, and Elazar (1989) found the LOTCA to be a reliable and valid measure of visual perception and cognitive abilities in adults with brain injuries and healthy controls. Interrater reliability coefficients were found to range from .82 to .97 for its six subscales. The Katz et al. (1989) study and one other (Najenson et al. 1984) found internal consistency and construct validity for the LOTCA’s three areas of perception, visuomotor organization, and thinking operations. Katz et al. (1989), in their study of patients with cerebral vascular accidents and traumatic brain injuries, found the instrument to be valid in differ-entiating between patients, control participants, and known groups for all subscales with the exception of identification of objects.
Age-level standards of the LOTCA were determined on the basis of the performance of 240 normal elementary school-age children (40 children in six groups between ages 6 and 12 years; Itzkovich et al., 2000). Itzkovich et al. found a clear developmental sequence in performance along LOTCA items and verified the hierarchical order of acquir-ing the cognitive competencies tested in the battery.
Although the LOTCA was originally developed for cli-ents with brain injuries, because of its clinical usefulness, it has been widely used in different countries and used to assess the cognitive abilities of psychiatric clients, elderly people, people with spinal cord injuries, underachieving students, and children (Annes, Katz, & Cermak, 1996; Averbuch & Katz, 1988; Cermak et al., 1995; Katz, Champagne, & Cermak, 1997; Su et al., 2000; Su, Chen, Chang, Tsai, & Lin, 2007; Uyanik, Aki, Düger, Bumin, & Kayihan, 1999). It has not, however, been used to evaluate the cognitive abili-ties of people with intellectual disabiliabili-ties (ID) having a diagnosis of mental retardation or developmental disability. The relationship between cognitive abilities and lack of abili-ties in performing daily routine and work activiabili-ties has been
the subject of considerable investigation in recent years. Therefore, an easy-to-administer and valid instrument for assessing cognitive abilities is needed, especially for those with moderate to severe ID.
In this psychometric study, we evaluated the use of the LOTCA in assessing the cognitive abilities of people with ID in vocational rehabilitation and educational settings by analyzing its internal consistency, concurrent criterion valid-ity, and known-group validity when applied to people with ID. Our four research questions were as follows: (1) Are any of the LOTCA items and subscales too easy (ceiling effect) or too difficult (floor effect) for testing the cognitive abilities of people with ID? (2) Do the LOTCA subscales have acceptable internal consistency? (3) Do the LOTCA sub-scales have acceptable concurrent validity? (4) Are there dif-ferences in LOTCA performance scores between participants with ID and participants without ID?
Method
Participants
Participants consisted of one group with ID and a second group with no disabilities (ND). Participants were included if they were ages ≥15 and had a level of consciousness that would not restrict them from completing the assessment process.
ID group. A convenience sample of 112 participants with ID was recruited between 2000 and 2002 from two special schools for people with ID (n = 71) and three employment service institutes for people with ID (n = 40). Of the 112 people recruited, we excluded 1 from the study because of an inability to follow test instructions. The 111 ID group participants consisted of 67 men and 44 women (mean age = 19.4 years, standard deviation [SD] = 2.5, range = 16–28). The ID group was further subdivided into three disability groups (mild, moderate, and severe ID) on the basis of their government-issued disability identification cards. A group of experts, including occupational therapists, psychiatrists, and psychologists, classified the disability groups using the following criteria: IQ scores as determined by the WAIS or other IQ test or observing the participants’ performance in daily routine and work activities when they could not be evaluated by standardized IQ tests. The mild ID group con-sisted of 36 participants with IQ scores ranging from 55 to 69 or who were found able to perform daily routines and semiskilled work activities (adjusted IQ age = 9–12). The moderate ID group consisted of 53 participants with IQ scores ranging from 40 to 54 or who were found able to perform daily routines and simple work activities under supervision (adjusted IQ age = 6–9). The severe ID group
consisted of 27 participants with IQ scores from 25 to 39 or who were found unable to perform daily routines and work activities without assistance (adjusted IQ age <6).
ND group. Comparisons of subscale scores with the nor-mative data may determine intact or impaired performance on each LOTCA subscale and may provide an overall profile of the subscale scores useful for interpreting test results. Thus, to assess the known group validity of the LOTCA, we recruited 19 ND participants with a mean IQ of 112 (range = 91–124) from local high schools or technical high schools. This group included 9 boys and 10 girls (mean age = 16.8 years, SD = 0.8, range = 15–18).
No statistically significant differences occurred between the ND and ID groups in terms of gender (χ2[1] = 1.13,
N = 130, p = .287); however, the ND group was
signifi-cantly younger than the ID group (corrected t[91.29] = 8.73, p < .001).
Instruments
We used two instruments to collect data: the LOTCA (Itzkovich et al., 2000) and the Pictorial IQ test (Hsu & Lu, 1995). The LOTCA, a performance test, contains 26 items categorized into six subscales: Orientation (2 items), Visual Perception (4 items), Spatial Perception (3 items), Motor Praxis (3 items), Visuomotor Organization (7 items), and Thinking Operations (7 items). We scored performance on the LOTCA on a Likert-type scale ranging from 1 to 4 (with the exception of Items 1–8 regarding orientation place and time and Items 1–5 regarding categorization, Riska Object Classification [ROC; Williams & Allen, 1985] unstructured, and ROC structured). The higher the scores were, the better the performance was. Because it is not meaningful to sum unrelated areas of cognitive and perceptual skills, we did not calculate a total score for the LOTCA. The time each par-ticipant took to complete the Visuomotor Organization subscale and the LOTCA was recorded as a proxy of the participant’s information-processing speed. The LOTCA was administered and scored using the test manual’s instruc-tions (Itzkovich et al., 2000).
Instruments similar to the LOTCA in test construct that may be used for practice and research in Taiwanese school or vocational rehabilitation settings are lacking. For purposes of validation of the LOTCA, we used the Pictorial IQ test as a criterion. The Pictorial IQ test, a paper-and-pencil nonverbal IQ test, is a standardized and validated tool designed to measure the concrete and abstract reason-ing abilities of children ages >9. We used this test to evaluate the ability to determine relationships between figures or pictures and to organize, analyze, induce, and summarize nonverbal information. This instrument, which is widely
used in elementary and middle schools in Taiwan, consists of three subscales: Induction (22 items), Reasoning (32 items), and Completion (25 items). For the Induction sub-scale, an item consists of a set of five pictures, four of which depict things that are alike in a particular way and one of which is different. The examinee’s task is to identify the picture that is different. On the Reasoning subscale, the examinee is asked, according to the relationship between the first pair of pictures presented, to identify one picture from the answer key that can make the second pair of pic-tures have the same relationship as the first pair. For the Completion subscale, the examinee’s task is to find a figure to complete a sequence of figures. Final scores are derived from the sum of all correctly answered items and trans-formed into IQ scores on the basis of differences from the norm. The test takes 30 min to complete and has been found to have acceptable test–retest reliability, internal con-sistency, and criterion and predictive validity in populations without disabilities (Hsu & Lu, 1995).
Procedures
The study was approved by the Ethics Committee of National Taiwan University Hospital. During a 2-day ori-entation to the LOTCA and Pictorial IQ test, five occupa-tional therapists were trained to administer the test and score participants’ performance. They read the manual and tested three healthy volunteers for practice. Before the study, inter-rater reliability was established (intraclass correlation coeffi-cient ranging from 0.83 to 1.0).
Participants and their guardian(s), teachers, or employ-ment service workers were introduced to the general testing procedures of the LOTCA and the Pictorial IQ test and signed informed consents before enrollment in the study. Participants and their guardian(s), teachers, or employment service workers were allowed to withdraw at any time during the study. Participants first completed the Pictorial IQ test and were then tested on the LOTCA.
Data Analysis
Because of the ordinal nature of the LOTCA data, we used nonparametric statistical procedures and appropriate descrip-tive statistics for data analyses. We performed frequency analyses at both the LOTCA subscale and item level to evaluate the difficulty of the test items and identify problem-atic items. We considered the frequency of the lowest raw score for an item or a subscale as the floor and the frequency of the highest as the ceiling. Floor and ceiling effects exceed-ing 20% of sample size were considered to be significant (Holmes & Shea, 1997). If an item or a subscale had a ceiling effect, it meant that this item or subscale was too easy for this
population. If an item or a subscale had a floor effect, it indicated that this item or subscale was too difficult for this population. If a scale has ceiling or floor effects, it will not be sensitive and will not be capable of discriminating between different groups (Fayers & MaChin, 2000c).
We used confirmatory factor analysis based on the principal-components analysis method to confirm the group-ing of items within the six LOTCA subscales. We used Cronbach’s alpha coefficient (Cronbach, 1951) to measure the internal consistency of items within each of the LOTCA subscales after the completion of factor analysis. Cronbach’s alpha values >.70 indicate acceptable internal consistency (Fayers & MaChin, 2000a, 2000b).
We used Spearman’s rho correlation coefficients for the means of the various LOTCA subscales, IQ scores trans-formed from the scores of the Pictorial IQ test subscale, and disability level to examine the LOTCA’s concurrent criterion validity. Spearman’s rho values ranging from .4 to .8 repre-sented acceptable concurrent criterion validity (Streiner & Norman, 1995).
We used known-group validity to examine differences between groups completing the same instrument and the Kruskal–Wallis test (Portney & Watkins, 2009b) to test the ability of the item scores and the subscale scores to discrimi-nate among groups with different levels of disability. We used the Mann–Whitney U test (Portney & Watkins, 2009b) to compare differences between the groups. To examine whether the ND and ID groups showed significant differences in the amount of time needed to complete the Visuomotor Organization subscale and the whole test, we conducted a one-way analysis of variance and Tukey’s hon-estly significant difference post hoc analysis (Portney & Watkins, 2009a). We performed all statistical analyses with SPSS for Windows (Version 11.0; SPSS, Inc., Chicago).
Results
Scale Design
For the entire ID sample, the mean scores of the LOTCA subscales were as follows: Orientation, 10.7 (SD = 4.2,
median [Mdn] = 11.0); Visual Perception, 14.7 (SD = 1.9, Mdn = 15.0); Spatial Perception, 7.9 (SD = 2.9, Mdn = 8.0);
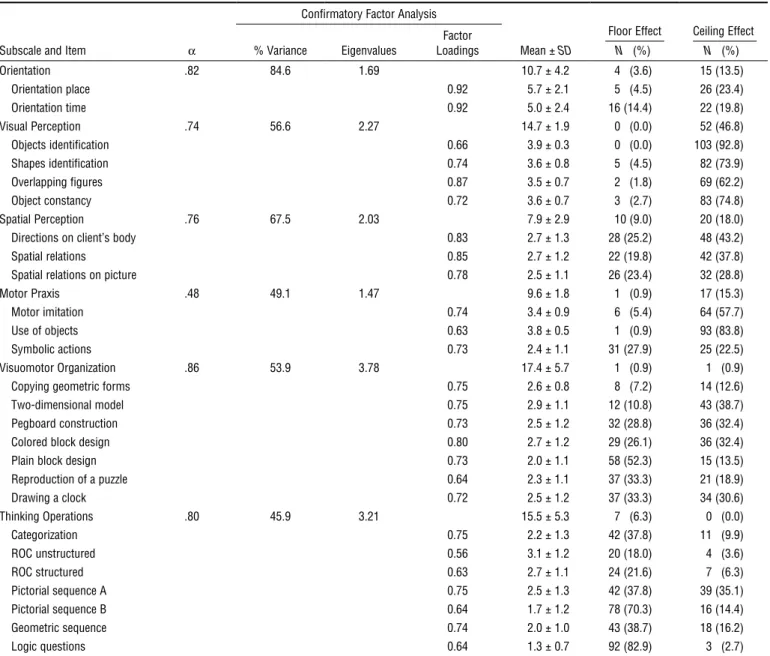
Motor Praxis, 9.6 (SD = 1.8, Mdn = 10.0); Visuomotor Organization, 17.4 (SD = 5.7, Mdn = 18.0); and Thinking Operations, 15.5 (SD = 5.3, Mdn = 15.0; see Table 1). The scores spanned the entire range, and the median was close to the mean, indicating that the distributions of these subscale scores were symmetric. In the item analysis shown in Table 1, most items belonging to the Orientation, Visual
Perception, Spatial Perception, and Motor Praxis subscales had ceiling effects, but those belonging to Visuomotor Organization and Thinking Operations had floor effects.
We also performed scale validation, confirmatory factor analysis, internal consistency, and subscale intercorrelations for the LOTCA in this population. Table 1 shows the results of the confirmatory factor analysis. The percentages of vari-ance accounted for by the one factor generated for each of the LOTCA items in the Orientation, Visual Perception, Spatial Perception, Motor Praxis, Visuomotor Organization, and Thinking Operations subscales were 84.6%, 56.6%, 67.5%, 49.1%, 53.9%, and 45.9%, respectively. Except for the Motor Praxis subscale, which had an alpha of .48, all other LOTCA subscales had acceptable internal alpha coef-ficients (see Table 1).
Concurrent Criterion Validity
As shown in Table 2, each of the six LOTCA subscales were significantly correlated with each other (Spearman’s rho cor-relations ranged from .36 to .73). The Spearman correlation coefficients ranged from .42 to .63 between the subscale means of the LOTCA and the mean scores on the Pictorial IQ test (see Table 2), indicating moderate to good concur-rent validity, with the exception of the Visual Perception subscale (Spearman’s ρ = .26). In our examination of the association between means of the LOTCA subscales and disability level within the participants with ID, Spearman’s correlation coefficients ranged from .34 to .49, indicating fair concurrent validity.
Known-Group Validity
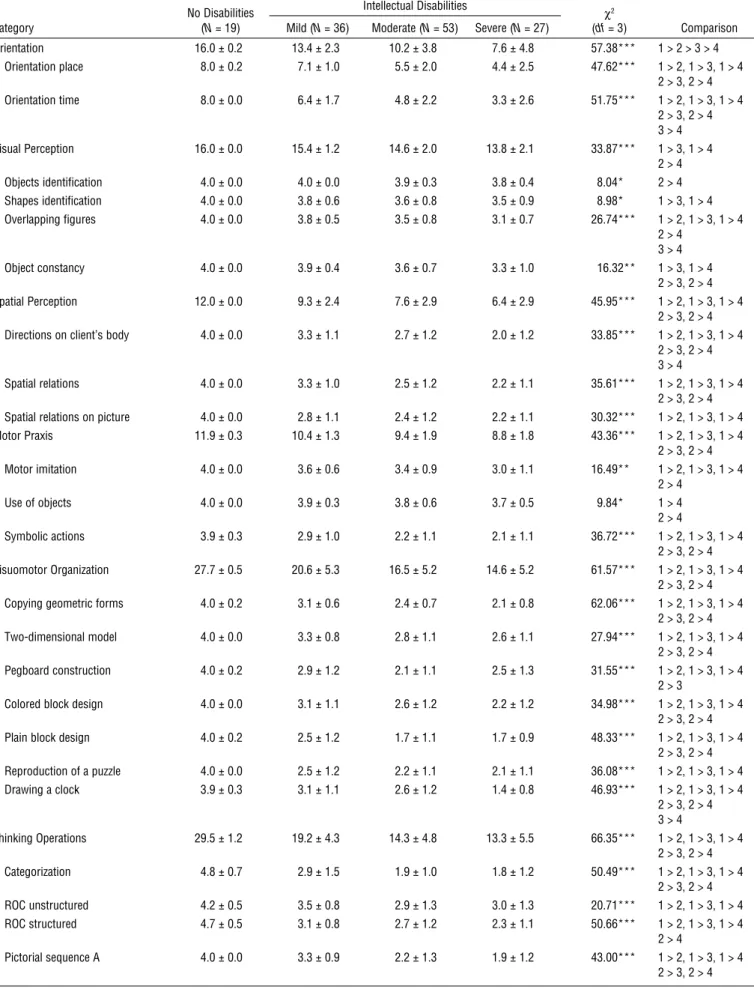
Table 3 shows the mean performance and the results of the Kruskal–Wallis test with post hoc Mann–Whitney U tests on all LOTCA items for the four groups. As predicted, the ND group scored the highest on all items and the severe ID group scored the lowest. The ID and ND groups showed significant differences on all items, with the exception of the object identification item. The mild ID group and the mod-erate and severe ID groups showed significant differences on 22 of 26 items, with the exception of the shape identifi-cation, spatial relations on picture, reproduction of a puzzle, and ROC unstructured items. The moderate and severe ID groups showed significant differences in orientation time, overlapping figures, directions on client’s body, and drawing a clock.
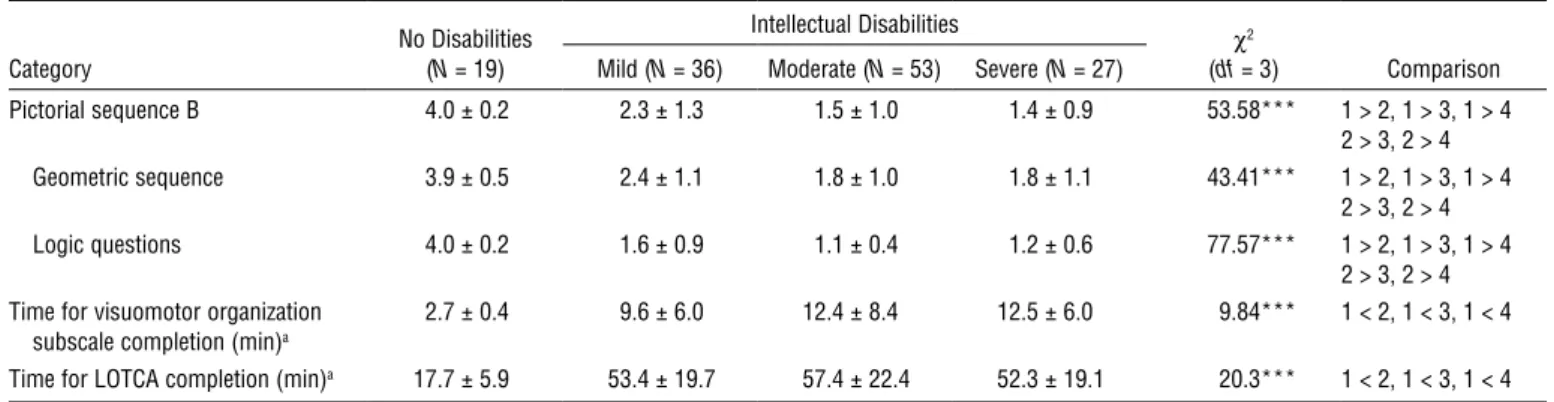
Results also showed that participants with ID performed significantly more slowly than participants with ND. No significant differences occurred among the ID groups with regard to the time required to complete items on the Visuomotor Organization subscale or the entire test.
Table 1. Results of Internal Consistency and Confirmatory Factor Analysis and the Score Distribution of the Loewenstein Occupational Therapy Cognitive Assessment (N = 111)
Subscale and Item α
Confirmatory Factor Analysis
Mean ± SD
Floor Effect N (%)
Ceiling Effect N (%) % Variance Eigenvalues LoadingsFactor
Orientation .82 84.6 1.69 10.7 ± 4.2 4 (3.6) 15 (13.5) Orientation place 0.92 5.7 ± 2.1 5 (4.5) 26 (23.4) Orientation time 0.92 5.0 ± 2.4 16 (14.4) 22 (19.8) Visual Perception .74 56.6 2.27 14.7 ± 1.9 0 (0.0) 52 (46.8) Objects identification 0.66 3.9 ± 0.3 0 (0.0) 103 (92.8) Shapes identification 0.74 3.6 ± 0.8 5 (4.5) 82 (73.9) Overlapping figures 0.87 3.5 ± 0.7 2 (1.8) 69 (62.2) Object constancy 0.72 3.6 ± 0.7 3 (2.7) 83 (74.8) Spatial Perception .76 67.5 2.03 7.9 ± 2.9 10 (9.0) 20 (18.0)
Directions on client’s body 0.83 2.7 ± 1.3 28 (25.2) 48 (43.2)
Spatial relations 0.85 2.7 ± 1.2 22 (19.8) 42 (37.8)
Spatial relations on picture 0.78 2.5 ± 1.1 26 (23.4) 32 (28.8)
Motor Praxis .48 49.1 1.47 9.6 ± 1.8 1 (0.9) 17 (15.3)
Motor imitation 0.74 3.4 ± 0.9 6 (5.4) 64 (57.7)
Use of objects 0.63 3.8 ± 0.5 1 (0.9) 93 (83.8)
Symbolic actions 0.73 2.4 ± 1.1 31 (27.9) 25 (22.5)
Visuomotor Organization .86 53.9 3.78 17.4 ± 5.7 1 (0.9) 1 (0.9)
Copying geometric forms 0.75 2.6 ± 0.8 8 (7.2) 14 (12.6)
Two-dimensional model 0.75 2.9 ± 1.1 12 (10.8) 43 (38.7)
Pegboard construction 0.73 2.5 ± 1.2 32 (28.8) 36 (32.4)
Colored block design 0.80 2.7 ± 1.2 29 (26.1) 36 (32.4)
Plain block design 0.73 2.0 ± 1.1 58 (52.3) 15 (13.5)
Reproduction of a puzzle 0.64 2.3 ± 1.1 37 (33.3) 21 (18.9) Drawing a clock 0.72 2.5 ± 1.2 37 (33.3) 34 (30.6) Thinking Operations .80 45.9 3.21 15.5 ± 5.3 7 (6.3) 0 (0.0) Categorization 0.75 2.2 ± 1.3 42 (37.8) 11 (9.9) ROC unstructured 0.56 3.1 ± 1.2 20 (18.0) 4 (3.6) ROC structured 0.63 2.7 ± 1.1 24 (21.6) 7 (6.3) Pictorial sequence A 0.75 2.5 ± 1.3 42 (37.8) 39 (35.1) Pictorial sequence B 0.64 1.7 ± 1.2 78 (70.3) 16 (14.4) Geometric sequence 0.74 2.0 ± 1.0 43 (38.7) 18 (16.2) Logic questions 0.64 1.3 ± 0.7 92 (82.9) 3 (2.7)
Note. SD = standard deviation; ROC = Riska Object Classification.
Table 2. Spearman’s Rho Correlation Coefficients for Intercorrelations Between the Loewenstein Occupational Therapy Cognitive Assessment Subscale Items, Disability Level, and Pictorial IQ Test Items
Variable 1 2 3 4 5 6 7 8 1. Disability level 1.0 2. Pictorial IQ test .49** 1.0 3. Orientation .49** .45** 1.0 4. Visual Perception .39** .26* .42** 1.0 5. Spatial Perception .37** .46** .56** .42** 1.0 6. Motor Praxis .34** .42** .45** .49** .48** 1.0 7. Visuomotor Organization .42** .63** .47** .36** .51** .53** 1.0 8. Thinking Operations .47** .61** .61** .40** .65** .63** .73** 1.0 Note. N = 111. *p < .05. **p < .001.
Table 3. Results of Mean Scores, Standard Deviations, and the Kruskal–Wallis Test for the Study Groups
Category No Disabilities (N = 19)
Intellectual Disabilities
χ2
(df = 3) Comparison Mild (N = 36) Moderate (N = 53) Severe (N = 27)
Orientation 16.0 ± 0.2 13.4 ± 2.3 10.2 ± 3.8 7.6 ± 4.8 57.38*** 1 > 2 > 3 > 4 Orientation place 8.0 ± 0.2 7.1 ± 1.0 5.5 ± 2.0 4.4 ± 2.5 47.62*** 1 > 2, 1 > 3, 1 > 4 2 > 3, 2 > 4 Orientation time 8.0 ± 0.0 6.4 ± 1.7 4.8 ± 2.2 3.3 ± 2.6 51.75*** 1 > 2, 1 > 3, 1 > 4 2 > 3, 2 > 4 3 > 4 Visual Perception 16.0 ± 0.0 15.4 ± 1.2 14.6 ± 2.0 13.8 ± 2.1 33.87*** 1 > 3, 1 > 4 2 > 4 Objects identification 4.0 ± 0.0 4.0 ± 0.0 3.9 ± 0.3 3.8 ± 0.4 8.04* 2 > 4 Shapes identification 4.0 ± 0.0 3.8 ± 0.6 3.6 ± 0.8 3.5 ± 0.9 8.98* 1 > 3, 1 > 4 Overlapping figures 4.0 ± 0.0 3.8 ± 0.5 3.5 ± 0.8 3.1 ± 0.7 26.74*** 1 > 2, 1 > 3, 1 > 4 2 > 4 3 > 4 Object constancy 4.0 ± 0.0 3.9 ± 0.4 3.6 ± 0.7 3.3 ± 1.0 16.32** 1 > 3, 1 > 4 2 > 3, 2 > 4 Spatial Perception 12.0 ± 0.0 9.3 ± 2.4 7.6 ± 2.9 6.4 ± 2.9 45.95*** 1 > 2, 1 > 3, 1 > 4 2 > 3, 2 > 4 Directions on client’s body 4.0 ± 0.0 3.3 ± 1.1 2.7 ± 1.2 2.0 ± 1.2 33.85*** 1 > 2, 1 > 3, 1 > 4
2 > 3, 2 > 4 3 > 4
Spatial relations 4.0 ± 0.0 3.3 ± 1.0 2.5 ± 1.2 2.2 ± 1.1 35.61*** 1 > 2, 1 > 3, 1 > 4 2 > 3, 2 > 4 Spatial relations on picture 4.0 ± 0.0 2.8 ± 1.1 2.4 ± 1.2 2.2 ± 1.1 30.32*** 1 > 2, 1 > 3, 1 > 4 Motor Praxis 11.9 ± 0.3 10.4 ± 1.3 9.4 ± 1.9 8.8 ± 1.8 43.36*** 1 > 2, 1 > 3, 1 > 4 2 > 3, 2 > 4 Motor imitation 4.0 ± 0.0 3.6 ± 0.6 3.4 ± 0.9 3.0 ± 1.1 16.49** 1 > 2, 1 > 3, 1 > 4 2 > 4 Use of objects 4.0 ± 0.0 3.9 ± 0.3 3.8 ± 0.6 3.7 ± 0.5 9.84* 1 > 4 2 > 4 Symbolic actions 3.9 ± 0.3 2.9 ± 1.0 2.2 ± 1.1 2.1 ± 1.1 36.72*** 1 > 2, 1 > 3, 1 > 4 2 > 3, 2 > 4 Visuomotor Organization 27.7 ± 0.5 20.6 ± 5.3 16.5 ± 5.2 14.6 ± 5.2 61.57*** 1 > 2, 1 > 3, 1 > 4 2 > 3, 2 > 4 Copying geometric forms 4.0 ± 0.2 3.1 ± 0.6 2.4 ± 0.7 2.1 ± 0.8 62.06*** 1 > 2, 1 > 3, 1 > 4
2 > 3, 2 > 4 Two-dimensional model 4.0 ± 0.0 3.3 ± 0.8 2.8 ± 1.1 2.6 ± 1.1 27.94*** 1 > 2, 1 > 3, 1 > 4
2 > 3, 2 > 4 Pegboard construction 4.0 ± 0.2 2.9 ± 1.2 2.1 ± 1.1 2.5 ± 1.3 31.55*** 1 > 2, 1 > 3, 1 > 4
2 > 3
Colored block design 4.0 ± 0.0 3.1 ± 1.1 2.6 ± 1.2 2.2 ± 1.2 34.98*** 1 > 2, 1 > 3, 1 > 4 2 > 3, 2 > 4 Plain block design 4.0 ± 0.2 2.5 ± 1.2 1.7 ± 1.1 1.7 ± 0.9 48.33*** 1 > 2, 1 > 3, 1 > 4
2 > 3, 2 > 4 Reproduction of a puzzle 4.0 ± 0.0 2.5 ± 1.2 2.2 ± 1.1 2.1 ± 1.1 36.08*** 1 > 2, 1 > 3, 1 > 4 Drawing a clock 3.9 ± 0.3 3.1 ± 1.1 2.6 ± 1.2 1.4 ± 0.8 46.93*** 1 > 2, 1 > 3, 1 > 4 2 > 3, 2 > 4 3 > 4 Thinking Operations 29.5 ± 1.2 19.2 ± 4.3 14.3 ± 4.8 13.3 ± 5.5 66.35*** 1 > 2, 1 > 3, 1 > 4 2 > 3, 2 > 4 Categorization 4.8 ± 0.7 2.9 ± 1.5 1.9 ± 1.0 1.8 ± 1.2 50.49*** 1 > 2, 1 > 3, 1 > 4 2 > 3, 2 > 4 ROC unstructured 4.2 ± 0.5 3.5 ± 0.8 2.9 ± 1.3 3.0 ± 1.3 20.71*** 1 > 2, 1 > 3, 1 > 4 ROC structured 4.7 ± 0.5 3.1 ± 0.8 2.7 ± 1.2 2.3 ± 1.1 50.66*** 1 > 2, 1 > 3, 1 > 4 2 > 4 Pictorial sequence A 4.0 ± 0.0 3.3 ± 0.9 2.2 ± 1.3 1.9 ± 1.2 43.00*** 1 > 2, 1 > 3, 1 > 4 2 > 3, 2 > 4 (continued)
Discussion
This study shows that the LOTCA is a valid measure of basic cognitive abilities for people with ID. In the following sections, we discuss its psychometric properties.
Scale Design
Our confirmatory factor analysis showed that factor loadings for each item in the LOTCA ranged from .56 to .92, validat-ing the structure of the LOTCA. Our analysis of internal consistency coefficients for the Orientation, Visual Perception, Spatial Perception, Visuomotor Organization, and Thinking Operations subscales ranged from .74 and .86, further validating LOTCA item structure. The low internal consistency correlation for the Motor Praxis subscale (α = .48) reflects the diverse nature of motor praxis (which includes motor imitation, use of objects, and symbolic actions) and involves different types of conceptual errors of movement planning and object interaction (limb-kinetic, ideomotor, or ideational). These results were consistent with those of Cooke, McKenna, Fleming, and Darnell (2006), who, while studying the validity of the Occupational Therapy Adult Perceptual Screening Test (Cooke, 2004), found the internal consistency coefficient for its apraxia items to be .30 because of the diverse nature of praxic functions. Despite their low internal consistency, all items were maintained in the original single subscale for motor praxis regarding con-tent validity and the ability to draw correct inferences and conclusions from results (Streiner & Norman, 1995).
We observed significant correlations between each of the six LOTCA subscales. Correlation coefficients ranged from .36 to .73, indicating that not all LOTCA subscales are equivalent. Each of the subscales examined separate con-structs of cognition and visual perception while contributing to overall cognition and visual perceptual function. Thus, all
subscales were maintained and should be completed to com-prehensively evaluate a person’s cognition and visual percep-tion. Understanding the interrelationships between the vari-ous constructs of cognition and visual perception is necessary for interpretation of results.
Concurrent Criterion Validity
The results of this study provide evidence supporting the LOTCA’s concurrent criterion validity. Streiner and Norman (1995) described that criterion validity correlation coeffi-cients should fall in the midrange of .4 to .8. However, in practice, criterion validity coefficients of ≥.60 are considered high, and those between .30 and .60 are considered moder-ate to good (Innes & Straker, 1999). The Spearman’s rhos between the mean IQ score of the Pictorial IQ test and the mean score of the LOTCA subscales were significant and ranged between .26 and .63. The Spearman’s rhos between participants’ disability level and LOTCA subscale scores were also significant and ranged between .34 and .47. These results are consistent with the criterion for sound validity described by Streiner and Norman (1995) and Innes and Straker (1999). The moderate and statistically significant correlations of LOTCA performance with Pictorial IQ test performance and disability level indicated that the LOTCA may serve as an additional measure of cognition and visual perception. In addition, although only 80% of our partici-pants were able to complete the Pictorial IQ test, all were able to complete the LOTCA, indicating the relevance of the LOTCA for use with this population.
Known-Group Validity
With regard to known-group validity, as expected, Thinking Operations was the most sensitive subscale in detecting differ-ences among the ID groups and the healthy group, followed by Visuomotor Organization. According to Itzkovich et al. Category No Disabilities (N = 19)
Intellectual Disabilities χ2
(df = 3) Comparison Mild (N = 36) Moderate (N = 53) Severe (N = 27)
Pictorial sequence B 4.0 ± 0.2 2.3 ± 1.3 1.5 ± 1.0 1.4 ± 0.9 53.58*** 1 > 2, 1 > 3, 1 > 4 2 > 3, 2 > 4 Geometric sequence 3.9 ± 0.5 2.4 ± 1.1 1.8 ± 1.0 1.8 ± 1.1 43.41*** 1 > 2, 1 > 3, 1 > 4 2 > 3, 2 > 4 Logic questions 4.0 ± 0.2 1.6 ± 0.9 1.1 ± 0.4 1.2 ± 0.6 77.57*** 1 > 2, 1 > 3, 1 > 4 2 > 3, 2 > 4 Time for visuomotor organization
subscale completion (min)a
2.7 ± 0.4 9.6 ± 6.0 12.4 ± 8.4 12.5 ± 6.0 9.84*** 1 < 2, 1 < 3, 1 < 4 Time for LOTCA completion (min)a 17.7 ± 5.9 53.4 ± 19.7 57.4 ± 22.4 52.3 ± 19.1 20.3*** 1 < 2, 1 < 3, 1 < 4 Note. ROC = Riska Object Classification; LOTCA = Loewenstein Occupational Therapy Cognitive Assessment; 1 = no disabilities group; 2 = mild intellectual disabili-ties group; 3 = moderate intellectual disabilidisabili-ties group; 4 = severe intellectual disabilidisabili-ties group.
aResults of one-way analysis of variance and Tukey’s honestly significant difference post hoc analysis. *p < .05. **p < .01. ***p < .001.
(2000), the LOTCA Thinking Operations subscale requires higher mental processes of problem solving, abstraction, con-cept shifting, logical operation, executive functions, and cal-culation. Thus, most participants with ID receive no or lowest points on Thinking Operations items. Only people with good cognitive functions can respond correctly to these items. In fact, we found that the Thinking Operations subscale was the only subscale able to discriminate between a hemorrhagic group and an ischemic group after cerebral stroke (Su et al., 2000). Our study found the Visual Perception subscale to be the least sensitive in differentiating the differences among the groups. Although the Visual Perception subscale detected the differences between the ND and moderate and severe ID groups, it did not differentiate the ND and mild ID groups, suggesting that one should be cautious when interpreting results of the Visual Perception subscale for people with mild ID. This precaution is also true for interpretations of the use of objects item on the Motor Praxis subscale.
Only the items of orientation time, overlapping figures, directions on client’s body, and drawing a clock were sensitive to the differences between the moderate and severe ID groups. These results indicate that the LOTCA items were able to detect the differences between the ND and moderate and severe ID groups effectively but were unable to detect the differences between the moderate and severe ID groups.
Results also showed that participants with ID completed the Visuomotor Organization subscale and the LOTCA significantly more slowly than did participants with ND. Time to complete the Visuomotor Organization subscale and the LOTCA appears to be a sensitive measure to detect differences between the ID and ND groups and should be considered while administering the LOTCA.
Visuomotor organization consists of copying, drawing, and building and assembling. This subscale involves percep-tual activities with motor responses and has a spatial compo-nent (Uyanik et al., 1999). Difficulties in copying or drawing a symmetrical object may reveal unilateral neglect and may provide information about a person’s ability to process spatial relations (Cooke et al., 2006; Uyanik et al., 1999). Disruption of visual attention affects all aspects of the performance of daily activities, especially those that require inspection and integration of significant amounts of visual details (e.g., edit-ing) and those encountered in dynamic environments (e.g., driving; Warren, 2006). Difficulties in building and assem-bling indicate a constructional problem and are usually expressed in activities of daily living and in the performance of complicated activities of any kind (Neistadt, 1992; Uyanik et al., 1999). For example, a person with visuomotor organi-zation problems may have difficulty with tasks such as dress-ing, writdress-ing, cookdress-ing, and laundry because of difficulties in sequencing different parts of a task.
Employment is an important indicator of functional outcome and represents a key factor for assessing the effec-tiveness of rehabilitation programs (Cifu et al., 1997). Research has indicated that poor performance in cognitive evaluations is an important predictor of limited educational attainment, fewer employment opportunities (Kalechstein et al., 2003; Roberts, Coetzer, & Blackwell, 2004), less pres-tigious occupations (Seltzer et al., 2005), and less-skilled jobs with lower salaries (Seltzer et al., 2005). Occupational thera-pists working with people with ID in the area of vocational rehabilitation need standardized assessment tools that are valid for early and accurate identification of perceptual and cognitive impairments. The LOTCA provides a comprehen-sive profile of visual perception and cognitive abilities impor-tant for daily activities. When working with people with ID, using the LOTCA in combination with skilled job analysis of daily work tasks will assist occupational therapists in deter-mining how the separate deficits of visual–perceptual impair-ment and cognitive dysfunction affect functional task per-formance. The test results may then document cognitive strengths and weaknesses of the people with ID and indicate how work function may be compromised because of cogni-tive impairments.
Future Research
Our findings of internal consistency, concurrent criterion validity, and known-group validity show that the LOTCA can be used to evaluate cognitive abilities and visual percep-tion in people with ID. Future psychometric research on the LOTCA is needed to investigate aspects not addressed in this study, for example, predictive validity, responsiveness, or the association of test performance with employment status and community function. s
Acknowledgments
This work was funded by the National Science Council (NSC-89-2614-B-002-008-M47) in Taiwan.
References
Act of Special Education. (1984). Republic of China Yearbook
1984. Taipei, Taiwan: Government Information Office.
Annes, G., Katz, N., & Cermak, S. (1996). Comparison of younger and older healthy American adults on the Loewenstein Occupational Therapy Cognitive Assessment. Occupational
Therapy International, 3, 157–173.
Askenasy, J. J. M., & Rahmani, L. (1988). Neuropsychosocial rehabilitation of head injury. American Journal of Physical
Medicine and Rehabilitation, 66, 315–327.
Averbuch, S., & Katz, N. (1988). Assessment of perceptual cog-nitive performance: Comparison of psychiatric and brain
injured adult patients. Occupational Therapy in Mental Health,
8, 57–72.
Cermak, S. A., Katz, N., McGuire, E., Greenbaum, S., Peralta, C., & Flanagan, V. M. (1995). Performance of American and Israeli individuals with CVA on the Loewenstein Occupational Therapy Cognitive Assessment (LOTCA). American Journal
of Occupational Therapy, 49, 500–506.
Cifu, D. X., Keyser-Marcus, L., Lopez, E., Wehman, P., Keutzer, J. S., Englander, J., et al. (1997). Acute predictors of suc-cessful return to work one year after traumatic brain injury: A multicenter analysis. Archives of Physical Medicine and
Rehabilitation, 78, 125–131.
Cooke, D. M. (2004). Establishing the psychometric properties of
the Occupational Therapy Adult Perceptual Screening Test (OT–APST). Unpublished doctoral dissertation, University
of Queensland, Brisbane, Australia.
Cooke, D. M., McKenna, K., Fleming, J., & Darnell, R. (2006). Construct and ecological validity of the Occupational Therapy Adult Perceptual Screening Test (OT–APST). Scandinavian
Journal of Occupational Therapy, 13, 49–61.
Cronbach, L. J. (1951). Coefficient alpha and the internal struc-ture of tests. Psychometrika, 16, 297–334.
Fayers, P. M., & MaChin, D. (2000a). Factor analysis. In Quality
of life: Assessment, analysis, and interpretation (pp. 91–116).
New York: Wiley.
Fayers, P. M., & MaChin, D. (2000b). Multi-item scales. In
Quality of life: Assessment, analysis, and interpretation (pp.
72–89). New York: Wiley.
Fayers, P. M., & MaChin, D. (2000c). Scores and measurements: Validity, reliability, sensitivity. In Quality of life: Assessment,
analysis, and interpretation (pp. 45–71). New York: Wiley.
Golisz, K. M., & Toglia, J. P. (2003). Perception and cognition. In E. B. Crepeau, E. S. Cohn, & B. A. Boyt Schell (Eds.),
Willard and Spackman’s occupational therapy (10th ed., pp.
395–411). Philadelphia: Lippincott Williams & Wilkins. Holmes, W., & Shea, J. (1997). Performance of a new, HIV/
AIDS-targeted quality of life (HAT–QoL) instrument in asymptomatic sero-positive individuals. Quality of Life
Research, 6, 561–571.
Hsu, C. W., & Lu, C. Y. (1995). The Pictorial IQ test: Examiner’s
manual [in Chinese]. Taipei, Taiwan: Chinese Behavioral
Sciences Corporation.
Innes, E., & Straker, L. (1999). Validity of work-related assess-ments. Work, 13, 125–152.
Itzkovich, M., Elazar, B., Averbuch, S., & Katz, N. (2000).
Loewenstein Occupational Therapy Cognitive Assessment (LOTCA) battery manual (2nd ed.). Pequannock, NJ: Maddak.
Jacobs, K. (1991). Occupational therapy: Work-related programs and
assessments (2nd ed., p. 17). Boston: Little, Brown.
Kalechstein, A. D., Newton, Y. F., & van Gorp, W. G. (2003). Neurocognitive functioning is associated with employ-ment status: A quantitative review. Journal of Clinical and
Experimental Neuropsychology, 25, 1186–1191.
Katz, N., Champagne, D., & Cermak, S. A. (1997). Performance of adults on three versions of a puzzle reproduction task.
American Journal of Occupational Therapy, 51, 562–568.
Katz, N., Itzkovich, M., Averbuch, S., & Elazar, B. (1989). Loewenstein Occupational Therapy Cognitive Assessment (LOTCA) battery for brain-injured patients: Reliability
and validity. American Journal of Occupational Therapy, 43, 184–192.
Najenson, T., Rahmani, L., Elazar, B., & Averbuch, S. (1984). An elementary cognitive assessment and treatment of the cranio-cerebrally injured patient. In B. A. Edelstein & E. T. Couture (Eds.), Behavioral assessment and rehabilitation of the
traumati-cally brain damaged (pp. 313–338). New York: Plenum.
Neistadt, M. E. (1992). Occupational therapy treatment for con-structional deficits. American Journal of Occupational Therapy,
46, 141–148.
Physically and Mentally Disabled Citizens Protection Act. (1980). Republic of China Yearbook 1980. Taipei, Taiwan: Government Information Office.
Portney, L. G., & Watkins, M. P. (2009a). Multiple comparison tests. In Foundations of clinical research: Applications to practice (3rd ed., pp. 479–501). Upper Saddle River, NJ: Pearson Education. Portney, L. G., & Watkins, M. P. (2009b). Nonparametric tests
for group comparisons. In Foundations of clinical research:
Applications to practice (3rd ed., pp. 503–522). Upper Saddle
River, NJ: Pearson Education.
Roberts, C. B., Coetzer, B. R., & Blackwell, H. C. (2004). Is per-formance on the Wechsler Abbreviated Scale of Intelligence associated with employment outcome following brain injury?
International Journal of Rehabilitation Research, 27, 145–147.
Seltzer, M. M., Floyd, F., Greenberg, J., Lounds, J., Lindstrom, M., & Hong, J. (2005). Life course impacts of mild intel-lectual deficits. American Journal of Mental Retardation, 110, 451–468.
Silverstein, B., Kilgore, K. M., Fisher, W. P., Harley, J. P., & Harvey, R. F. (1991). Applying psychometric criteria to func-tional assessment in medical rehabilitation: I. Exploring unidi-mensionality. Archives of Physical Medicine and Rehabilitation,
72, 631–637.
Streiner, D. L., & Norman, G. R. (1995). Basic concepts. In
Health measurement scales: A practical guide to their develop-ment and use (2nd ed., pp. 4–13). Oxford, England: Oxford
University Press.
Su, C. Y., Chang, Y. J., Chen, H. M., Su, C. J., Chien, T. H., & Huang M. H. (2000). Perceptual differences between stroke patients with cerebral infarction and intracerebral hemorrhage.
Archives of Physical Medicine Rehabilitation, 81, 706–714.
Su, C. Y., Chen, H. M., Chang, Y. W., Tsai, C. Y., & Lin, Y. H. (2007). The Loewenstein Occupational Therapy Cognitive Assessment–Second Edition: Preliminary normative data [in Chinese]. Journal of Taiwan Occupational Therapy Association,
25, 60–74.
Uyanik, M., Aki, E., Düger, T., Bumin, G., & Kayihan, H. (1999). Cognition in 4–11 year old children in Turkey.
Pediatric Rehabilitation, 3, 119–124.
Warren, M. (2006). Evaluation and treatment of visual deficits fol-lowing brain injury. In H. McHugh Pendleton & W. Schultz-Krohn (Eds.), Occupational therapy: Practice skills for physical
dysfunction (6th ed., pp. 532–572). St. Louis, MO: Mosby.
Wechsler, D. (1997). WAIS–III. San Antonio, TX: Psychological Corporation.
Williams, R. K., & Allen, C. K. (1985). Research with nondisabled population. In C. K. Allen (Ed.), Occupational therapy for
psychiatric diseases: Measurement and management of cognitive disabilities (pp. 315–388). Boston: Little, Brown.