行政院國家科學委員會專題研究計畫 成果報告
PEM 燃料電池動態響應時間常數之理論與實驗研究(3/3)
研究成果報告(完整版)
計 畫 類 別 : 個別型 計 畫 編 號 : NSC 95-2221-E-002-218- 執 行 期 間 : 95 年 08 月 01 日至 96 年 10 月 31 日 執 行 單 位 : 國立臺灣大學應用力學研究所 計 畫 主 持 人 : 陳發林 計畫參與人員: 碩士班研究生-兼任助理:林弘益、謝秉佐、蔡詠平、蕭智 文、張森圳、高鳴壕、任博川、廖克曦、陳嘉倫、郭志益 報 告 附 件 : 國外研究心得報告 處 理 方 式 : 本計畫可公開查詢中 華 民 國 97 年 01 月 04 日
行政院國家科學委員會專題研究計劃成果報告
PEM 燃料電池動態響應時間常數之理論與實驗研究(3/3) 計劃編號:NSC 95-2212-E-002-218 執行時間:95/08/01 ~ 96/10/31 主持人: 陳發林教授 共同研究人員:鄧宏旭、顏維謀、宋齊有 執行單位:國立台灣大學 應用力學所 附件:參訪美國能源研究機構心得報告Abstract
The study focuses on transport transient phenomena of cathode gas diffusion layer of PEM fuel cells by using two-phase flow model. Liquid water saturation and oxygen concentration profile in gas diffusion layer and polarization curve are investigated by numerical simulations. Results show that liquid water due to chemical reaction reduces effective porosity of gas diffusion layer and hinders oxygen transport to reaction site. When the gas diffusion media is more hydrophobic, the liquid water removal rate by the capillary force is faster. With the decreasing GDL porosity or the thicker GDL thickness, the mass transport limitation takes place at lower current density. Besides, since liquid water saturation in gas diffusion layer is higher, liquid water effect on the cell performance becomes more significant. With the longer channel length or the slower inlet velocity, the mass transport limitation also takes place at lower current density. And with the increasing current density, liquid water effect on the cell performance becomes more significant.
1. Introduction
In the past decades, efforts [1-3] on fundamental modeling of PEMFCs have been developed to better understand transport phenomena and performance of the cell.
Bernardi [4] proposed a one-dimensional mathematical model to describe the gas transport in electrodes, and the membrane was considered as uniformly wetted. Results showed that water balance in the fuel cells was extremely important. Imbalance between production and evaporation rates could result in either membrane dehydration by deficient water or flooding of the electrode by excessive water, and both of which affected the limiting current density. Temperatures, pressures, and gas flow rates of humid gases also influenced the cell. The lower current density, higher gas flow rate, lower humidity, higher temperature, and low pressure brought about deficient water in general. On the contrary, the higher current density, lower gas flow rate, higher humidity, lower temperature, and higher pressure brought about excessive water. When temperature is higher, the amount of evaporated water is higher and the current density of water balance is also higher, and liquid water reached balance when anode relative humidity was about 55%. Excessive humidification caused water transport to cathode side and resulted in flooding. In gas transport, since the hydrogen diffusivity was approximately seven folds than oxygen diffusivity, the hydrogen depletion gradient was so slight relative to oxygen depletion gradient. Hydrogen transport limitation was essential nonexistence in experiment. However it didn’t take liquid water into consideration and electrodes were free of water droplets.
A mathematical model for the membrane connected to the electrode was derived by Bernardi and Verbrugge [5], and the catalyst layer was the overlap between the membrane and the electrode. The model adjusted the parameter of exchange current density in low current density range, since the electrochemical reaction potential was responsible for potential drop. And then model adjusted membrane conductivity at higher current density, since the potential drop across the membrane became an important factor in addition to potential drop of electrochemical reaction. In the aspect of the catalyst, the exchange current density increased with the increase in the amount of catalyst, so the reaction overpotential was decreasing. For lower current density, the reaction rate was more uniformly in the catalyst layer. For higher current density, the reaction rate near gas diffuser was higher. However, the reaction near the membrane almost vanished due to deficiency of oxygen. Hence, the effective reaction thickness of the catalyst layer was varied with current density. In the aspect of pressure profile, the pressure drop took place mainly in the membrane as a result of low permeability. In the aspect of water transport of the membrane, water transferred form cathode side to anode side as a result of pressure drop in low current density. And water transferred from anode side to cathode side at high current density, since electric potential force dominated the water transport.
Bernardi and Verbrugge [6] extended [5] mathematical model, and took anode side into account in addition to cathode side in their model. Results indicated that the anode overpotential to the cell performance was minor. At low current density, cathode activation overpotential was fully responsible for potential loss of the cell. At high current density, the ohmic loss of the
membrane and electrodes became more vital in addition to activation overpotential. The study also indicated the effect of porosity and thickness of electrode on the limiting current density in the respect of mass transfer. With regard to the membrane, the cell performance was better with the thinner membrane. For different types of membranes, the Dow membrane had larger porosity and larger pore diameter than Nafion membrane and the performance of Dow membrane was superior, even though the Dow is thicker.
Springer et al. [7] presented a one-dimensional, isothermal, steady state model for the whole cell with Nafion 117 membrane. The study probed into the relation between water transport phenomenon and cell performance. Besides, water diffusion coefficient, membrane conductivity, electro-osmotic drag coefficient, and water sorption were functions of water content. Results revealed that the water content in the membrane decreased with increasing current density, and the membrane resistance increased. The membrane resistance decreased with increasing anode stoichiometry, and cell performance was better. With the raising inlet humidifier temperature, the membrane resistance increased with current density was lower, and the performance also promoted. For membrane thickness, the thinner membrane decreased resistance, and the ohmic loss in polarization curve was lower. All above analyses were confirmed experimentally.
Springer et al. [8] considered a fit between polarization curve of
simulation and experiment for different cathode gas compositions of PEM fuel cells. The model used the effective oxygen concentration to simplify oxygen depletion along the channel. For polarization curves at different exchange current densities, higher exchange current density represented the chemical
reaction was more active, and the performance was better. For different permeability, the oxygen concentration profile was more uniform at high permeability. The oxygen concentration dropped quickly at low permeability and effective reaction region was confined. For protonic conductivity, cell performance increased with higher protonic conductivity. The transport resistance in the catalyst layer was higher in the case of low gas pressure. At different inlet gas compositions, the transport resistance was mainly in catalyst layer at higher oxygen concentration. And the transport resistance of backing layer dominated at lower oxygen concentration. Decreasing uniformity of catalyst layer thickness led to better performance, since it enhanced effective permeability and conductivity.
With regard to water and thermal management in PEM fuel cells, Fuller and Newman [9] presented a two-dimensional transport model of PEM fuel cell and discussed water and thermal management in PEM fuel cells. In the case of fixed temperature, the water content at the cathode increased and dehydration at the anode as current density increased, and dehydration at the anode was slight. In non-isothermal case, the heat transfer coefficient was necessary to maintain temperature stability of the system and it was also a crucial design parameter. The evaporation of liquid water affected heat transfer coefficient. The temperature stability in PEM fuel cell was better with higher heat transfer coefficient.
Rowe and Li [10] developed one-dimensional, non-isothermal model of PEM fuel cells to investigated thermal and water management in the cell and the effect of various temperatures and humidity on the cell performance. Results showed that the temperature variation in the cell was not significant at
low current density. With the increasing current density, the temperature profile between anode and cathode electrode was nearly linear, indicating heat conduction was predominant. Nevertheless, the temperature profile was no-linear in the membrane since there was heat generation. With reduced thermal conductivity, the temperature variation in the cell was higher, and it was very important for the design of fuel cell stacks. In the respect of humidification, results suggested that we should reduced humidification in the cathode at high current density if there was sufficient humidification in the anode
Singh et al. [11] extended [5] mathematical model, and presented a two-dimensional, isothermal model for complete fuel cell by finite volume method to discuss water management in PEM fuel cells. Results predicted that the polarization curve was lower than the one-dimension estimate as reactant gas was consumed along the channel. For different flow structures, co-flow case shifted the limiting current density to higher value. And higher stoichiometry also had higher limiting current density. For different electrode porosities, the mass transfer limitation took place at higher current density with increasing porosity, since transfer resistance was smaller. For water management, variation in current density influenced the water transport between anode and cathode side. At low current density, back diffusion took place and liquid water transported form cathode to anode. With the increasing current density, electro-osmotic drag dominated liquid water transport, and liquid water flowed from anode to cathode. At some transitional current density region, gas flow direction between inlet and outlet also differed.
Dohle et al. [12] obtained a one-dimensional mathematical model to consider oxygen gas transport along the channel in PEM fuel cells. The study indicated that oxygen consumed along the channel as a result of chemical reaction. Model assumed that oxygen concentration of the channel was the same as the catalyst layer, and neglected the effect of backing layer, and then, the analytical solutions were obtained by using Tafel formula. The oxygen concentration profile in the channel was exponential for γ =1. For different channel lengths, the limiting current density increased with decreasing channel length as the concentration profile was more uniform, and proposed the concept of effective channel length. Furthermore, authors did some experiments to verify the theory.
In the respect of liquid water transport, Wohr et al. [13] developed a one-dimensional model in PEM fuel cells. Transport of liquid water in the porous electrode was described by surface diffusion coefficient ( L
O H
D 2 ). Results showed that the current-voltage curves were influenced by several parameters such as diffusion layer thickness, diffusion layer porosity, and catalyst layer structure. For the influence of temperature, the ohmic loss was significant as a result of anode dehydration, increasing temperature of the humidifier led to higher cell voltage. However, when temperature exceeded 90oC , the cell
performance decreased at high current density due to decreasing partial pressure of the reactant and increasing water vapor pressure.
Baschuk and Li [14] formulated one-dimensional mathematical model and took liquid water into consideration. The model considered the region in the electrode connected to the catalyst layer was flooded by liquid water. In the aspect of oxygen transport, the oxygen concentration at the surface of catalyst
layer was obtained by effective diffusion coefficient of liquid and gas. The study analyzed the operating parameters of the cell and compared with experimental data. Results revealed that flooding increased with increasing current density at low current density and the water generation increased. Nevertheless, with the increasing current density, flooding decreased due to higher water removal rate and then flooding decreased with increasing current density. For different operating temperatures, lower temperature brought about the flooding initiated at lower current density. For different operating pressure, the onset of flooding took place at lower current density with the increasing pressure. The use of air reduced electrode flooding as a result of higher gas flow rate.
Jordan et al. [15] discussed the effect of the gas diffusion layer on the cell performance experimentally. The electronic conductivity increased with increasing thickness of the gas diffusion layer. However, if the diffusion layer too thick, it would worsen gas diffusion properties as a result of longer path for gas diffusion. Sintering enabled the distribution of polytetrafluoroethylene (PTFE) in the gas diffusion layer more uniform, and the gas diffusion layer was more hydrophobic. Hence the cell performance was better as water removal rate was higher.
Lim and Wang [16] studied the effect of hydrophobic polymer content in carbon paper on the performance of fuel cell experimentally. Results showed that contact angle decreased with increasing temperature. Surface morphology of carbon paper was analyzed by scanning electron microscopy (SEM) and was crucial to the cell performance. When fluorinated ethylene propylene (FEP) content in carbon paper ranged form 10 to 40wt.%, the difference in contact
angle was not significant. However, 10wt.% FEP carbon paper had higher power density than 40wt.% carbon paper in humidification condition, this is because excessive FEP content decreased the effective porosity of carbon paper.
Yi and Nguyen [17] developed a two-dimensional transport model in PEM fuel cells that combined with interdigitated gas distributor. The reactant gas was forced to flow through the electrode as a result of forced convection mechanism and the reaction rate in the catalyst site was enhanced by the use of interdigitated gas distributor. Besides, the shear force of reactant gas helped to remove liquid water and reduced flooding in the cathode electrode. The presence of liquid water deteriorated gas diffusion in the electrode, however this model assumed that water existed only as vapor and didn’t take liquid water into account. Results showed that pressure drop increased with increasing gas flow rate, and led to higher current density. The average current density decreased with increasing electrode width. The gas flow rate and average current density increased with decreasing shoulder width. In reality, the ohmic resistance increased with the decreasing shoulder width, so there was an optimum shoulder width.
He et al. [18] developed a two-dimensional, two-phase, multicomponent transport model in PEM fuel cells employing interdigitated gas distributor. The difference between this model and previous study [17] was that liquid water was considered in this model. For condensation and vaporization, switch function was selected to describe mass transfer rate between vapor and liquid water. The gas transport was expressed by continuity equation, and liquid water transport was driven by capillary force and interfacial shear force. Results
showed that current density increased with increasing pressure drop between inlet and outlet channel as gas flow rate was higher. For electrode thickness, thicker electrode thickness increased gas flow rate at the same pressure drop. However, the effective oxygen concentration at catalyst site reduced when electrode thickness was too thick and the average current density decreased. The cell performance improved with increasing number of channels, thinner shoulder width, for a fixed area. However, the manufacturing cost increased with increasing number of channels. For different ratios between the channel and shoulder widths, shorter shoulder width was favorable to get higher performance.
Natarajan and Nguyen [19] developed a two-dimensional, two-phase, multicomponent, transient model in PEM fuel cell using conventional gas distributor. The gas transport was expressed by multicomponent diffusion equation, and liquid water transport was defined by Darcy’s equation. From transient profile, it was seen that liquid water transport in the cathode was sluggish, and was the main reason for transport limitation. Gas transport was quite fast so the time to reach steady state was shorter, and the slower transport of liquid water was crucial to reach a new steady state in the transient analysis. The cell performance increased with increasing operating temperature as the transport limitation reduced. This was compound effect of higher electrochemical reaction, higher rate of evaporation, higher diffusion coefficient, higher saturated pressure, and smaller amount of liquid water in the electrode. At lower current density, increasing humidity of the inlet stream decreased membrane dehydration. However, the cell performance decreased with increasing humidity of the inlet stream at high current density since the
liquid water increased with increasing current density. For the design of channel, the increasing number of channels at fixed electrode width led better performance.
Bering et al. [20] developed a three-dimensional, non-isothermal
computational model of PEM fuel cells to investigate into the distribution of oxygen concentration, temperature, and water transport in the membrane. In the aspect of oxygen depletion, oxygen concentration decreased with increasing current density. The oxygen concentration at the catalyst layer was about zero at current density of 1.4 A/cm2, revealing that the limiting current density had been reach. In the aspect of oxygen concentration profile, the distribution of oxygen concentration was less uniform with the increasing current density, indicating that the distribution of current density was also less uniform. The fraction of current density under the channel area increased with increasing current density. For the distribution of temperature, the temperature of the membrane was highest in the cell as a result of lower conductivity, and the cathode side was higher than anode side due to reversible and irreversible entropy generation. For liquid water transport in the membrane, the effect of diffusion due to concentration gradient was slight compared with convection and electro-osmotic drag. Furthermore, the relation between water transport coefficient and current density at different values of permeability had been presented in this study.
Berning and Djilali [21] presented a three-dimensional, computational model of PEM fuel cells, including gas diffusion layer (GDL) and channels for both anode and cathode side. The main difference compared with previous study [20] was liquid water effect had been considered in this model. When
relative humidity exceeded 100%, vapor concentration in the GDL was calculated by saturation pressure which was function of temperature, and water was considered only as vapor when relative humidity was smaller than 100%. Liquid water transport was expressed by viscous forces and capillary pressure terms, and the cell performance was affected by liquid water. Results showed that liquid water saturation didn’t exceed 10% at both anode and cathode side, and increased non-linearly with current density. GDL permeability was found a crucial parameter, and liquid water saturation in the electrode increased with decreasing permeability.
Nam and Kaviany [22] developed one-dimensional mathematic model in
hydrophobic porous media to describe liquid water transport. The effective diffusion coefficient was functions of the porosity and liquid water saturation. The cell performance decreased with increasing liquid water saturation as the effective diffusion coefficient was reduced. With regard to liquid water transport, the model considered both micro- and macro- transport simultaneously. Capillary flow was considered in macro-transport, and condensation was considered in micro-transport. The effect of fiber diameter, porosity, and capillary force on the cell performance was also observed in this study. Finally, the effect of bi-layer diffusion media on liquid water saturation was explored and the design details on reduced liquid water saturation were suggested.
Siegel et al. [23] presented a two-dimensional, computational, steady state model in PEM fuel cells including liquid water transport. Model showed the importance of liquid water transport in porous media. Liquid water was transported by capillary force and mass transfer between different phases.
Effective reaction rate was used to consider liquid water effect on the electrochemical reaction. Results showed that the water content profile between anode and cathode was steeper with the increasing current density as a result of anode dehydration and cathode flooding. Liquid water transport must be considered as the cell performance was more adequate to real situation. Besides, liquid water transport between the catalyst layer and the membrane was vital to the cell performance and the water transport coefficient ranged from 0.16 to 0.34. Liquid water would accumulate in the catalyst layer and GDL at high inlet humidity especially at the inlet of catalyst layer.
Wang and Cheng [24] developed a multiphase, milticomponent transport model in capillary porous media. This model was suitable for multiphase, multicomponent mixture. Model assumed that the porous media was not deformable, and the mixture was considered as highly compressible. The diffusion mass flux within various phases was related to saturation gradients, as well as concentration and temperature gradient. Besides, the mixture concentration was defined by the mass average mixture concentration over all phases. The main advantage in this new model was that it reduced the number of nolinear differential equations within various phases.
Wang et al. [25] developed a two-dimensional, two-phase transport model in the cathode of PEM fuel cells. The threshold current density was determined by the analytical approach to identify the region between the single and two-phase flow. When the cell operated above threshold current density, the appearance of liquid water, two-phase flow model was used to describe liquid water transport. The main mechanism of liquid water transport in the diffusion layer was capillary diffusion within the two-phase region. The numerical
results showed that gravitational effect in two-phase region was negligible since Bond number, ratio of gravitational and surface tension forces, was about 0.04. The convection effect was negligible in the single-phase region but was significant in the two-phase region since the Peclet number of gas transport was 0.08 and 0.32 for single-phase and two-phase flow, respectively. The largest liquid water saturation predicted in this study was 6.3% and was obviously lower than experimental data. This is because series-connected channels were used in the experiment and the liquid water saturation increased with the increasing effective channel length. The GDL was considered as hydrophilic structure in this study, but the GDL should be hydrophobic structure in reality.
You and Liu [26] developed a two-dimensional, two-phase flow model in the cathode for PEM fuel cells, and previous study [25] didn’t include the catalyst layer and the membrane. Result showed that the threshold of two-phase flow depended on current density, operating temperature, and humidification temperature. Liquid water transport through the membrane depended on electro-osmotic drag, back diffusion, and hydraulic permeation. The liquid water saturation increased with increasing current density. At lower operating temperature, the water activity was higher and resistance in the membrane was lower. However, it needed larger overpotential to produce the same current density. Therefore, there existed an optimum operating temperature. Liquid water was likely to produce at lower operating temperature. The cell was easier to produce liquid water with increasing air humidification temperature, especially when the air humidification temperature exceeded operating temperature. And the limiting current density was lower with the increasing air humidification temperature. The limiting current density decreased with
increasing anode humidification temperature, this was because excessive water affected chemical reaction.
Pasaogullari and Wang [27] presented a one-dimensional analytical
solution of liquid water transport in both hydrophilic and hydrophobic GDL. There were two effects of flooding, hindering of oxygen transport, reduced effective porosity, and coverage of active catalyst reaction by liquid water. Results showed that limitation of oxygen transport was more dominant on the cell performance. At high current density, liquid water condensed in the electrode due to chemical reaction and decreased effective porosity. Furthermore, reactant gas transport was limited and the cell performance was reduced. The gas pressure was larger than the liquid water pressure in hydrophilic GDL, and the liquid water pressure was larger than the gas pressure in hydrophobic GDL. Both of media provided capillary force to remove liquid water. However, the slope of capillary pressure at the evaporation front, s=0, was larger in hydrophobic GDL and water removal was more effective. This study only considered diffusion in the gas transport and the effective porosity was corrected by liquid water saturation. However, with the appearance of liquid water, the two-phase flow model would provide a more realistic simulation in the PEM fuel cell.
Traditionally, two-phase flow model was modeled by unsaturated flow theory (UFT) and the gas pressure was assumed constant in the GDL. Pasaogullari and Wang [28] developed a multi-phase mixture model (M2) to investigate the liquid water saturation profile in the hydrophobic GDL and the constant gas pressure assumption was relaxed. Results showed that liquid water would hinder oxygen transport particularly at high current density and
low gas flow rate. When liquid water saturation was lower, the effective porosity would reduce as a result of liquid water generation, but the oxygen concentration in the GDL enhanced, this was because the reduced porosity was not significant to counteract the convection mechanism induced by the two-phase flow. Furthermore, the effect of a micro porous layer (MPL) was considered in porous diffusion media. The liquid water saturation was obtained by continuity of phase pressure, and the effect of porosity, thickness, and contact angle of the MPL on liquid water saturation profile was elaborated.
During fuel cell operation, increasing humidity of the inlet stream is often provided in order to increase proton conductivity of membrane. However, when water vapor pressure exceeds saturation pressure, water vapor will condense into liquid water. At the presence of liquid water, the effective porosity of the GDL reduces and the mass transfer resistance increases, hindering oxygen transport to reaction site.
From previous studies, most of them only consider reactant gas transport in the GDL and neglect liquid water effect. The two-phase transport in the hydrophobic GDL and liquid water effect on the cell performance is scarce. This motivates the present study. In this study, we elaborate the liquid water effect on the cell performance under several physical parameters. The results of simulation are helpful to the design of PEM fuel cell.
Table 1-1 Data for different types of fuel cell 1000。C O2 Sr/LaMn O3 O 2-Ni/YSZ H2 H2O SOFC 650。C O2 CO2 Li/NiO CO3 2-Ni/Al Ni/Cr H2 H2O;CO2 MCFC 50~200。C O2 Pt/Ag OH -Pt/Ni H2 H2O AFC 150~220。C O2 H2O Pt/C H+ Pt/C H2 PAFC 50~100。C O2 H2O Pt、 Ru/C H+ Pt/C CH3OH;H2O CO2 DMFC 50~100。C O2 H2O Pt、 Ru/C H+ Pt/C H2 PEMFC temperature Cathode fuel and production Cathode catalyst Electrolyte Anode catalyst Anode fuel and
production Fuel cell 1000。C O2 Sr/LaMn O3 O 2-Ni/YSZ H2 H2O SOFC 650。C O2 CO2 Li/NiO CO3 2-Ni/Al Ni/Cr H2 H2O;CO2 MCFC 50~200。C O2 Pt/Ag OH -Pt/Ni H2 H2O AFC 150~220。C O2 H2O Pt/C H+ Pt/C H2 PAFC 50~100。C O2 H2O Pt、 Ru/C H+ Pt/C CH3OH;H2O CO2 DMFC 50~100。C O2 H2O Pt、 Ru/C H+ Pt/C H2 PEMFC temperature Cathode fuel and production Cathode catalyst Electrolyte Anode catalyst Anode fuel and
production Fuel
cell
2. Mathematical model
2.1 Basic assumption
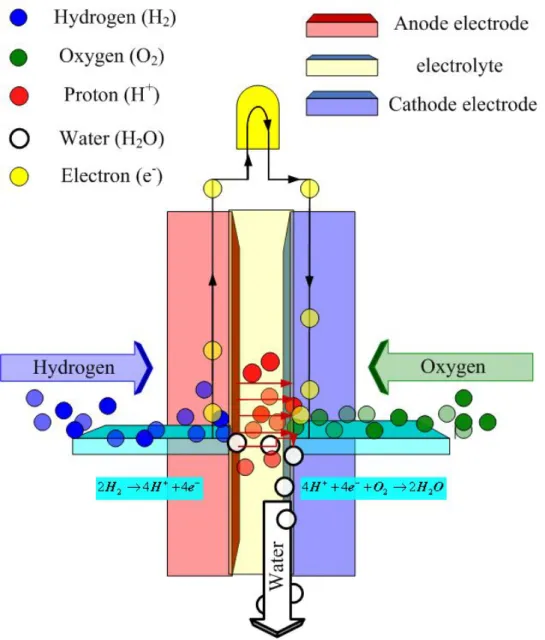
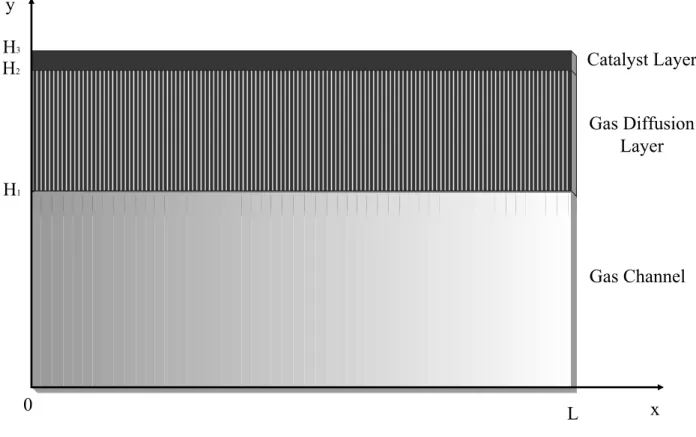
The present model focuses on transport phenomena in PEM fuel cells by two-phase flow model. As the reaction rate at anode is higher than cathode, the electrochemical reaction to the cell performance is mainly limited by cathode. Besides, the effect of flooding often takes place in the cathode GDL. Therefore, the problem domain only takes cathode into consideration. The schematic of the model domain is shown in Fig.2.1, inclusive of the cathode channel, the cathode GDL, and the cathode catalyst layer.
In order to simplify the problem, the following assumptions are used in our model development as follows:
1. The model is one-dimensional. 2. The system is under steady state. 3. The system is isothermal.
4. The gas phase is ideal gas mixture. 5. The inlet gas is air.
6. Oxygen and nitrogen is insoluble in the liquid phase.
7. Catalyst layer is considered as infinitely thin and electrochemical
reaction takes place at this site.
8. The membrane is considered fully hydrated by liquid water. 9. The macro-homogeneous approach is considered.
2.2 Governing equation
In PEM fuel cell, the details of the multiphase mixture model and multiphase transport in porous media have been described by Wang and Cheng [24].
Continuity equation: ( )+∇⋅( )=0 ∂ ∂ u t ρ ε ρ ε (2-1) Species conservation: )] ( [ ) ( ) ( ) (ρ α ε γαρ α ερ α α ερ α α α ε C uC D C s D C C t k k k k k k ∇ − ∇ ⋅ ∇ + ∇ ⋅ ∇ = ⋅ ∇ + ∂ ∂
∑
∑
−∇⋅(∑
Ck jk) α (2-2) The first term on the LHS of equation is the transient term. The secondterm on the LHS of equation is the advection term. The first two terms on the RHS of equation is the Fickian diffusive flux within various different phases. The last term on RHS of equation is the diffusive flux across phases. Where
superscript α represents species of water or oxygen, and subscript k
represents phase of gas or liquid. Liquid water saturation, s, represents the volume ratio of liquid water phase to the void space of porous media.
Since we are dealing with two-phase flow problem, Eq. (2-2) yields:
]} ) 1 ( [ { ) ( ) ( ) (ρ α ε γαρ α ε ρ α ε ρ α ρ α ρ α ε C uC D C sD C s D C D C t +∇⋅ =∇⋅ ∇ +∇⋅ l l∇ l + g − g∇ g − ∇ ∂ ∂ −∇⋅[(Clα −Cαg)jl ] (2-3)
2.2.1 Mixture parameters
The definitions of the mixture model are defined as follows:
Density: ρ =ρls+ρg(1−s) (2-4) Concentration: ρCα =ρlsClα +ρg(1−s)Cαg (2-5) Velocity:
ρ
u =ρ
lul +ρ
gug (2-6) Diffusion coefficient: ρDα = ρlsDlα +ρg(1−s)Dαg (2-7) Individual mobility: g rg l rl l rl l k k k s ν ν ν λ + = ) ( (2-8) ) ( 1 ) ( s k k k s l g rg l rl g rg g υ υ λ υ λ = − + = (2-9) Kinematic viscosity: g rg l rl k k υ υ υ + = 1 (2-10)rl
k and krg are the relative permeability of liquid and gas phase by empirical
correlation [33]:
3
s
krl = (2-11) krg =(1−s)3 (2-12)
In Eq. (2-3), since the model is two-phase flow, liquid and gas each have different velocity, γ is the advection correction factor to correct the α advection term: α α α α α ρ ρ λ λ ρ γ g g l l g g l l C s sC C C ) 1 ( ) ( − + + = (2-13)
The individual phase velocity and the diffusive mass flux of each phase can be defined as:
jk =ρkuk −λkερ u (2-14) jl + jg =0 (2-15)
In Eq. (2-3), jl is diffusive mass flux of liquid phase can be defined as:
jl =ρlul −λlερ u (2-16) jl K l g [ Pc (ρl ρg)g] ν λ λ − + ∇ = (2-17)
The first term on the RHS of equation is the capillary term. The second term on the RHS of equation is the gravity term. The gravitational effect is negligible; this is because the Bond number [25] in our model is about 0.014. Eq. (2-17) can be simplified as: jl = K l g ∇Pc ν λ λ (2-18)
c
P is capillary pressure, and the empirical model [32] is:
cos ( )12J(s) K
P P
Pc = g− l =σ θc ε (2-19)
Where σ is the surface tension at the liquid water and air interface. θ is c
contact angle. Generally speaking, GDL is Teflonized in order to be more hydrophobic for efficient removal of liquid water. And at different Teflon content, the contact angle will also change. When GDL is hydrophilic, the contact angle is 0< <90o
c
θ , and when GDL is hydrophobic, the contact angle
is 90° < <180o
c
θ .
Here,J(s) is the Leverett function (1941): For hydrophilic GDL (0< <90o
c
θ ), the wetting phase is gas phase:
J(s)=1.417(1−s)−2.120(1−s)2 +1.263(1−s)3 (2-20) For hydrophobic GDL (90° < <180o
c
θ ), the wetting phase is liquid phase:
J(s)=1.417s−2.120s2 +1.263s3 (2-21) Substituting Eq. (2-19) into Eq. (2-18) yields:
cos ( )12 J(s) K K jl = l g σ θc ε ∇ ν λ λ (2-22)
And, by chain rule:
s ds s dJ K K jl = l g σcosθc(ε )12 ( )∇ ν λ λ (2-23)
2.2.2 Water transport
As vapor condenses, the concentration of water vapor can be expressed as:
air O H v g O H v O H g M P M P C 2 2 2 = = ρ ρ (2-24)
empirical expression [7]: 3 7 2 5 10 2.1794 0.02953( 273) 9.1837 10 ( 273) 1.4454 10 ( 273) log P =− + T + − × − T + + × − T + v (2-25)
Since oxygen and nitrogen are insoluble in the liquid phase, the concentration of water in liquid phase:
H2O =1
l
C (2-26)
Substituting Eq. (2-24) and Eq. (2-26) into Eq. (2-3) yields:
( ) ( ) [(1 ) ] 2 2 2 2 l g O H v O H O H O H uC j C t ρ ρ ρ γ ε ρ ε +∇⋅ =−∇⋅ − ∂ ∂ (2-27)
Under steady state:
( ) [(1 ) ] 0 2 2 2 +∇⋅ − = ⋅ ∇ l g O H v O H O H uC ρ j ρ ρ γ ε (2-28)
From Eq. (2-13), the advection correction factor for water:
O H O H g g O H l l O H g g O H l l O H g g O H l l O H C C C C s sC C C 2 2 2 2 2 2 2 2 ( ) ) 1 ( ) ( ρ λ λ ρ ρ ρ λ λ ρ γ = + − + + = (2-29)
Integrating Eq. (2-1) over the GDL under steady state yields:
2 2 4 ) 2 1 ( 2 O O H M F I M F I u=− + α + ρ ε (2-30)
The first term on the RHS of equation is the mass flux of water. The second term on the RHS of equation is the mass flux of oxygen. Where α is the net water transport coefficient across the membrane. From Eq. (2-31), we can see that α is the combined effect of electro-osmotic drag, concentration diffusion and pressure gradient between anode and cathode. In this study, we assumed
α is constant for simplification. When α is positive, it means that the net water transport is from anode to cathode across the membrane.
dy dp I F K C dy dC I F D n w m m w w w d μ α = − − (2-31)
Combining Eq. (2-29) and Eq. (2-30) yields:
] 4 ) 2 1 ( 2 [ ) ( 2 2 2 2 2 HO O g O H v g l O H O H M F I M F I C u = + × − + α + ρ ρ λ λ ρ γ ε (2-32)
Substituting Eq. (2-23) and Eq. (2-32) into Eq. (2-28) yields:
+ + + − × + ∇ ]} 4 ) 2 1 ( 2 [ ) {[( 2 2 2 O O H g O H v g l M F I M F I α ρ ρ λ λ 0 ] ) ( ) ( cos ) 1 [( 12 2 = ∇ − ∇ s ds s dJ K K c g l g O H v σ θ ε ν λ λ ρ ρ (2-33)
Integrating Eq. (2-33) over the GDL yields:
+ + + − × + ] 4 ) 2 1 ( 2 [ ) ( 2 2 2 O O H g O H v g l M F I M F I α ρ ρ λ λ ) 2 1 ( 2 ) ( ) ( cos ) 1 ( 2 2 2 1 α ε θ σ ν λ λ ρ ρ + − = ∇ − HO c g l g O H v M F I s ds s dJ K K (2-34) Eq. (2-34) is the governing equation of liquid water saturation, and it is a non-linear first-order ordinary differential equation for the unknown liquid water saturation, s, which needs one boundary condition to be solved numerically.
2.2.3 Oxygen transport
Since oxygen is insoluble in the liquid phase:
O2 =0
l
C (2-35)
) ( ] ) 1 ( [ ) ( ) ( 2 2 2 2 2 2 l O g O g O g g O O O uC s D C C j C t +∇⋅ =∇⋅ − ∇ +∇⋅ ∂ ∂ ρ εγ ρ ερ ε (2-36)
Under steady state:
( 2) [ (1 ) 2 2] ( 2 ) 2 l O g O g O g g O O uC =∇⋅ −s D ∇C +∇⋅ C j ⋅ ∇ εγ ρ ερ (2-37)
From Eq. (2-13), the advection correction factor for oxygen:
2 2 2 2 2 2 2 ( ) ) 1 ( ) ( O O g g O g g O l l O g g O l l O C C C s sC C C ρ λ ρ ρ ρ λ λ ρ γ = − + + = (2-38)
Combining Eq. (2-30) and Eq. (2-38) yields:
] 4 ) 2 1 ( 2 [ ) ( 2 2 2 2 2 O HO O g g O O M F I M F I C C u = λ × − + α + ρ γ ε (2-39)
Substituting Eq. (2-23) and Eq. (2-39) into Eq. (2-37) yields:
− ∇ ∇ − + + − × ∇ ]} [ cos ( ) ( ) ] 4 ) 2 1 ( 2 [ ) {( 2 2 2 2 12 s ds s dJ K K C M F I M F I COg HO O gO l g c g σ θ ε ν λ λ α λ 0 ] ) 1 ( [ − 2∇ 2 = ∇ O g g g s D C ρ ε (2-40)
Integrating Eq. (2-40) over the GDL yields:
− ∇ − + + − × ] [ cos ( ) ( ) ] 4 ) 2 1 ( 2 [ ) ( 2 2 2 2 12 s ds s dJ K K C M F I M F I CgO HO O gO l g c g σ θ ε ν λ λ α λ 2 2 2 4 ] ) 1 ( [ O g O g g M F I C D s ∇ = − ρ ε (2-41)
In diffusion term, the effective diffusion coefficient of oxygen is modified by Bruggeman-type correlation to consider tortuosity factor:
Dgαeff =[ε(1−s)]τDαg (2-42)
By this approach yields:
×− + + ]−[ cos ( ) ( )∇]− 4 ) 2 1 ( 2 [ ) ( 2 2 2 2 12 s ds s dJ K K C M F I M F I C c g l O g O O H O g g σ θ ε ν λ λ α λ
2 2 2 4 ] ) 1 ( [ O g O g g M F I C D s ∇ = − τ τρ ε (2-43)
Eq. (2-43) is the governing equation of oxygen concentration, and it is a non-linear first-order ordinary differential equation which also needs one boundary condition. From Eq. (2-43), we can see that oxygen transport by advection, capillary force and diffusion. In the diffusion term, the effective diffusion coefficient of oxygen decreases with increasing liquid water saturation. And when GDL flooded with water, it will hinder oxygen transport to reaction site. Compared with Eq. (2-34), there is no diffusion term, this is because the liquid water in the gas phase is constant; hence, the gas diffusion term of water vanishes.
2.3 Boundary condition
Both Eq.(2-34) and Eq.(2-43) are non-linear-first-order ordinary differential equation and each needs one boundary condition. In this study, we assume the channel is free of liquid water under large air stoichiometry, and at the interface between channel and GDL, the liquid water saturation is zero.
s
=
0
y
=
H
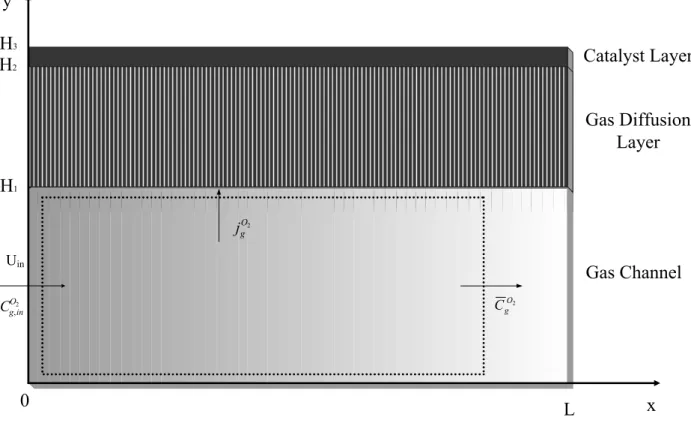
1 (2-44) For the boundary condition of oxygen (Fig. 2-2), the mass flux of oxygen at the interface between channel and GDL can be expressed as:F I M C C h h j O O g H y O g air g m O g H y O g m O g 4 ) ( ) ( 2 2 1 2 2 1 2 2 =− − =− − = = = ρ ρ ρ (2-45)
channel and GDL, and it can be determined from Sherwood number [25] : 693 . 2 2 1 = = g O m D H h Sh (2-46)
As oxygen is consumed along the channel due to electrochemical reaction [29], the average oxygen concentration in the channel decreases, and we consider mass flux of oxygen is constant along the channel and using the approach of control volume within dotted boundary yields:
1 0 , 1 , 1 4 ) ( ) ( ) ( 2 2 2 1 2 2 2 2 L F I M dx j C C H u H u O H y O L O in g O g air g in O in g O g in ρ −ρ = ρ − =
∫
− = =− (2-47)Combining Eq. (2-45) and Eq. (2-47) yields:
( 1 ) 4 1 1 , 2 1 2 2 H u L h F I M C C in m O H y O g O in g − = = ρ + (2-48)
The oxygen concentration at the interface between channel and GDL can be rewritten as: ( 1 ) 4 1 1 , 2 2 1 2 H u L h F I M C C in m O O in g H y O g = = − ρ + (2-49)
2.4 Polarization curve
We use Tafel equation to describe the electrochemical reaction in the catalyst layer: η α RT F O ref O rxn ref o c C C ai dx dI exp 2 2 = (2-50)
Where ref o
ai is the exchange current density, α is the cathode transfer c
coefficient. As we consider catalyst layer is an interface, the electrochemical reaction in the catalyst layer is the same, and the oxygen concentration in the catalyst is uniform. As the presence of liquid water, (1−s) term is used to correct Tafel equation which indicates that the active reaction surface is decrease [25], and there is no electrochemical reaction when liquid water saturation is equal to one.
η α RT F O ref O rxn ref o c C C ai s dx dI exp ) 1 ( 2 2 − = (2-51)
The polarization curve can be described as:
IR V
V = oc −η − (2-52)
The first term on the RHS of equation is the open circuit voltage, the second term on the RHS of equation is the overpotential of the cathode, and the last term on the RHS of equation is ohmic loss.
For reversible open circuit voltage [13]:
1.229 0.85 10 3( 298.15) 4.31 10 5 [ln( 2) ln( 2)]
O H
oc T T P P
V = − × − − + × − + (2-53)
The second term on the RHS of equation account for change in temperature, and the last term on the RHS of equation account for the change in hydrogen and oxygen pressure.
For ohmic loss, we only take the ohmic loss in the membrane and the catalyst layer into consideration.
( 2 ) cl cl m m H H I IR κ κ + = (2-54)
considered fully hydrated by liquid water, the membrane ionic conductivity and
λ can be represented by empirical expression [7]:
1)] 303 1 ( 1268 exp[ ) 326 . 0 5139 . 0 ( T m = λ− − κ (2-55)
Catalyst Layer Gas Diffusion Layer Gas Channel x y L H1 H2 H3 0
Catalyst Layer Gas Diffusion Layer Gas Channel x y L H1 H2 H3 0 Uin 2 , O in g C O2 g C 2 O g j
Fig. 2-2 Schematic of a cathode PEM fuel cell for flux balance
3. Results and discussion
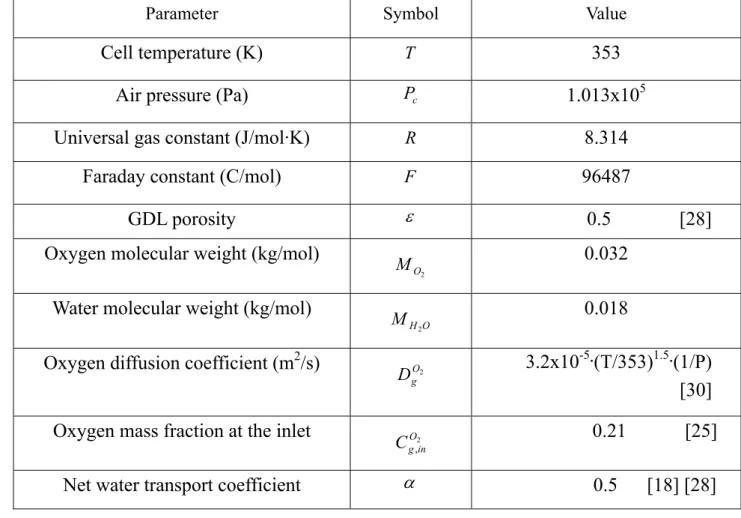
The governing Eq. (2-34) and Eq. (2-43) are both non-linear first-order ordinary differential equation with the boundary Eq. (2-44) and Eq. (2-49), and we solve these problems numerically by using a Runge-Kutta method with adaptive step size. Numerical details are given by Press et al. [35], and thus are not repeated here. The relevant parameters used in this study are listed in Table 3-1. This study is explored to obtain qualitative insights into the distribution of liquid water saturation and oxygen concentration in the GDL and its effect on the cell performance. Several physical parameters like GDL contact angle, GDL
porosity, GDL thickness, inlet velocity, and channel length were discussed as follows.
3.1 Effect of GDL contact angle
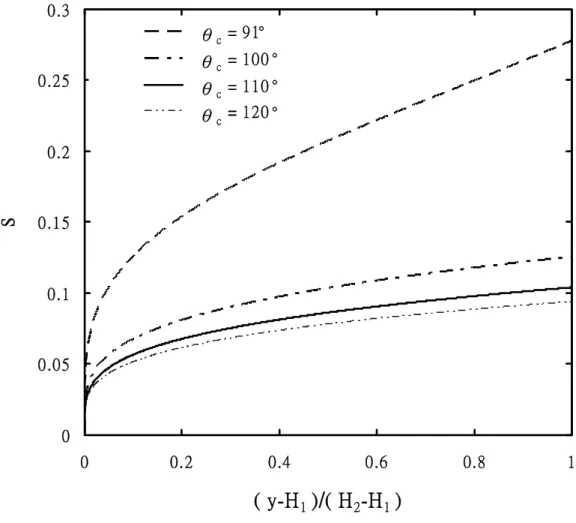
Fig.3-1 shows the effect of liquid water saturation in the GDL at different GDL contact angles. Generally speaking, the GDL is a hydrophobic material and the contact angle is larger than 90o. Fig.3-1 suggests that, the influence of liquid water saturation is significant at different contact angles of hydrophobic GDL. When the GDL is more hydrophobic (larger contact angle), it has higher water removal rate by capillary force, and the lower liquid water saturation in the GDL. Besides, when the GDL is less hydrophobic, the GDL may incur severe flooding.
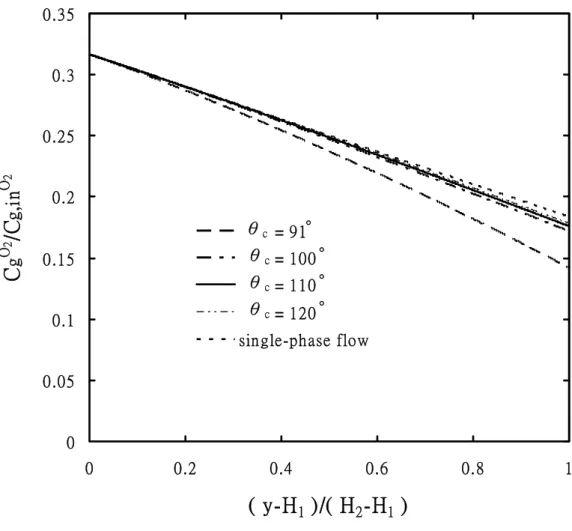
Fig.3-2 shows the effect of oxygen concentration in the GDL at different GDL contact angles. In Fig.3-2, there is one single-phase flow model which there is no liquid water present, and the effect of liquid water on effective diffusion coefficient is excluded. In the two-phase flow model, even if the GDL has higher water removal rate (120o), the effect of liquid water on oxygen concentration can not be neglected especially at high current density. With the presence of liquid water, the effective porosity of the GDL decreases and the mass transfer resistance increases. As the GDL is less hydrophobic, the liquid water is not facile to remove, and the liquid water saturation in the GDL is higher, the mass transfer resistance is also higher, so the oxygen concentration at the interface between the GDL and the catalyst layer is lower.
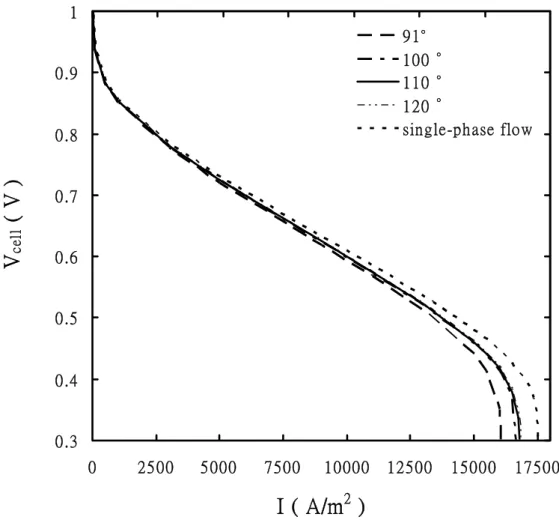
contact angles. It is seen that the less hydrophobic GDL leads to lower limiting current density, and the more hydrophobic GDL leads to higher limiting current density. It is because liquid water is not facile to remove when the GDL is less hydrophobic, and as the liquid water saturation in the GDL is higher, the mass transfer resistance is also higher, so the oxygen is hard to transport into reaction site. At limiting current density, as the transport rate of oxygen can not support the reaction rate, the mass transfer limitation takes place. When GDL is more hydrophobic, the mass transfer resistance is lower, so the limiting current density is higher. As the GDL is less hydrophobic, the difference in polarization curve enlarges in comparison with single-phase flow model. Accordingly, the cell performance will be better when the GDL is more hydrophobic in fuel cell design.
3.2 Effect of current density
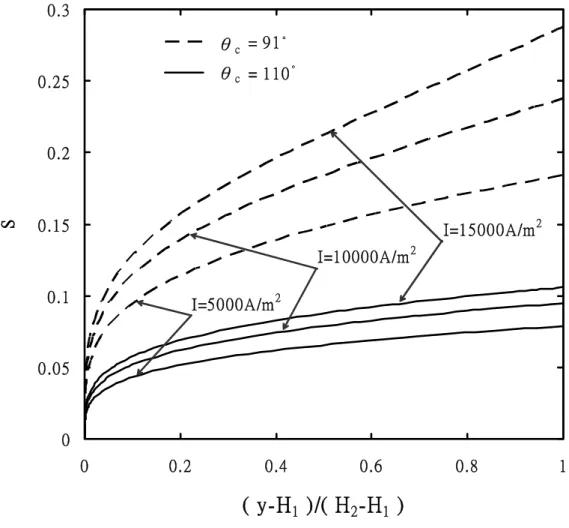
At previous analyses, since there are slight differences between variation in contact angles from 100o to 120o, posterior analyses only base on contact angle of 91o and 110o.
The effects of liquid water saturation in the GDL at different current densities are shown in Fig.3-4. Results show that the electrochemical reaction is more active with the increasing current density, which leads to more liquid water produce, so the liquid water saturation is higher with the increasing current density. On the other hand, for different GDL contact angles, the liquid water saturation has a great dependence at different GDL contact angles. When the GDL is more hydrophobic, the variation is not significant with the increasing current density. However, when the GDL is less hydrophobic, the
variation is significant with the increasing current density. Therefore, when the GDL is less hydrophobic, the change in liquid water saturation profile at different current densities is very important.
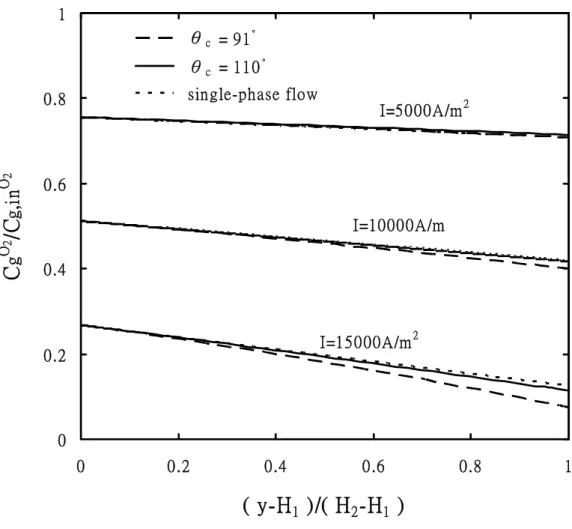
The effects of oxygen concentration in the GDL at different current densities are shown in Fig.3-5. Results indicate that, for the same contact angle in GDL, the higher current density leads to a lower oxygen concentration in the GDL. This is because the electrochemical reaction is more active with the increasing current density, so the consumption of the oxygen increases and the distribution of oxygen concentration is lower. At low current density, the two-phase flow model is closed to the single-phase flow model in the oxygen concentration profile. This is because when liquid water saturation is low, although liquid water renders the effective porosity of the GDL lower, the convection mechanism by two-phase flow improves oxygen transport. Therefore, liquid water effect on the oxygen concentration profile is negligent when current density is low. At high current density, liquid water effect on the oxygen concentration profile is significant. For different GDL contact angles, the discrepancy in the oxygen concentration profile is larger when GDL is less hydrophobic. To depend on above, liquid water effect on the distribution of oxygen concentration is significant at high current density.
3.3 Effect of GDL porosity
Fig.3-6 displays the effect of liquid water saturation in the GDL at different GDL porosities, for a local current density of 13000 A/m2. Results show that the liquid water saturation decreases with increasing GDL porosity, which means that liquid water removal rate is higher. For different GDL contact angles, it is seen that the liquid water saturation has a great influence at
different GDL contact angles. When the GDL is more hydrophobic, the variation at different GDL porosities is slighter. Nevertheless, the variation with the GDL porosity is severe when GDL is less hydrophobic.
Fig.3-7 exhibits the effect of oxygen concentration in the GDL at different GDL porosities, for a local current density of 13000 A/m2. Results present that, the oxygen concentration profile is higher with the increasing GDL porosity, which means the mass transfer resistance is lesser for the reactant, and the oxygen concentration at the interface between the GDL and the catalyst layer is higher. With the decreasing GDL porosity, the oxygen concentration at the interface between the GDL and the catalyst layer is lower, which the mass transfer resistance is larger. Furthermore, it is observed that the GDL contact angle has a great effect on the oxygen concentration profile. When the GDL is less hydrophobic, the liquid water saturation in the GDL is higher as the removal rate of liquid water is lower. It renders the effective porosity lower and the mass mass-transfer resistance larger so the oxygen concentration at the interface between the GDL and the catalyst layer is lower. When GDL is more hydrophobic, as the removal rate of liquid water is higher, the liquid water effect is not significant. With the decreasing GDL porosity, the liquid water effect on the oxygen concentration profile becomes more significant. This is because the liquid water saturation increases with the decreasing GDL porosity, so the discrepancy enlarges with decreasing porosity.
Fig.3-8 manifests the effect of polarization curve at different GDL porosities. Results show that the limiting current density increases with increasing porosity. This is because the mass transfer resistance is lesser with the increasing porosity, and the mass transfer loss takes place at higher current
density. For the case of different contact angles, when the GDL is less hydrophobic, the liquid water effect on the cell performance is higher as the liquid water saturation in the GDL is higher. With the decreasing porosity, the liquid water effect on the cell performance is higher as the liquid water is not facile to remove. With higher porosity, liquid water is facile to remove and the liquid water effect on the cell performance is slight so the performance is better. However, the electrode conductivity decreases with increasing GDL porosity, the omhic loss of the electrode will increase especially at high current density. The effect of omhic loss of electrode should take into consideration in the optimization of fuel cell performance.
3.4 Effect of GDL thickness
Fig.3-9 shows the effect of liquid water saturation in the GDL at different GDL thicknesses for a local current density of 14000 A/m2. It reveals that the liquid water saturation increases with increasing GDL thickness. As the mass transfer path increases with increasing GDL thickness, the liquid water generate at the catalyst layer is not facile to remove. Fig. 3-9 also indicates that the contact angle affects the distribution of liquid water. The liquid water saturation increases faster in the GDL with the lower contact angle. Besides, it is apparent that the discrepancy at different GDL thicknesses enlarges with the lower contact angle case.
Fig.3-10 shows the effect of oxygen concentration in the GDL at different GDL thicknesses for a local current density of 14000 A/m2. It is seen that the
oxygen concentration profile decreases sharply when the GDL thickness is thick as the mass-transfer path longer, similar to the oxygen concentration at the interface between the GDL and the catalyst layer. Fig. 3-10 also indicates that the contact angle affects the oxygen concentration profile. The oxygen concentration is lower in GDL and decreases faster with the lower contact angle because liquid water saturation is higher. With the increasing GDL thickness, the liquid water effect on the oxygen concentration profile becomes more significant. This is because the liquid water saturation increases with the increasing GDL thickness, so the oxygen concentration decays more rapidly with increasing thickness.
Fig.3-11 shows the effect of polarization curve at different GDL thicknesses. We can observe that the limiting current density decreases with increasing GDL thickness. This is because the mass transfer path is longer with the increasing GDL thickness, and the mass transfer loss takes place at lower current density. For the case of different contact angles, at lower contact angle, the liquid water effect on the cell performance is weightier as the liquid water saturation in the GDL is higher. For different GDL thicknesses, with the increasing GDL thickness, the liquid water effect on the cell performance is higher as the liquid water is not removed quickly. And liquid water is facile to remove with decreasing thickness. Therefore, the performance is better since the liquid water effect on the cell performance is slight. However, when the GDL thickness is too thin it can not support for coating with catalyst layer during electrode fabrication, and the contact resistance in the electrode also increases [15]. The effect of contact resistance could be considered in further study to optimize fuel cell performance.
3.5 Effect of inlet velocity
The two-phase flow in the GDL enhances oxygen transport when the oxygen concentration is high. However, when the oxygen concentration in the channel is low, the reduced diffusion by liquid water dominates over the convection, as proposed in previous study [28]. Since the oxygen concentration in the channel is affected by inlet velocity and channel length. Various inlet velocities and channel lengths result in different oxygen concentration in the GDL. Effect of inlet velocity and channel length on the cell performance is discussed as follows.
Fig.3-12 shows the effect of oxygen concentration in the GDL at different inlet velocities. Results show that the oxygen concentration profile is higher with higher inlet velocity because more fuel is supplied to the channel. For this reason, the depletion of fuel along the channel is slighter and the oxygen concentration at the interface between the channel and the GDL is also higher. The effect of various inlet velocities to the oxygen concentration profile is discussed at different current density. The consumption of oxygen increases with increasing current density, for this reason the distribution of oxygen concentration is lower. The liquid water effect on mass transfer is not significant for a lower current density, I = 9000 A/m2. With the increasing current density, the mass transfer loss takes place for inlet velocity of 0.2 m/s at
a local current density of 16000 A/m2. With the increasing liquid water
saturation in the GDL, liquid water effect on the oxygen concentration profile is more significant especially in the case of lower contact angle.
Fig.3-13 shows the effect of polarization curve at different inlet velocities. Result show that the limiting current density increases with increasing inlet velocity. This is because a larger amount of fuel can be supplied when inlet velocity is higher, and the consumption of fuel along the channel is slighter. Accordingly, the limiting current density is higher. For the case of different contact angles, the liquid water effect on the cell performance is significant with the lower contact angle as the liquid water saturation in the GDL is higher. For different inlet velocities, with the increasing velocity liquid water effect on the cell performance becomes more significant, as the GDL floods with liquid water at higher current density. For inlet velocity of 0.2 m/s, liquid water effect on cell performance is almost negligible as a result of lower liquid water saturation. However, liquid water may accumulate in the channel with low gas flow rate. As we have assumed that the channel is free of liquid water under large gas flow rate, if gas flow rate is not high enough to remove liquid water in channel, the severe flooding may occur in reality.
3.6 Effect of channel length
We have discussed the effect of different inlet velocities to the cell for the same channel length in section 3.5, and now we discuss the effect of the cell at different channel lengths for the same inlet velocity in this section. The average oxygen concentration decreases with the increasing channel length as the depletion of fuel along the channel direction, so the oxygen concentration at the interface between the channel and the GDL decreases. As we acquire the oxygen concentration at the interface between the channel and the GDL by
Eq.(2-48). The effect of increasing channel length is similar to decrease inlet velocity, and thus the effect of different channel lengths to the cell is not repeated here. Fig.3-14 shows the effect of oxygen concentration in the GDL at different channel lengths. Fig.3-15 shows the effect of polarization curve at different channel lengths.
Table 3.1 The physical parameters used in simulation
Parameter Symbol Value
Cell temperature (K) T 353
Air pressure (Pa) P c 1.013x10⁵
Universal gas constant (J/mol·K) R 8.314
Faraday constant (C/mol) F 96487
GDL porosity ε 0.5 [28]
Oxygen molecular weight (kg/mol)
2
O
M 0.032
Water molecular weight (kg/mol)
O H M
2
0.018
Oxygen diffusion coefficient (m2/s) O2
g
D 3.2x10
-5·(T/353)1.5·(1/P) [30]
Oxygen mass fraction at the inlet 2
,
O in g
C 0.21 [25]
Membrane thickness (m) Hmem 1.08×10⁻² [26]
Catalyst layer thickness (m) H3 −H2(Hcl) 1.29×10⁻⁵ [26]
GDL thickness (m) H2 −H1 3.0×10
-4 [26] [28]
Channel thickness (m) H1 1.0×10
-3 [26]
Liquid water density (m/kg3) ρl 971.8 [31]
Liquid water Kinetic viscosity (m2/s) υl 3.67×10
-7 [31]
GDL permeability (m2) K 5.0×10⁻¹³ [28]
Surface tension (N/m) σ 0.0625 [28]
Exchange current density (A/ m3) ai o 20000 [28]
Cathode transfer coefficient
c
α 1 [27]
Inlet velocity (m/s) Vin 0.4
0 0 .05 0.1 0 .15 0.2 0 .25 0.3 0 0.2 0.4 0.6 0.8 1 ( y-H1 )
/
( H2-H1 )s
= 91 = 100 = 110 = 120 θc θc θc θc 。 。 。 。Fig. 3-1 Liquid water saturation profile in the GDL at different contact angles, I=14000A/m2.
0 0 .05 0.1 0 .15 0.2 0 .25 0.3 0 .35 0 0.2 0.4 0.6 0.8 1
( y-H
1)/( H
2-H
1)
C
g O2/C
g, in O2 = 91 = 100 = 110 = 120sin gle-phase flow θc θc θc θc 。 。 。 。
Fig. 3-2 Oxygen concentration profile in the GDL at different contact angles, I=14000A/m2.
0 .3 0 .4 0 .5 0 .6 0 .7 0 .8 0 .9 1 0 25 00 5 000 7500 10 000 12500 1500 0 17500
I ( A/m
2)
V
ce ll(
V
)
91 100 110 120 single-phase flow 。 。 。 。0 0 .05 0.1 0 .15 0.2 0 .25 0.3 0 0.2 0.4 0.6 0.8 1
( y-H
1)/( H
2-H
1)
s
= 9 1 = 1 10 θc 。 θc 。 I=5000A/m2 I=1 0000A/m2 I=1500 0A/m20 0.2 0.4 0.6 0.8 1 0 0 .2 0.4 0 .6 0.8 1
( y-H
1)/( H
2-H
1)
C
g O2/C
g, in O2 = 91 = 11 0sin gle-phase flow θc 。 θc 。 I=150 00A/m2 I=1000 0A/m I=50 00A/m2
0 0.05 0 .1 0.15 0 .2 0.25 0 .3 0.35 0 0.2 0.4 0 .6 0.8 1
( y-H
1)/( H
2-H
1)
s
ε=0.3 ε=0.4 ε=0.5 θc = 91。 θc = 110 。Fig. 3-6 Liquid water saturation profile in the GDL at different GDL porosities and contact angles, I=13000A/m2.
0 0.05 0.1 0.15 0.2 0.25 0.3 0.35 0.4 0 0.2 0.4 0.6 0.8 1
( y-H
1)/( H
2-H
1)
C
g O2/C
g, in O2 0 .3 0 .4 0 .5 θc=91。 θc=110。 single-phase flow ε= ε= ε=Fig. 3-7 Oxygen concentration profile in the GDL at different GDL porosities and contact angles, I=13000A/m2.
0 .3 0 .4 0 .5 0 .6 0 .7 0 .8 0 .9 1
V
ce ll(
V
)
91 11 0sing le-p hase flow θc = 。 θ c = 。 (a) ε= 0. 3 0.3 0.4 0.5 0.6 0.7 0.8 0.9 1
V
ce ll(
V
)
(b) ε= 0.4 0. 3 0. 4 0. 5 0. 6 0. 7 0. 8 0. 9 1 0 2500 5000 7500 10000 12500 15000 17500I ( A/m
2)
V
ce ll(
V
)
(c) ε= 0.5Fig. 3-8 Polarization curve at different GDL porosities and contact angles, (a) ε = 0.3, (b) ε = 0.4, (c) ε = 0.5.
0 0 .05 0.1 0 .15 0.2 0 .25 0.3 0 .35 0 0.2 0.4 0.6 0.8 1
( y-H
1)/( H
2-H
1)
s
200 300 400 θc = 9 1。 θc = 1 10 。 H2-H1= μm H2-H1= μm H2-H1= μmFig. 3-9 Liquid water saturation profile in the GDL at different GDL thicknesses and contact angles, I=14000A/m2.
0 0.05 0.1 0.15 0.2 0.25 0.3 0.35 0 0.2 0.4 0.6 0.8 1
( y-H
1)/( H
2-H
1)
C g O2 /C g, in O2 200 300 400 θc=91。 θc=110。 single-phase flow H2-H1= μm H2-H1= μm H2-H1= μmFig. 3-10 Oxygen concentration profile in the GDL at different GDL thicknesses and contact angles, I=14000A/m2.