Arterial Stiffness Measured as Pulse Wave Velocity is Highly Correlated with
Coronary Artherosclerosis in Asymptomatic Patients
Chiu-Shong Liu1,4, Chia-Ing Li2, Chuen-Ming Shih3, Wen-Yuan Lin1,4, Chih-Hsueh Lin1,4, Shih-Wei Lai1,4, Tsai-Chung Li5,7, Cheng-Chieh Lin1,4,6,7
5
1
Department of Family Medicine, 2Medical Research, and 3Preventive Medicine Center, China Medical University Hospital, Taichung, Taiwan; 4Department of Medicine, 5Graduate Institute of Biostatistics, 6School and Graduate Institute of Health Care Administration, 10
College of Public Health, China Medical University, Taichung, Taiwan; 7Department of Healthcare Administration, College of Health Science, Asia University, Taichung, Taiwan; The first two authors contributed equally to this work.
Short running title: brachial-ankle pulse wave velocity and coronary atherosclerosis
15
Correspondence and reprint request to: Cheng-Chieh Lin, MD, PhD.
Department of Family Medicine, China Medical University Hospital, 20
2, Yuh-Der Road, Taichung, Taiwan 404;
Tel: +886-4-22052121 ext 6077, Fax: +886-4-22031738, E-Mail: [email protected]
ABSTRACT
Aim: Carotid-femoral pulse wave velocity is a well-known predictor of all-cause and cardiovascular mortality. Few studies have evaluated the relationship between brachial-ankle pulse wave velocity (ba-PWV) and coronary artery disease. We conducted this 5
study to elucidate the relationship between arterial stiffness measured by ba-PWV and coronary atherosclerosis.
Methods: An automatic waveform analyzer was used to measure the ba-PWV. Multidetector computed tomography coronary angiography was used to assess coronary artery calcium (CAC) score and to detect coronary stenosis. A total of 654 patients, including 358 women 10
and 296 men (mean age, 54.5±9.4 years), were recruited during the period March 2005 to June 2008.
Results: One hundred and twenty-seven patients (19.4%) had at least one stenotic coronary vessel. Mean ba-PWV and mean CAC score were significantly higher in the stenotic group than in the normal control (15.94±3.07 m/s vs. 14.39±0.98 m/s; 293.1±435.9 vs. 29.8±110.8, 15
respectively; both p <0.001). The adjusted OR for coronary stenosis increased as ba-PWV increased (p for trend=0.0001). Using ba-PWV <14.0 m/s as the reference group, we found that ba-PWV between 14.0-18.0 m/s and ba-PWV>18.0 m/s were significantly associated with coronary stenosis (OR, 2.48; CI, 1.56-3.93 and OR, 3.16; CI, 1.68-5.95 respectively). The cutoff point at 15.64 m/s using the ROC curve showed a sensitivity of 64.5%, specificity 20
of 65.6%, and an AUC of 0.662 in predicting coronary artery stenosis. Ba-PWV had an additional power for identifying coronary artery disease to Framingham risk score.
Conclusions: Ba-PWV correlated well with coronary atherosclerosis. Life style modification
is an efficacious therapeutic intervention for preventing progression of arterial stiffness. This non-invasive technique can assist in the early detection of cardiovascular disease and should 25
Introduction
Although the prevalence of coronary artery disease (CAD) has declined in the United States and in most European countries,1 CAD is still the leading cause of death in Taiwan.2 Arterial stiffness has been shown to be associated with an increased risk of cardiovascular events.3-4 Evaluation of arterial stiffness may assist in the early detection of atherosclerosis.5 5
Pulse wave velocity (PWV) is an indicator of arterial stiffness and a marker of vascular damage.6-8 However, in most of these studies, central PWV rather than peripheral PWV is normally used as an indicator of arterial stiffness.9
Multidetector row computed tomography (MDCT) is available in many general hospitals and enables accurate noninvasive assessment of coronary artery calcification (CAC) 10
and stenosis. 10-11 Few studies have evaluated the relationship between peripheral arterial stiffness and CAD. We conducted this study to elucidate the relationship between
brachial-ankle pulse wave velocity (ba-PWV) and coronary atherosclerosis using 64-slice MDCT in an asymptomatic general population.
Methods Study subjects
All of the 763 individuals that underwent a routine health examination for
cardiovascular disease at the China Medical University Hospital during the period March 2005 to June 2008 were invited to participate in this study. Brachial-ankle PWV and coronary 5
MDCT were included in the examination. Each participant was asked to complete a structured questionnaire designed to collect basic demographic data, medical history, and lifestyle
characteristics.
Participants with a history of myocardial infarction, significant angina pectoris, significant cerebral vascular disease, or documented peripheral arterial disease were excluded 10
from the study. They were all asymptomatic but with one or more risk factors of coronary heart disease. Of the 763 subjects who were invited, 21 patients did not complete the MDCT examination because of arrhythmia such as atrial fibrillation or other causes, 56 had
cardiovascular diseases, and 32 did not sign the consent form. Therefore, the final study population comprised 654 individuals (296 men and 358 women; mean age, 54.5±9.4 years). 15
Measurement of brachial-ankle PWV ankle-brachial pressure index (ABI)
Brachial-ankle PWV (baPWV) was measured using a volume-plethymographic apparatus (from PWV/ABI; Colin Co., Ltd., Komaki, Japan) in accordance with previously described methodology.12-13 This instrument records PWV, blood pressure of four limbs, electrocardiogram, and heart sounds simultaneously. In all patients, baPWV was obtained 20
after at least a 5-min rest in supine position. The interobserver and intraobserver coefficients of variation for the measurement have been reported to be 8.4% and 10.0%, respectively.14 Protocol of 64-slice MDCT
For assessments of calcium scoring, unenhanced cardiac CT was performed with a 64-detector row CT scanner (LightSpeed VCT; GE Medical System, Milwaukee, Wis) using 25
heart from the level of the trachealbifurcation to the diaphragm. The presence of calcification was determined according to the Agatston method 15 for multi-detector row CT with a
130-HU threshold using a computer workstation (Card IQ, Advantage Workstation 4.3; GE Medical System). The vessel and CAC scores were independently determined by two radiologists and were averaged. The intra-assay coefficient of variation for the scoring was 5
<5%.
Contrast-enhanced CT coronary angiography was performed with the same
64-detector row CT scanner using retrospective ECG-gating in a single breath hold. A 70-mL bolus of Iohexol (Omnipaque 350, 350 mg I/mL; GE Healthcare Ireland Cork, Ireland) or Ioversol (Optiray 350, 350 mg I/ml; Tyco Healthcare Montreal, Quebec, Canada) followedby 10
40 mL of saline solution was continuously injected into an antecubitalvein through an 18-gauge catheter at an injection rateof 5 mL/s. Transverse images were transferred to a computer workstation (Card IQ, Advantage Workstation 4.3; GE Medical System) for image post-processing. Two experienced observers ranked the image quality using a three-point ranking scale and analyzed all CT scans for signs of stenosis. In cases of disagreement 15
between the two observers, a final decision was reached by consensus. Significant coronary stenosis was defined as a lumen diameter reduction of greater than 50 % in any segment. Clinical and Laboratory Examinations
The clinical examination included measurement of sitting blood pressure (with a random –zero sphygmomanometer), height, and weight. On the morning of the health 20
examination, an overnight fasting blood sample was collected prior to the electron beam CT and brachial –ankle pulse wave velocity measurement. The blood samples were analyzed for the following parameters using standard techniques with commercial kits: total cholesterol, high-density lipoprotein cholesterol, low-density lipoprotein cholesterol, triglyceride, glucose, uric acid, and high-sensitivity C-reactive protein (hs-CRP). The prediction of coronary heart
25
Statistical Analysis
All data are expressed as mean±SD. Pearson correlation coefficients were used to assess the linear relationship between ba-PWV and coronary artery calcium score. Differences in each variable between any two groups were evaluated using the t-test for continuous
variables and the chi-square test for categorical variables. Because the distribution of the CAC 5
scores was highly skewed, the common log-transformed CAC score [log (CAC score+1)] was used for further analysis. Comparisons of continuous data among three groups were based on the analysis of variance (ANOVA). Multivariate logistic regression analysis was used to test the explanatory effect of each independent variable. The significant effect of each variable was determined by Wald statistic. Receiver operating characteristic (ROC) curves for 10
coronary stenosis and ba-PWV ,CAC score, and FRS were constructed and the area under the curve (AUC) was calculated. All of the analyses were conducted using the SAS software package for Windows, version 9.13. (SAS institute Inc., Cary, NC). P values of <0.05 were considered to be statistically significant.
We certify that all applicable institutional and governmental regulations concerning 15
the ethical use of human volunteers were followed during this research. Ethics approval for patient recruitment and analysis of data was obtained from the Institutional Review Board of the China Medical University Hospital in Taiwan.
Results
The 10-year risk of coronary artery disease calculation using Framingham risk score showed that 70% of the subjects were of the low risk group, 20% were of the moderate risk group, and only 10% of the subjects were of high risk group. Of the 654 study subjects, 127 (19.4%) were diagnosed as having at least one significant coronary stenotic lesion. Table 1 5
shows the basic characteristics of the normal controls and the subjects with coronary artery stenosis. The stenotic group had a higher mean age, body mass index, waist circumference, blood pressure, glucose level, and higher proportion of men than the control group. There were no differences in total cholesterol, triglyceride levels or ankle-brachial pressure index (ABI) between the 2 groups; however, HDL-cholesterol level was significantly lower in the 10
stenotic group than in the control group. In addition, mean ba-PWV and CAC score were significantly higher in the stenotic group than in the normal control group (15.94±3.07 m/s vs. 14.39±0.98 m/s; 293.1±435.9 vs. 29.8±110.8 respectively; both p <0.001).
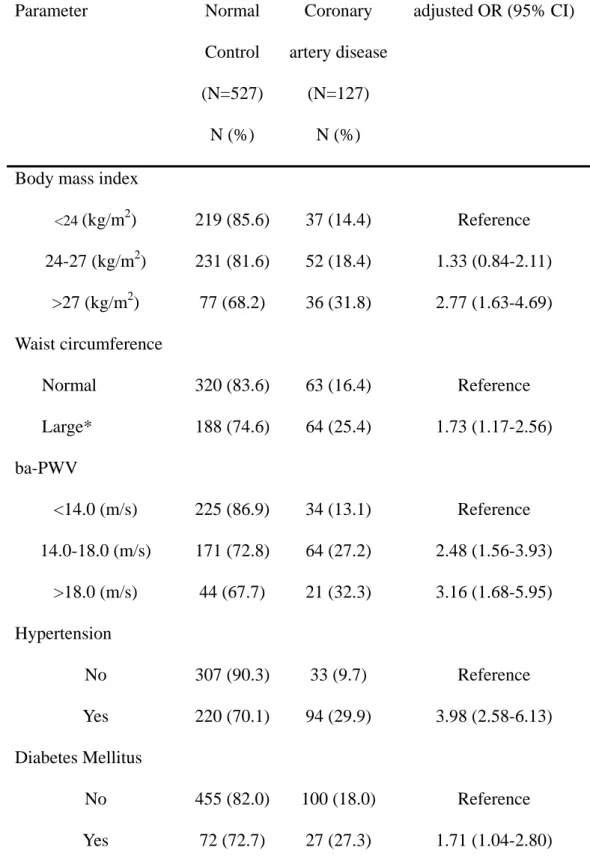
The age- and sex-adjusted OR for coronary artery stenosis was significantly higher in subjects with BMI≧27 Kg/m2 (OR, 2.77; 95% CI, 1.63-4.69) and central obesity (OR, 1.73; 15
95% CI, 1.17-2.56) (Table 2). As expected, hypertension and diabetes mellitus were significantly associated with coronary stenosis (OR, 3.98; 95% CI, 2.58-6.13 and OR, 1.71; 95% CI, 1.04-2.80, respectively). The adjusted OR for coronary stenosis increased as ba-PWV increased (p for trend=0.0001 ). Using ba-PWV <14.0 m/s as the reference group, we found that ba-PWV between 14.0-18.0 m/s and ba-PWV>18.0 m/s were significantly 20
associated with coronary stenosis (OR, 2.48; 95% CI, 1.56-3.93 and OR, 3.16; 95% CI, 1.68-5.95, respectively).
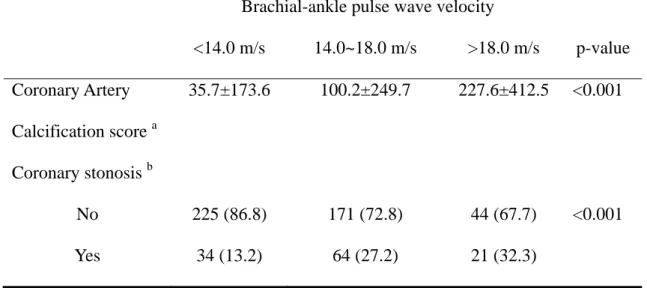
Pearson correlation analysis revealed that ba-PWV was significantly correlated with coronary artery calcium score (r=0.4, p<0.001). CAC score increased as the ba-PWV increased. The mean CAC score was 35.7±173.6 for ba-PWV<14.0 m/s, 100.2±249.7 for 25
Using the ROC curve, we determined the optimal cutoff value of ba-PWV and CAC score that could predict the presence of coronary stenosis (Figure 1). The cutoff value of ba-PWV at 15.64 m/s had a sensitivity of 64.5%, a specificity of 65.6%, and an AUC of 0.662 in predicting coronary artery stenosis. The cutoff value of CAC score at 9.6 had a sensitivity of 80.0 %, a specificity of 79.9 %, and an AUC of 0.853 in predicting coronary stenosis. We
5
further analyze 10-year risk of coronary heart disease calculated by Framingham Risk Score (FRS). Cutoff point of FRS at 11.8% curve showed a sensitivity of 67.0%, a specificity of 71.1%, and an AUC of 0.676. After combination of FRS and ba-PWV, the AUC of ROC curve increased to 0.728. Ba-PWV had an additional power for identifying CAD to Framingham risk score.
Discussion
Pulse wave velocity is an established index of arterial stiffness.17 In the present study, we demonstrated that ba- PWV correlated well with coronary atherosclerosis and stenosis in asymptomatic patients.
A few studies concerning the relationship of ba-PWV and CAD in patients of suspected 5
CAD or CAD equivalent. Tsuchiya M et al found that stiffness in lower- leg arteries are associated with severity of coronary calcification among asymptomatic type 2 diabetic patients. A cutoff point of ba-PWV at 18.0 m/s is a diagnostic value for identifying patients with the highest CAC score.18 Kim et al revealed that ba-PWV at 16.35 m/s had a sensitivity of 73% and a specificity of 75 % in detecting multiple coronary artery disease in Korean 10
patients with diabetes.19 Imanishi R et al revealed that high ba-PWV level (mean: 18.9 m/s vs. 15.2 m/s) is an independent predictor of the presence of CAD in men suspected with heart disease20. Xu et al showed that in suspected CAD patients, a ba-PWV > 18.0 m/s often follows a severe coronary event.21 Our study revealed that in asymptomatic patients, ba-PWV at 15.64 m/s had a sensitivity of 64.5%, a specificity of 65.6%, and an AUC of 0.662 in 15
predicting coronary artery stenosis. Similar result was found by Koji Y et al in an asymptomatic Japanese population.22 These results indicate that the cutoff point of ba-PWV for detecting CAD may be lower in asymptomatic persons that in patients of suspected CAD or CAD equivalent.
The area under the ROC curve in this cross-sectional study indicates that CAC score 20
was better than ba-PWV in predicting the presence of CAD in asymptomatic patients. The values depicting the area under the ROC curve for ba-PWV were somewhat moderate in significance. A similar finding was reported by Tanaka et al. 23 The reason may be related to a lower cardiovascular risk in the Asian population. Further prospective longitudinal studies are warranted to properly address this issue.
25
relevant to CAD risk stratification.6, 24 Carotid-femoral PWV is the gold standard for assessing central arterial stiffness;25 however, a high level of skill and exposure of the inguinal region are required for the measurement and the applicability is limited. The method we used is simple enough to use in clinical practice and community screening. A limitation of measuring the ba-PWV is that this parameter reflects not only elastic arterial stiffness but also 5
muscular arterial stiffness.14 Nonetheless, ba-PWV and carotid-femoral PWV have both been shown to be associated with cardiovascular disease risk factors and clinical events.23 Recently, Tsuchikara S et al also reported that ba-PWV is an index of central arterial stiffness showing similar characteristics to those of central aortic PWV.26 Yu et al reported that ba-PWV correlates better with LV mass and diastolic function and other indices of arterial function 10
than carotid-femoral PWV, probably because ba-PWV encompasses a greater territory of the arterial tree than carotid-femoral PWV.27
Multislice computed tomography angiography is a non-invasive technique that can reliably detect coronary stenosis and quantify the degree of calcified plaque burden.28 Diffuse noncalcified plaques, which may result in blurred contours of the contrast-enhanced lumen, 15
and small noncalcified plaques were not included in this analysis. Therefore, the presence of nonclacified plaques will be underestimated compared with histologic postmortem studies.
In our study, a similar distribution of demographic characteristics between participants and non-participants was found, indicating a random-type selection error. Thus, the biased results in the effect may be toward the null, indicating a lesser threat to validity.
20
In conclusion, the present study revealed that arterial stiffness measured by ba-PWV correlated well with coronary atherosclerosis in a general population in Taiwan. Life style modification such as aerobic exercise and sodium restriction is reported to be an efficacious therapeutic intervention for preventing progression of arterial stiffness29. This non-invasive technique can assist in the early detection of cardiovascular disease and should be included in 25
Conflict of Interest
We certify that all our affiliations with or financial involvement in, within the past 5 years and foreseeable future, any organization or entity with a financial interest in or financial conflict with the subject matter or materials discussed in the manuscript are completely disclosed.
5
Funding
This work was supported by China Medical University Hospital [CMU96-071] and National Science Council [NSC93-2314-B-039-026].
References
1. Grundy SM, Pasternak R, Greenland P, Smith S, Jr., Fuster V. Assessment of
cardiovascular risk by use of multiple-risk-factor assessment equations: a statement for healthcare professionals from the American Heart Association and the American College of Cardiology. Circulation 1999;100(13):1481-92.
5
2. Department of Health T. Statistics on Cause of death; 2010.
3. Cruickshank K, Riste L, Anderson SG, Wright JS, Dunn G, Gosling RG. Aortic
pulse-wave velocity and its relationship to mortality in diabetes and glucose intolerance: an integrated index of vascular function? Circulation 2002;106(16):2085-90.
4. Sutton-Tyrrell K, Najjar SS, Boudreau RM, Venkitachalam L, Kupelian V, Simonsick 10
EM, et al. Elevated aortic pulse wave velocity, a marker of arterial stiffness, predicts cardiovascular events in well-functioning older adults. Circulation
2005;111(25):3384-90.
5. Lehmann ED. Clinical value of aortic pulse-wave velocity measurement. Lancet 1999;354(9178):528-9.
15
6. Safar ME, Levy BI, Struijker-Boudier H. Current perspectives on arterial stiffness and pulse pressure in hypertension and cardiovascular diseases. Circulation
2003;107(22):2864-9.
7. Zieman SJ, Melenovsky V, Kass DA. Mechanisms, pathophysiology, and therapy of arterial stiffness. Arterioscler Thromb Vasc Biol 2005;25(5):932-43.
20
8. Cockcroft JR, Wilkinson IB. Large arterial stiffness: an important therapeutic target. J Hum Hypertens 2000;14(9):533-5.
9. Vlachopoulos C, Aznaouridis K, Stefanadis C. Prediction of cardiovascular events and all-cause mortality with arterial stiffness: a systematic review and meta-analysis. J Am Coll Cardiol 2010;55(13):1318-27.
25
determined by electron beam computed tomography, and coronary disease on arteriogram. Effect of patient's sex on diagnosis. Circulation 1995;91(5):1363-7.
11. Achenbach S, Ropers D, Hoffmann U, MacNeill B, Baum U, Pohle K, et al. Assessment of coronary remodeling in stenotic and nonstenotic coronary atherosclerotic lesions by multidetector spiral computed tomography. J Am Coll Cardiol 2004;43(5):842-7. 5
12. Tomiyama H, Koji Y, Yambe M, Shiina K, Motobe K, Yamada J, et al. Brachial -- ankle pulse wave velocity is a simple and independent predictor of prognosis in patients with acute coronary syndrome. Circ J 2005;69(7):815-22.
13. Motobe K, Tomiyama H, Koji Y, Yambe M, Gulinisa Z, Arai T, et al. Cut-off value of the ankle-brachial pressure index at which the accuracy of brachial-ankle pulse wave
10
velocity measurement is diminished. Circ J 2005;69(1):55-60.
14. Yamashina A, Tomiyama H, Takeda K, Tsuda H, Arai T, Hirose K, et al. Validity, reproducibility, and clinical significance of noninvasive brachial-ankle pulse wave velocity measurement. Hypertens Res 2002;25(3):359-64.
15. Agatston AS, Janowitz WR, Hildner FJ, Zusmer NR, Viamonte M, Jr., Detrano R. 15
Quantification of coronary artery calcium using ultrafast computed tomography. J Am Coll Cardiol 1990;15(4):827-32.
16. Wilson PWF, D’Agostino RB, Levy D, Belanger AM, Silbershartz H, Kannel WB. Prediction of coronary heart disease using risk factor categories. Circulation 1998;97:1837-47.
20
17. Tomiyama H, Yamashina A. Non-invasive vascular function tests: their
pathophysiological background and clinical application. Circ J 2010;74(1):24-33. 18. Tsuchiya M, Suzuki E, Egawa K, Nishio Y, Maegawa H, Inoue S, et al. Stiffness and
impaired blood flow in lower-leg arteries are associated with severity of coronary artery calcification among asymptomatic type 2 diabetic patients. Diabetes Care
25
19. Kim HJ, Nam JS, Park JS, Cho M, Kim CS, Ahn CW, et al. Usefulness of brachial-ankle pulse wave velocity as a predictive marker of multiple coronary artery occlusive disease in Korean type 2 diabetes patients. Diabetes Res Clin Pract 2009;85(1):30-4.
20. Imanishi R, Seto S, Toda G, Yoshida M, Ohtsuru A, Koide Y, et al. High brachial-ankle pulse wave velocity is an independent predictor of the presence of coronary artery 5
disease in men. Hypertens Res 2004;27:71-8.
21. Xu Y, Wu Y, Li J, Ma W, Guo X, Luo Y, et al. The predictive value of brachial-ankle pulse wave velocity in coronary atherosclerosis and peripheral artery diseases in urban Chinese patients. Hypertens Res 2008;31(6):1079-85.
22. Koji Y, Tomiyama H, Yamada J, Yambe M, Motobe K Shiina K, Yamashina A. 10
Relationship between arterial stiffness and the risk of coronary artery disease in subjects with and without metabolic syndrome. Hypertens Res 2007;30:243-7.
23. Tanaka H, Munakata M, Kawano Y, Ohishi M, Shoji T, Sugawara J, et al. Comparison between carotid-femoral and brachial-ankle pulse wave velocity as measures of arterial stiffness. J Hypertens 2009;27(10):2022-7.
15
24. Laurent S, Cockcroft J, Van Bortel L, Boutouyrie P, Giannattasio C, Hayoz D, et al. Expert consensus document on arterial stiffness: methodological issues and clinical applications. Eur Heart J 2006;27(21):2588-605.
25. Adams MR, Robinson J, McCredie R, Seale JP, Sorensen KE, Deanfield JE, et al. Smooth muscle dysfunction occurs independently of impaired endothelium-dependent 20
dilation in adults at risk of atherosclerosis. J Am Coll Cardiol 1998;32(1):123-7. 26. Tsuchikura S, Shoji T, Kimoto E, Shinohara K, Hatsuda S Koyama H, et al. Brachial-
ankle pulse wave velocity as an index of central arterial stiffness. J Atheroscler Thromb 2010;17:658-65
27. Yu WC, Chuang SY, Lin YP, Chen CH. Brachial-ankle vs carotid-femoral pulse wave 25
2008;22(1):24-31.
28. Ohnesorge BM, Hofmann LK, Flohr TG, Schoepf UJ. CT for imaging coronary artery disease: defining the paradigm for its application. Int J Cardiovasc Imaging
2005;21(1):85-104.
29. Tanaka H, Safar ME. Influence of lifestyle modification on arterial stiffness and wave
5
Table 1 Basic characteristics of subjects with and without coronary artery disease
Parameter Normal control
(N=527) Coronary artery disease (N=127) p-value Age (yrs) 53.5±9.9 58.8±9.1 <0.001 Gender Female 332 (63.0) 26 (20.5) <0.001 Male 195 (37.0) 101 (79.5) Waist circumference (m) Female 0.75±0.07 0.84±0.07 <0.05 Male 0.85±0.07 0.92±0.08 <0.05
Body Mass Index (kg/m2) 24.8±3.4 26.1±3.8 <0.05
Mean Blood Pressure (mm Hg) 107.9±13.0 115.8±16.1 <0.001
Cholesterol (mmol/L) 5.27±0.98 5.26±1.08 NS LDL-cholesterol (mmol/L) 3.48±0.91 3.66±0.97 0.06 HDL-cholesterol (mmol/L) 1.11±0.33 1.00±0.23 <0.001 Triglyceride (mmol/L) 1.42±1.00 1.60±1.42 NS Glucose (mmol/L) 5.57±1.34 5.94±1.73 <0.05 hs-CRP (mg/L) 0.21±0.36 0.42±1.56 0.02 ba-PWV (m/s) 14.39±0.98 15.94±3.07 <0.001 CAC score 29.8±110.8 293.1±435.9 <0.001 ABI 1.21±0.29 1.18±0.25 NS Hypertension a 220 (41.7) 94 (74.0) <0.001 Diabetes Mellitus b 72 (13.7) 27 (21.2) <0.001 Hypercholesterolemiac 204 (38.7) 50 (39.4) NS
Smoking current 105 (19.9) 34 (26.8) NS
ex-smoker 68 (12.9) 20 (15.7)
Continuous variables are expressed as mean±SD. Categorical variables are expressed as N (%). Abbreviations: LDL: low density lipoprotein; HDL: high density lipoprotein; hs-CRP: high sensitive C-reactive protein; ba-PWV: brachial-ankle pulse wave velocity; CAC: coronary artery calcification; ABI: Ankle-brachial pressure index
a
Antihypertensive medication and/or high blood pressure (≧140 mmHg systolic or ≧90
5
mmHg diastolic); b Antidiabetic medication and/or fasting glucose ≧7.0 mmol/L; c Lipid-lowering medication and/or total cholesterol ≧5.18 mmol/L.
Table 2 Age- and sex- adjusted odds ratios (OR) for coronary artery disease Parameter Normal Control (N=527) N (%) Coronary artery disease (N=127) N (%) adjusted OR (95% CI)
Body mass index
<24 (kg/m2) 219 (85.6) 37 (14.4) Reference 24-27 (kg/m2) 231 (81.6) 52 (18.4) 1.33 (0.84-2.11) >27 (kg/m2) 77 (68.2) 36 (31.8) 2.77 (1.63-4.69) Waist circumference Normal 320 (83.6) 63 (16.4) Reference Large* 188 (74.6) 64 (25.4) 1.73 (1.17-2.56) ba-PWV <14.0 (m/s) 225 (86.9) 34 (13.1) Reference 14.0-18.0 (m/s) 171 (72.8) 64 (27.2) 2.48 (1.56-3.93) >18.0 (m/s) 44 (67.7) 21 (32.3) 3.16 (1.68-5.95) Hypertension No 307 (90.3) 33 (9.7) Reference Yes 220 (70.1) 94 (29.9) 3.98 (2.58-6.13) Diabetes Mellitus No 455 (82.0) 100 (18.0) Reference Yes 72 (72.7) 27 (27.3) 1.71 (1.04-2.80) *Large waist circumference was defined as ≧0.9 m (male) or ≧0.8 m (female); Abbreviation: CI: confidence interval; ba-PWV: brachial-ankle pulse wave velocity;
Table 3 Trend for coronary calcification and significant coronary stenosis according to the severity of arterial stiffness measured as pulse wave velocity.
Brachial-ankle pulse wave velocity
<14.0 m/s 14.0~18.0 m/s >18.0 m/s p-value Coronary Artery Calcification score a 35.7±173.6 100.2±249.7 227.6±412.5 <0.001 Coronary stonosis b No 225 (86.8) 171 (72.8) 44 (67.7) <0.001 Yes 34 (13.2) 64 (27.2) 21 (32.3) a
Data expressed as mean±SD and analyzed by analysis of variance (ANOVA) test; b
Data expressed as N(%) and analyzed by Chi-square test. 5