科技部補助專題研究計畫成果報告
期末報告
基於學習排序演算法之財務風險排序
計 畫 類 別 : 個別型計畫
計 畫 編 號 : NSC 102-2221-E-004-006-
執 行 期 間 : 102 年 08 月 01 日至 103 年 07 月 31 日
執 行 單 位 : 國立政治大學資訊科學系
計 畫 主 持 人 : 蔡銘峰
計畫參與人員: 碩士班研究生-兼任助理人員:黃文全
碩士班研究生-兼任助理人員:葉書豪
碩士班研究生-兼任助理人員:陳奕安
碩士班研究生-兼任助理人員:劉澤
報 告 附 件 : 出席國際會議研究心得報告及發表論文
處 理 方 式 :
1.公開資訊:本計畫可公開查詢
2.「本研究」是否已有嚴重損及公共利益之發現:否
3.「本報告」是否建議提供政府單位施政參考:否
中 華 民 國 103 年 10 月 31 日
中 文 摘 要 : 資訊檢索是一種從一群資訊中取得與特定需求相關的技術。
由於現今資訊檢索 技術的盛行,許多研究已開始應用相關技
術於不同領域上的資訊分析,如從新聞 與財務報告中提取有
用的資訊。在財務領域中,軟訊息(soft information)通
常是 指文字、意見、想法和市場評論,而硬訊息(hard
information)是指記錄在財務報告中的數字或一些財務指標
(如報酬率與波動度)。在這個計畫中,我使用財務報告中
的軟資訊並結合硬資訊(如公司的歷史股票波動度)依照公
司的風險對公司做排序。財務風險指的是所選擇的投資工具
(如股票)會導致虧損的潛力。在財務領域中,波動度是一
個常用的風險測度,此風險測度會根據多項因素而有所不
同。本計劃的目標是根據真實世界的某個數量對某個實體做
排序。在此計畫中,實體是某個公司與其財務報告,而數量
是未來的股票報酬波動度。具體來說,在此計畫中,我把公
司在一年內的股票報酬波動度分等級,而此風險等級可被視
為公司之間的風險相對關係。在將風險由波動度分為等級之
後,我使用財務報告中的文字對相對應的公司依據其風險程
度排名。另一方面,通過訓練過後的模型,我找出一些有意
義的文字並分析 一個公司的風險與這些文字之間的關係。
中文關鍵詞: 文字排序、波動度、財務報告、學習排序演算法
英 文 摘 要 : Information retrieval (IR) is the activity of
obtaining information resources relevant to an
information need from a collection of information
resources. Due to the prevalence of IR techniques, a
large amount of research focuses on analyzing the
information for different applications, such as
extracting useful information from news and financial
reports. In finance, soft information usually refers
to text, including opinions, ideas, and market
commentary, whereas hard information is always
recorded as numbers in finance reports or financial
measures (such as return and volatility). In this
project, I used both the soft and hard information to
rank the risk of companies.
Financial risk is the potential that a chosen
investment instruments (e.g., stock) will lead to a
loss. In finance, volatility is an empirical measure
of risk and will vary based on a number of factors.
Given a collection of texts, the goal of this project
is to rank entities associated with the texts
according to a real-world quantity. In this project,
the texts are financial reports, which are annually
published by publicly-traded companies; the quantity
is the volatility of stock returns. Specifically, I
split the volatilities of companies within a year
into different risk levels, and these risk levels can
be considered as the relative difference of risk
among the companies. After the splitting, I used the
soft information in the financial reports to rank the
companies in an attempt to keep them in line with
their relative risk levels. On the other hand, via
the trained model, some meaningful terms were
identified and used to analyze the relations between
the risk of a company and these terms.
英文關鍵詞: Text Ranking, Volatility, Financial Report, 10-K
Corpus, Learning to Rank
1 The Background and Goals of the Research Project
M vÓÑ á{¢
1.1 Background
Information retrieval (IR) is the activity of obtaining information resources relevant to an information need from a collection of information resources. Due to the prevalence of IR techniques, a large amount of research focuses on analyzing the information for different applications, such as extracting useful information from news and financial reports.
In finance, soft information usually refers to text, including opinions, ideas, and market commen-tary, whereas hard information is always recorded as numbers in finance reports or financial measures (such as return and volatility) [11]. This work attempts to use soft information in financial reports as factors to rank the risk of companies (i.e., the risk of their stock returns).
Financial risk is the potential that a chosen investment instruments (e.g., stock) will lead to a loss. In finance, volatility is an empirical measure of risk; high volatility means that the price of a stock fluctuates greatly, and low volatility means that the price is almost constant. The volatility will vary based on a number of factors.
This project considers such a ranking problem to be a text ranking problem: Given a collection of texts, the goal is to rank entities associated with the texts according to a real-world quantity. In this work, the texts can be United States SEC1-mandated financial reports, which are annually published
by publicly-traded companies; the quantity can be the volatility of stock returns. Specifically, the volatilities of companies within a year will be splitted into different risk levels, and these risk levels can be considered as the relative difference of risk among the companies. After the splitting, we then use the soft information and hard information in the financial reports to rank the companies in an attempt to keep them in line with their relative risk levels.
Considering the prevalence of big-data analysis techniques, this work uses such techniques to deal with the text ranking problem. Unlike the previous study [5], in which a regression model is employed to predict stock return volatilities via text information, this work utilizes learning-to-rank methods to model the ranking of relative risk levels directly. The reason of this practice is that, via text information only, ranking entities associated with a real-world quantity should be easier than predicting the quantity [5]; that is because the huge amount of noise within soft information (i.e., text information) in financial reports.
Therefore, rather than conducting regressions on the volatility of stock returns, this work ranks the relative risk levels of the companies. This practice is reasonable in some sense, because in finance, some applications usually only concern the relative comparison between quantities rather than their exact values, especially those applications for non-expert investors. Take mutual fund as an example: The mutual funds are usually categorized into several risk levels for investors’ reference. In addition, via text information only, predicting ranks among real-world quantities should be more reasonable than predicting their values because of the weak connection between texts and the predicted quantities. Another example is the following: There are two companies A and B with volatilities 60% and 5%, respectively. For regression, the two absolute values are the goal; however, for ranking, the purpose is
1Securities and Exchange Commission
to rank the two companies correctly despite inaccurate predicted values. Moreover, using the relative comparison of the two companies should be able to further identify key factors behind their finance reports. Namely, as shown in the above example, Company A is more risky than Company B, so there must be some information associated with the riskiness in their financial reports.
1.2 Related Work
In the literature, most text ranking studies are related to information retrieval [9]. Given a query, an information retrieval system ranks documents with respect to their relative relevances to the given query. Traditional models include Vector Space Model [14], Probabilistic Relevance Model [13], and Language Model [12]. In addition to the conventional models, in recent years there have also been some attempts of using learning-based methods to solve the text ranking problem, such as [1, 2, 3], which subsequently brings about a new area of learning to rank in the fields of information retrieval and machine learning. Considering the prevalence of learning-to-rank techniques, this project also attempts to use such techniques to deal with the risk ranking problem via financial reports.
In addition to the developments on learning-to-rank techniques, there have also been some studies conducted on mining financial reports, such as [5, 6, 7]. In [5], Kogan et. al apply a regression approach to predict stock return volatilities of companies via their financial reports; in specific, the Support Vector Regression (SVR) model is applied to conduct mining on text information. On the other hand, there are some studies focusing on predicting risk from financial reports, such as [6], in which the text mining technique is used to detect whether there is a risk within a company, and classify the detected risk into several types. The above two studies both use a classification manner to analyze financial reports. In [7], Lin et. al use a weighting scheme to combine both qualitative and quantitative features of financial reports together, and propose a method to predict short-term stock price movements; in their work, a Hierarchical Agglomerative Clustering (HAC) method with K-means updating is employed to improve the purity of the prototypes of financial reports, and then the generated prototypes are used to predict stock price movements.
2 Methodology
vπ’
This section first describes the mechanism for splitting the volatilities of companies into several risk levels. Then, we formulate our text ranking problem and present how to adopt Ranking Support Vector Machine (SVM) to cope with this problem.
2.1 Risk-Level Splitting Mechanism
In finance, volatility is a common risk metric, which is measured by the standard deviation of a stock’s returns over a period of time. Let Stbe the price of a stock at time t. Holding the stock for one period
from time t 1to time t would result in a simple net return: Rt = St/St 1[15]. The volatility of
returns for a stock from time t nto t can be defined as v[t n,t]=
sPt
i=t n(Ri R)¯ 2
where ¯R =Pti=t nRi/(n+1). Note that, in this project, daily returns of the stock prices are adopted.
We now proceed to classify the volatilities of n stocks into 2` + 1 risk levels, where n, ` 2 {1, 2, 3, · · · }. Let m be the sample mean and s be the sample standard deviation of the logarithm of volatilities of n stocks (denoted as ln(v)).2 The distribution over ln(v) across companies tends to have
a bell shape [5]. Therefore, given a volatility v, we derive the risk level r via:
r = 8 > < > : ` k if ln(v) 2 (a, m usk], ` if ln(v) 2 (m us, m + us), ` + k if ln(v) 2 [m + usk, b), (2)
where a = m us(k + 1) when k 2 {1, · · · , ` 1}, a = 1 when k = `, b = m + su(k + 1) when k2 {1, · · · , ` 1}, b = 1 when k = `, and u is a positive real number. For example, with ` = 2 and u = 1, there are 5 risk levels (i.e., 0, 1, 2, 3, 4):
r = 8 > > > > > > < > > > > > > : 0 if ln(v) 2 ( 1, m 2s], 1 if ln(v) 2 (m 2s, m s], 2 if ln(v) 2 (m s, m + s), 3 if ln(v) 2 [m + s, m + 2s), 4 if ln(v) 2 [m + 2s, 1). (3)
Note that r stands for the concept of relative risk among n stocks; for instance, the stock with r = 4 is much more risky than that with r = 0.
2.2 Problem Formulation
Given a collection of financial reports D = {d1,· · · , dn}, in which each di 2 Rn (which means
each document is an n-dimensional vector) and is associated with a company ci, we aim to rank the
companies via a ranking model f : Rn ! R such that the rank order of the set of companies is
specified by the real value that the model f takes. In specific, f(di) > f (dj)is taken to mean that the
model asserts that ci cj, where ci cj means that ciis ranked higher than cj; that is, the company
ciis more risky than cjin this work.
We adopt Ranking SVM proposed by [3] for this ranking problem; the purpose of Ranking SVM is to minimize the number of discordant pairs while maximizing the margin of pairs. Within a year, if the ground truth (i.e., the relative risk generated by the proposed mechanism) asserts that the company ciis more risky than cj, the constraint of Ranking SVM is hw, dii > hw, dji, where w, di, dj 2 Rn,
and diand djare two n-dimensional word vectors. Then, the text ranking problem can be expressed
as the following constrained optimization problem. min w V (w, ⇠) = 1 2hw, wi + C X ⇠i,j,k s.t. 8 > > > < > > > : 8(di, dj)2 Y1:hw, dii hw, dji + 1 ⇠i,j,1 . . . 8(di, dj)2 Yn:hw, dii hw, dji + 1 ⇠i,j,n 8i8j8k : ⇠i,j,k 0, (4)
2We take the logarithm of volatilities as it is standard in finance.
Year #Documents #Unique terms 1996 1406 19613 1997 2260 26039 1998 2461 29020 1999 2524 30359 2000 2424 30312 2001 2596 32292 2002 2845 38692 2003 3611 48513 2004 3558 50674 2005 3474 53388 2006 3306 51147
Table 1: Statistics of the Datasets.
where w is a learned weight vector, C is the trade-off parameter, ⇠i,j,kis a slack variable, and Ykis a
set of pairs of financial reports within a year.
In this section, we first describe the details of our experimental settings. Then, the results of our ranking approach and the regression-based one are reported.
3 Experiments
3.1 Experimental Settings
3.1.1 Dataset and Risk LevelsIn the United States, the federal securities laws require publicly traded companies to disclose infor-mation on an ongoing basis. A Form 10-K, an annual report required by the Securities and Exchange Commission (SEC), provides a comprehensive overview of the company’s business and financial con-ditions and includes audited financial statements. In this work, the 10-K Corpus [5] is used to conduct the experiments; only Section 7 “management’s discussion and analysis of financial conditions and results of operations” (MD&A) is included in the experiments since typically Section 7 contains the most important forward-looking statements.
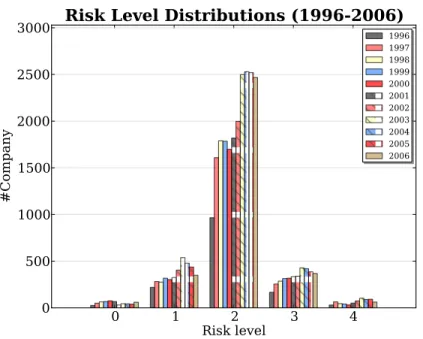
In the experiments, all documents were stemmed by the Porter stemmer, and the documents in each year are indexed separately. Table 1 summarizes the numbers of documents and the unique terms in each year. In addition to the reports, the twelve months after the report volatility for each company can be calculated by Equation (1), where the price return series can be obtained from the Center for Research in Security Prices (CRSP) US Stocks Database. The company in each year is then classified into 5 risk levels (` = 2 and u = 1) via Equation (2). Figure 1 illustrates the statistics of risk levels from year 1996 to 2006.
Figure 1: Distributions of Risk Levels. 3.1.2 Feature Representation
In the experiments, two common word features are used to represent the 10-K reports. Given a document d, two word features (i.e., TF and TF-IDF) are calculated as follows.
• TF(t, d) = TC(t, d)/|d|, where TC(t, d) denotes the term count of t in d and |d| is the length of document d.
• TF-IDF(t, d) = TF(t, d) ⇥ IDF(t, d) = TF (t, d) ⇥ log(|D|/|d 2 D : t 2 d|), where D denotes the set of all documents in each year.
Note that IDF is computed from the documents in a singe year because the document frequency of a specific word may vary across different years.
3.1.3 Evaluation Metrics
Two ranking correlation metrics are used in our experiments: Spearman’s Rho (denoted as ⇢) [10] and Kendall’s Tau (denoted as ⌧) [4]. Given two ranked lists X = {x1, x2,· · · , xn} and Y =
{y1, y2,· · · , yn},
⇢ = 1 6 P
(xi yi)2
n(n2 1) , (5)
⌧ = #concordant pairs #discordant pairs
0.5n(n 1) , (6)
where n is the number of companies in our experiments. In Equation (6), any pair of observations (xi, yi)and (xj, yj)is concordant if the ranks for both elements agree; that is, if both xi xj and
yi yjor if both xj xiand yj yi. In contrast, it is discordant if xi xjand yj yior if xj xi
and yi yj. If xi= xjor yi= yj, the pair is neither concordant nor discordant.
Method 2001 2002 2003 2004 2005 2006 Average Feature: TF Kendall’s Tau
SVR (baseline) 0.522 0.516 0.523 0.496 0.500 0.474 0.505
Ranking SVM 0.508 0.504 0.519 0.498 0.515 0.483 0.505 (0.460) Feature: TF Spearman’s Rho
SVR (baseline) 0.553 0.548 0.555 0.525 0.528 0.500 0.535
Ranking SVM 0.540 0.536 0.551 0.527 0.544 0.509 0.535 (0.474) Feature: TFIDF Kendall’s Tau
SVR (baseline) 0.517 0.536 0.531 0.515 0.515 0.514 0.521
Ranking SVM 0.539 0.549 0.543 0.526 0.539 0.525 0.537* (6.57E-4) Feature: TFIDF Spearman’s Rho
SVR (baseline) 0.549 0.567 0.562 0.545 0.544 0.540 0.551
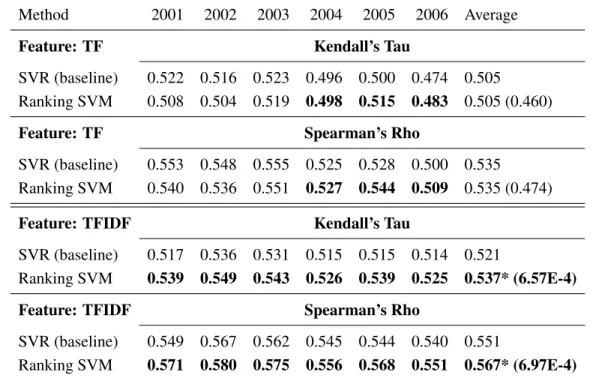
Ranking SVM 0.571 0.580 0.575 0.556 0.568 0.551 0.567* (6.97E-4) Table 2: Experimental Results of Different Methods on Testing Data from Year 2001 to 2006. Numbers in brackets indicate the p-value from a paired t-test. Bold faced numbers denote im-provements over the baseline, and * indicates that the entry is statistically significant from the baseline at 95% confidence level.
3.1.4 Parameter Settings
For regression, linear kernel is adopted with ✏ = 0.1 and the trade-off C is set to the default choice of SVMlight,3which are the similar settings of [5]. For ranking, linear kernel is adopted with C = 1, all
other parameters are left for the default values of SVMRank.4
3.2 Experimental Results
Table 2 tabulates the experimental results, in which all reports from the five-year period preceding the test year are used as the training data (we denote the training data from the n-year period pre-ceding the test year as Tn hereafter). For example, the reports from year 1996 to 2000 constitute
a training data T5, and the resulting model is tested on the reports of year 2001. Since the goal of
this project is to rank the set of companies to keep them in line with to their relative risk levels by using the text information only, only word features (TF and TF-IDF) are considered as training. Two measures, Spearman’s Rho in Equation (5) and Kendall’s Tau in Equation (6), are used to compare the performance of our ranking approach and the regression-based method (SVR) [5]. As shown in the table, with the feature of TF, although not all the results of our ranking approach beat those of the baseline, the two methods are basically comparable. In contrast, with the feature of TF-IDF, our results are significantly better than those of the baseline in terms of both two measures. In addition to
3http://svmlight.joachims.org/
using T5as the training data, we also conduct other 4 sets of experiments with T1, T2, T3, T4to test
the reports from year 2001 to 2006; there are in total 30 testing instances including the experiments with T5. The results show that in terms of both measures, our results with TF-IDF are significantly
better than the baseline.5
4 Discussions and Analyses
w 1996-2000 1997-2001 1998-2002 1999-2003 2000-2004 2001-2005 coven coven nasdaq nasdaq nasdaq nasdaq lender default default lender waiver waiver loss lender coven waiver rais rais default rais waiver coven coven coven discontinu nasdaq amend forbear lender smallcap "+ amend discontinu lender rais delist warrant
# merger acquisit acquisit pension mercer dividend swap swap swap properti dividend pension dividend properti properti swap swap billion properti dividend dividend dividend properti mercer repurchas repurchas repurchas unsecur unsecur unsecur unsecur unsecur unsecur repurchas repurchas repurchas Table 3: Top 6 Positive and Negative Weighted Terms in Each Learned Model.
Bold faced terms denote those appear more than twice in the 6 models. The notation "+ (# )
denotes the weights are increasing positively (decreasing negatively, respectively).
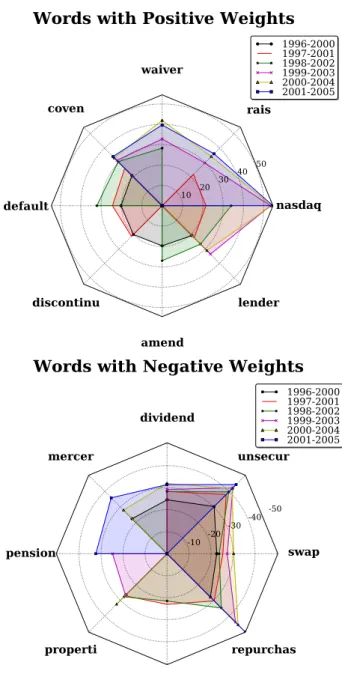
Table 3 lists top 6 positive and negative weighted terms in each of the T5model trained on
TF-IDF. Since the terms in the table are the results after applying stemming, one term may correspond to one or more words, but they are generally with similar meanings. Bold faced terms denote those appearing more than twice in the 6 models; these terms (8 positive and 8 negative) constitute the radar chart in Figure 2, in which each polygon is composed of the weights from each of the 6 learned TF-IDF models. From Table 3 and Figure 2, there are two interesting findings worth mentioning. First, the terms reported by each model are basically consistent. For example, in the right panel of Figure 2, the terms “repurchas,” “unsecur,” and “dividend” appear in all of the 6 models. Secondly, almost all the terms found by our ranking approach are financially meaningful; in addition, some of highly risk-correlated terms are not even reported in [5]. In the next paragraph, we take two positive weighted terms and two negative terms as examples; three of them are only identified by our ranking approach. (Note that the term with a higher weight is associated with higher risk; similarly, that with a lower weight is associated with lower risk.)
5The p-value from a paired t-test for Spearman’s Rho is 1.21E-4 and that for Kendall’s Tau is 7.27E-5.
4.1 Positive Weighted Terms
First, the term “default” is considered. In finance, a company “defaults” when it cannot meet its legal obligations according to the debt contract; therefore, the term “default” is intuitively associated with a relative high risk level. One piece of paragraph quoted from the original report is listed as follows (from AFC Enterprises, Inc. 2006 Form 10-K, before tokenization for readability; boldface added):
As of December 25, 2005, approximately $3.0 million was borrowed under this program, of which we were contingently liable for approximately $0.7 million in the event of de-fault.
Then, we discuss about the term “rais,” which is the stem of the word: raise. We observe that this term usually appears with the terms: dividends, funds, and capitals, when tracing back the original text in the 10-K form. The experimental results suggest that raising one of them (dividends, funds, or capitals) might be associated with a relative high risk of a company. One piece of paragraph quoted from the original report is listed as follows (from A.D.A.M., Inc. Resources, Inc. 2002 Form 10-K, before tokenization for readability; boldface added):
Management believes that cash on hand, together with anticipated cash flow from oper-ations and the proceeds already realized from the Common Stock Purchase Agreement described above will be sufficient to meet our working capital needs through December 31, 2003. However, we may be required to raise additional funds in order to acceler-ate development of new and existing services and products, to respond to competitive pressures or to possibly acquire complementary products, businesses or technologies. In 2005, we increased net income 26% over the prior year to $193 million and increased fully diluted earnings per share 9% to $2.48 despite increased average outstanding debt of $549 million and 11 million additional shares outstanding in 2005 due to our public stock offering in November 2004, both of which were related to acquisitions in the fourth quarter of 2004. Our Board of Directors raised our annual dividend 19% in November 2005, to an annual rate of $1.48 per share. The increase marked the fourth time in three years our Board hasraised the dividend, bringing our payout ratio more in line with other publicly traded energy holding companies and local distribution companies and ensuring a competitive dividend yield relative to alternative investments.
4.2 Negative Weighted Terms
The negative weighted term “repurchas,” the stem of the word “repurchase,” means a company buys back its own shares. In general, share repurchase can be a fairly low-risk approach for companies to use extra cash; this might be a reasonable explanation for the term “repurchas” associated with a relative low risk level. One piece of paragraph quoted from the original report is listed as follows (from AMB Property Corporation 2006 Form 10-K, before tokenization for readability; boldface added):
In December 2005, our board of directors approved a new two-year common stock re-purchase program for the rere-purchase of up to $200.0 million of our common stock.
Full 10-K Document MD&A Subsection
% of Total Fin-Neg Cumulative % of Total Fin-Neg Cumulative
Word Word Count % Word Word Count %
LOSS 9.73% 9.73% LOSS 9.51% 9.51% LOSSES 5.67% 15.40% LOSSES 7.58% 17.10% CLAIMS 3.15% 18.55% IMPAIRMENT 4.71% 21.81% IMPAIRMENT 3.04% 21.59% RESTRUCTURING 2.93% 24.74% AGAINST 2.58% 24.17% DECLINE 2.89% 27.62% ADVERSE 2.44% 26.61% CLAIMS 2.71% 30.33% RESTATED 2.09% 28.70% ADVERSE 2.44% 32.77% ADVERSELY 1.75% 30.45% AGAINST 2.01% 34.78% RESTRUCTURING 1.72% 32.17% ADVERSELY 1.94% 36.72% LITIGATION 1.67% 33.83% LITIGATION 1.67% 38.40%
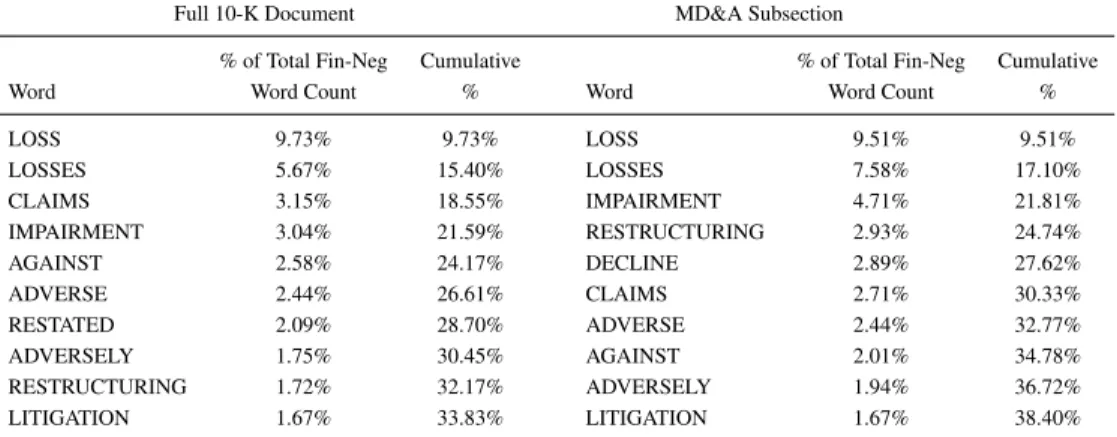
Table 4: Top Ten Most Frequent Terms in Fin-Neg Word List.
The Fin-Neg word list [8] includes negative words from a list of all words occurring in the full sample of 10-Ks filed over 1994 to 2008.
We did notrepurchase or retire any shares of our common stock during the year ended December 31, 2005.
Finally, the term “unsecur,” the stem of the word “unsecured,” is also a highly negative-wighted term in [5], in which a regression-based approach is adopted. In finance, this term almost always co-occurs with the obligations of companies, such as debt; unsecured debt is money that is borrowed but is not secured against any property. This term “unsecur” appears in all of the 6 models with very negative weights (recall Fig. 3), which suggests that to a certain extent unsecured debt is linked to a relative low risk level. One piece of paragraph quoted from the original report is listed as follows (from Amcore Financial, Inc. 2005 Form 10-K, before tokenization for readability; boldface added):
The Company has a commercial paper agreement with an unrelated financial institution (Agent) that provides for the Company to issue non-rated short-termunsecured debt obli-gations at negotiated rates and terms, not to exceed $50.0 million. In the event the Agent is unable to place the Company’s commercial paper on a particular day, the proceeds are provided by overnight borrowings on a line of credit with the same financial institution. This agreement may be terminated at any time by written notice of either the Agent or the Company. As of December 31, 2004, no commercial paper was outstanding, thus, $50.0 million was available, while at December 31, 2003, $40.0 million was available.
4.3 Summary
The terms learned from our ranking approach suggest interesting relations between the text informa-tion in financial reports and the risk levels among companies. As a result, these findings may be of great value for providing us more insight and understanding into financial reports.
5 Conclusion
This project attempts to use soft information to rank the volatilities of companies. Specifically, we tackles a ranking problem with a collection of financial reports. By using the text information in the
reports, we apply learning-to-rank techniques to rank the corresponding companies to keep them in line with their relative risk levels, which can be derived from companies’ stock return volatilities. Our experimental results show that our ranking approach significantly outperforms the regression-based method with a confidence level over 95% in terms of two metrics. Moreover, some financially meaningful words are identified by our approach; some of them are not reported by the regression-based method. As a result, this study is not only of great value for a better understanding of financial reports but demonstrates that by using only the soft information in financial reports, we can further extract meaningful information via the proposed ranking techniques.
Future research directions include:
• We will try to reduce the noise within texts and incorporate Standard Industrial Classification (SIC) into our ranking approach.
• We will try to build a hybrid model consisting of both numerical (hard) and text (soft) informa-tion.
• Via tracing back the original text in financial reports, we observe that some financial terms usually appear together; for example, the term “unsecur“ usually co-occurs with the term debt, We may also take bi-gram or tri-gram models into account in our future work.
• The financial sentiment information [8] (see Table 5) will also be utilized as factors to improve the risk ranking quality.
References
[1] Chris Burges, Tal Shaked, Erin Renshaw, Ari Lazier, Matt Deeds, Nicole Hamilton, and Greg Hullender. Learning to rank using gradient descent. In Proceedings of the 22nd international conference on Machine learning, ICML ’05, pages 89–96. ACM, 2005.
[2] Yoav Freund, Raj Iyer, Robert E. Schapire, and Yoram Singer. An efficient boosting algorithm for combining preferences. J. Mach. Learn. Res., 4:933–969, 2003.
[3] Thorsten Joachims. Training linear svms in linear time. In Proceedings of the 12th ACM SIGKDD international conference on Knowledge discovery and data mining, KDD ’06, pages 217–226. ACM, 2006.
[4] M.G. Kendall. A new measure of rank correlation. Biometrika, 30(1/2):81–93, 1938.
[5] S. Kogan, D. Levin, B.R. Routledge, J.S. Sagi, and N.A. Smith. Predicting risk from financial reports with regression. In Proceedings of Human Language Technologies: The 2009 Annual Conference of the North American Chapter of the Association for Computational Linguistics, pages 272–280. ACL, 2009.
[6] Jochen L. Leidner and Frank Schilder. Hunting for the black swan: risk mining from text. In Proceedings of the ACL 2010 System Demonstrations, ACLDemos ’10, pages 54–59. ACL, 2010.
[7] Ming-Chih Lin, Anthony J. T. Lee, Rung-Tai Kao, and Kuo-Tay Chen. Stock price movement prediction using representative prototypes of financial reports. ACM Trans. Manage. Inf. Syst., 2(3):19:1–19:18, October 2008.
[8] T. Loughran and B. McDonald. When is a liability not a liability? textual analysis, dictionaries, and 10-ks. The Journal of Finance, 66(1):35–65, 2011.
[9] C.D. Manning, P. Raghavan, and H. Schutze. Introduction to information retrieval. Cambridge University Press, 2008.
[10] J.L. Myers and A. Well. Research design and statistical analysis, volume 1. Lawrence Erlbaum, 2003.
[11] M.A. Petersen. Information: Hard and soft. Northwestern University, 2004.
[12] Jay M. Ponte and W. Bruce Croft. A language modeling approach to information retrieval. In Proceedings of the 21st annual international ACM SIGIR conference on Research and develop-ment in information retrieval, SIGIR ’98, pages 275–281. ACM, 1998.
[13] Stephen E. Robertson and Karen Sparck Jones. Relevance weighting of search terms. In Docu-ment retrieval systems, pages 143–160. Taylor Graham Publishing, 1988.
[14] G. Salton, A. Wong, and C. S. Yang. A vector space model for automatic indexing. Commun. ACM, 18(11):613–620, November 1975.
[15] R.S. Tsay. Analysis of financial time series. Wiley-Interscience, 2005.
Risk Ranking from Financial Reports
Ming-Feng Tsai1 and Chuan-Ju Wang2
1 Department of Computer Science Program in Digital Content & Technologies
National Chengchi University Taipei 116, Taiwan [email protected] 2 Department of Computer Science Taipei Municipal University of Education
Taipei 100, Taiwan [email protected]
Abstract. This paper attempts to use soft information in finance to rank the risk levels of a set of companies. Specifically, we deal with a ranking problem with a collection of financial reports, in which each report is associated with a company. By using text information in the reports, which is so-called the soft information, we apply learning-to-rank techniques to rank a set of companies to keep them in line with their relative risk levels. In our experiments, a collection of financial reports, which are annually published by publicly-traded companies, is employed to evaluate our ranking approach; moreover, a regression-based approach is also carried out for comparison. The experimental results show that our ranking approach not only significantly outperforms the regression-based one, but identifies some interesting relations between financial terms.
Keywords: Ranking, Soft Information, Volatility, Financial Report.
1
Introduction
Information retrieval (IR) is the activity of obtaining information relevant to an information need from a collection of information sources. Due to the prevalence of IR techniques, in recent years a large amount of research has started to focus on the retrieved information for different domains, such as analyzing information in financial reports. In finance, soft information usually refers to text, including opinions, ideas, and market commentary, whereas hard information is always recorded as numbers, such financial measures in finance reports [5]. This paper attempts to use soft information to rank the risk levels of a set of companies.
Financial risk is the amount of chance that a chosen investment instrument (e.g., stock) will lead to a loss. In finance, volatility is an empirical measure of risk and will vary based on a number of factors. This paper attempts to use soft information in financial reports as factors to rank the risk levels of a set of companies in terms of their stock return volatilities.
P. Serdyukov et al. (Eds.): ECIR 2013, LNCS 7814, pp. 804–807, 2013. c
⃝Springer-Verlag Berlin Heidelberg 2013
Risk Ranking from Financial Reports 805
We consider such a problem to be a text ranking problem: Given a collection of texts, the goal is to rank entities associated with the texts according to a real-world quantity. In this study, the texts are SEC1-mandated financial reports; the quantity is the volatility of stock returns. In specific, we split the volatilities of company stock returns within a year into different risk levels, which can be considered as the relative difference of risk among the companies; after the splitting, we then use the financial reports to rank the companies in an attempt to keep them in line with their relative risk levels.
Unlike the previous study [3], in which a regression model is employed to predict stock return volatilities via text information, our work utilizes learning-to-rank techniques to model the ranking of relative risk levels directly. The reason of this practice is that, via text information only, predicting the exact values of volatilities should be difficult than predicting the ranks among the values. The difficulty is due to the huge amount of noise within texts [3] and the weak connection between the predicted quantities and texts. Our experimental results show that in terms of two different ranking correlation metrics, our ranking approach both significantly outperforms the regression-based method with a confidence level over 95%.
2
Our Ranking Approach
In finance, volatility is a common risk metric, and it is measured by the standard deviation of a stock’s returns over a period of time. Let St be the price of a stock at time t. Holding the stock for one period from time t − 1 to time t would result in a simple net return: Rt = St/St−1 [6]. The volatility of returns for a stock from time t − n to t can be defined as follows:
v[t−n,t] = ! "t i=t−n(Ri− ¯R)2 n , (1) where ¯R ="t i=t−nRi/(n + 1).
We now proceed to classify the volatilities of n stocks into 2ℓ + 1 risk levels, where n, ℓ ∈ {1, 2, 3, · · · }. Let m be the sample mean and s be the sample standard deviation of the logarithm of volatilities2 of n stocks (denoted as ln(v)). The distribution over ln(v) across companies tends to have a bell shape [3]. Therefore, given a volatility v, we derive the risk level r via:
r = ⎧ ⎨ ⎩ ℓ − k if ln(v) ∈ (a, m − usk], ℓ if ln(v) ∈ (m − us, m + us), ℓ + k if ln(v) ∈ [m + usk, b), (2)
where a = m − s(k + 1) when k ∈ {1, · · · , ℓ − 1}, a = −∞ when k = ℓ, b = m + s(k + 1) when k ∈ {1, · · · , ℓ − 1}, b = ∞ when k = ℓ, and u is a positive
1 Securities and Exchange Commission.
806 M.-F. Tsai and C.-J. Wang
real number. For example, with ℓ = 2 and u = 1, there are 5 risk levels (i.e., 0, 1, 2, 3, 4): r = ⎧ ⎪ ⎪ ⎪ ⎪ ⎨ ⎪ ⎪ ⎪ ⎪ ⎩ 0 if ln(v) ∈ (−∞, m − 2s], 1 if ln(v) ∈ (m − 2s, m − s], 2 if ln(v) ∈ (m − s, m + s), 3 if ln(v) ∈ [m + s, m + 2s), 4 if ln(v) ∈ [m + 2s, ∞). (3)
Note that r stands for the concept of relative risk among n stocks; for instance, a stock with r = 4 is much more risky than another one with r = 0.
After classifying the volatilities of stock returns (of companies) into different risk levels, we formulate our text ranking problem as follows: Given a collection of financial reports D = {d1, d2, d3, · · · , dn}, in which each di ∈ Rd and is
associated with a company ci, we aim to rank the companies via a ranking
model f : Rd → R such that the rank order of the set of companies is specified by the real value that the model f takes. In specific, f (di) > f (dj) is taken to mean that the model asserts that ci ≻ cj, where ci ≻ cj means that ci is ranked higher than cj; that is, the company ci is more risky than cj. In this paper, we adopt Ranking SVM [1] for our text ranking problem.
3
Experiments and Analysis
This paper uses the 10-K Corpus [3] to conduct the experiments; only Section 7 “management’s discussion and analysis of financial conditions and results of
oper-ations” (MD&A) is included in the experiments since typically Section 7 contains the most important forward-looking statements.
Table 1 tabulates the experimental results, in which all reports from the five-year period preceding the testing five-year are used as the training data (we denote the training data from the n-year period preceding the testing year as Tn here-after). For example, the reports from year 1996 to 2000 constitute a training data T5, and the trained model is tested on the reports of year 2001. Since the goal is to rank the risk levels by using text information, only word features are considered; in our experiments, the unigram TF and TF-IDF features are used. Two measures, Spearman’s Rho [4] and Kendall’s Tau [2], are used to com-pare the performance of our ranking approach and that of the regression-based method (SVR) [3]. As shown in the table, with the feature of TF, although not all the results of our ranking approach beat those of the baseline, the two methods are basically comparable. In contrast, with the feature of TF-IDF, our approach significantly outperforms the baseline in terms of both two measures. In addition, via the trained models, we also observe some interesting phe-nomena: for instance, some financial terms usually appear together and indicate high-risk levels. In our dataset, the term “default” usually co-occurs with the term “debt.” In finance, a company defaults when it cannot meet its legal obli-gations according to the debt contract; as a result, the terms of “default” and “debt” is usually associated with a relative high-risk level.
Risk Ranking from Financial Reports 807
Table 1.Experimental Results of Different Methods
Method 2001 2002 2003 2004 2005 2006 Average
Feature: TF Kendall’s Tau
SVR (baseline) 0.522 0.516 0.523 0.496 0.500 0.474 0.505 Ranking SVM 0.508 0.504 0.519 0.498 0.515 0.483 0.505 (0.460)
Feature: TF Spearman’s Rho
SVR (baseline) 0.553 0.548 0.555 0.525 0.528 0.500 0.535 Ranking SVM 0.540 0.536 0.551 0.527 0.544 0.509 0.535 (0.474)
Feature: TFIDF Kendall’s Tau [2]
SVR (baseline) 0.517 0.536 0.531 0.515 0.515 0.514 0.521
Ranking SVM 0.539 0.549 0.543 0.526 0.539 0.525 0.537* (6.57E-4)
Feature: TFIDF Spearman’s Rho [4]
SVR (baseline) 0.549 0.567 0.562 0.545 0.544 0.540 0.551
Ranking SVM 0.571 0.580 0.575 0.556 0.568 0.551 0.567* (6.97E-4)
Numbers in brackets indicate the p-value from a paired t-test. Bold faced numbers denote im-provements over the baseline, and * indicates that the entry is statistically significant from the baseline at 95% confidence level. The twelve months after the report volatility for each company can be calculated by its definition in [3], where the price return series can be obtained from the Center for Research in Security Prices (CRSP) US Stocks Database. The company in each year is then classified into 5 risk levels (ℓ = 2 and u = 1) via Equation (2). For regression, linear kernel is adopted with ϵ = 0.1 and the trade-off C is set to the default choice of SVMlight, which are the
similar settings of [3]. For ranking, linear kernel is adopted with C = 1, all other parameters are left for the default values of SVMRank.
4
Conclusion
This paper uses the soft information in financial reports to rank the risk levels of a set of companies. Specifically, we tackles a ranking problem with a collection of financial reports and apply learning-to-rank techniques to rank the compa-nies to keep them in line with their relative risk levels specified by their stock return volatilities. Our experimental results show that our ranking approach sig-nificantly outperforms the regression-based method with a confidence level over 95% in terms of two different metrics. Future directions include how to incor-porate Standard Industrial Classification (SIC) into our ranking approach and how to develop a hybrid model consisting of both soft and hard information in finance for improving the ranking performance.
References
1. Joachims, T.: Training linear svms in linear time. In: KDD 2006, pp. 217–226 (2006) 2. Kendall, M.: A new measure of rank correlation. Biometrika 30(1/2), 81–93 (1938) 3. Kogan, S., Levin, D., Routledge, B., Sagi, J., Smith, N.: Predicting risk from
finan-cial reports with regression. In: NAACL 2009, pp. 272–280 (2009)
4. Myers, J.L., Well, A.D.: Research design and statistical analysis. Lawrence Erlbaum (2003)
5. Petersen, M.A.: Information: Hard and soft. Northwestern University, document de travail (2004)
2013 10 23
Asian Federation of Natural Language Processing
The 6th International Joint Conference on Natural
Language Processing IJCNLP’2013
2013
10 14
10
18
Nagoya Congress Center
IJCNLP
200
oral presentation
Financial
Sentiment Analysis for Risk Prediction
Chair
NSC 102-2221-E-004 -006 -
2013
10
14
2013
10
18
(
)
(
)
The 6th International Joint Conference on Natural
Language Processing
(
)
This paper attempts to identify the importance of sentiment words in
financial reports on financial risk. By using a finance- specific sentiment
lexicon, we apply regression and ranking techniques to analyze the
relations between sentiment words and financial risk. The experimental
results show that, based on the bag-of-words model, models trained on
sentiment words only result in comparable performance to those on
origin texts, which confirms the importance of financial sentiment words
on risk prediction. Furthermore, the learned models suggest strong
correlations between financial sentiment words and risk of companies.
As a result, these findings are of great value for providing us more
insight and understanding into the impact of financial sentiment words in
financial reports.
(
)
1)
9/17/13 Gmail - Your IJCNLP 2013 Submission (Number 137)
https://mail.google.com/mail/u/0/?ui=2&ik=fbbb332881&view=pt&cat=Paper&search=cat&msg=13fe203804678d12 1/4 Chuan-Ju Wang <[email protected]>
Your IJCNLP 2013 Submission (Number 137)
[email protected] <[email protected]> Mon, Jul 15, 2013 at 7:07 PM To: [email protected]
Dear Chuan-Ju Wang:
On behalf of the IJCNLP 2013 Program Committee, we are delighted to inform you that the following submission has been accepted to appear at the conference:
Title: Financial Sentiment Analysis for Risk Prediction Acceptance category: Accept-Short
The Program Committee worked very hard to thoroughly review all the submitted papers. Please repay their efforts, by
following their suggestions when you revise your paper. Please also make sure that your revised paper conforms to the page limit of the acceptance category. Failure to observe this policy may result in the exclusion of your paper from the conference proceedings.
When you are finished, you can upload your final manuscript at the following site:
https://www.softconf.com/ijcnlp2013/main/
You will be prompted to login to your START account. If you do not see your submission, you can access it with the following passcode:
137X-J8D3C8H4H6
Alternatively, you can click on the following URL, which will take you directly to a form to submit your final paper (after logging into your account):
https://www.softconf.com/ijcnlp2013/main/user/scmd.cgi?scmd=aLogin&passcode=137X-J8D3C8H4H6 Please note that your final, camera ready version should be uploaded
by August 9, 2013. This is a firm deadline, due to the tight production schedule.
The reviews and comments are attached below. Again, try to follow their advice when you revise your paper.
Congratulations on your fine work. If you have any additional questions, please feel free to get in touch.
Best Regards,
Ruslan Mitkov and Jong Park PC co-Chairs, IJCNLP 2013
============================================================================ IJCNLP 2013 Reviews for Submission #137
============================================================================ Title: Financial Sentiment Analysis for Risk Prediction
Financial Sentiment Analysis for Risk Prediction
Chuan-Ju Wang‡, Ming-Feng Tsai†, Tse Liu†, Chin-Ting Chang‡ †Department of Computer Science &
Program in Digital Content and Technology National Chengchi University
Taipei 116, Taiwan
{mftsai, g10120}@cs.nccu.edu.tw
‡Department of Computer Science
University of Taipei Taipei 100, Taiwan [email protected] [email protected] Abstract
This paper attempts to identify the impor-tance of sentiment words in financial re-ports on financial risk. By using a finance-specific sentiment lexicon, we apply re-gression and ranking techniques to ana-lyze the relations between sentiment words and financial risk. The experimental re-sults show that, based on the bag-of-words model, models trained on sentiment words only result in comparable performance to those on origin texts, which confirms the importance of financial sentiment words on risk prediction. Furthermore, the learned models suggest strong correlations between financial sentiment words and risk of com-panies. As a result, these findings are of great value for providing us more insight and understanding into the impact of finan-cial sentiment words in finanfinan-cial reports. 1 Introduction
Sentiment analysis is the task of finding the atti-tudes of authors about specific objects. In recent years, because of the explosion of sentiment infor-mation from social web sites (i.e., Twitter and Face-book), blogs, and online forums, sentiment analysis has become one of the popular research areas in computational linguistics, such as (Narayanan et al., 2009; Mohammad and Turney, 2010).
The growing importance of Sentiment Analy-sis applied to finance brings forth many research and practical issues to minds like “Why Sentiment Analysis is important?” In finance, there have been several studies (Loughran and McDonald, 2011; Price et al., 2012; Garca, 2013) using textual anal-ysis to examine the sentiment of numerous news items, articles, financial reports, and tweets about public companies. Then, the examined sentiments can be used to reflect the correlations with other
fi-nancial measures, such as stock returns and volatil-ities. For most sentiment analysis algorithms, as mentioned in (Feldman, 2013), the sentiment lexi-con is the most important resource. In (Loughran and McDonald, 2011), the Harvard Psychosocio-logical Dictionary, a common dictionary for gen-eral sentiment analysis, is extended to be a finance-specific sentiment lexicon.
In this study, we attempt to use the finance-specific sentiment lexicon to model the relations between sentiment information and financial risk. In specific, we formulate the problem as two differ-ent prediction tasks: regression and ranking. For the regression task, we aim to use sentiment infor-mation to predict a company’s future risk, which is usually characterized by its real-value volatility. Instead of predicting the real-value volatility, in the ranking task, we try to employ sentiments to rank companies according to their relative risk levels. From the two tasks, we observe that, trained on the finance-specific sentiment lexicon only, both the regression models and ranking models can ob-tain comparable performance to those trained on original texts, even though the word dimension is largely reduced from hundreds of thousands to only one and half thousand. In addition, we also conduct some analyses on the learned models, which can provide more insight into the financial sentiments. The remainder of this paper is organized as fol-lows. Section 2 introduces the financial risk mea-sure and describes the problem formulations. In Section 3, we describe the details of our experimen-tal settings and then report the experimenexperimen-tal results. Some discussions and analyses on the learned mod-els are provided in Section 4. Section 5 concludes. 2 Methodology
2.1 Stock Return Volatility
In finance, volatility is a common risk metric mea-sured by the standard deviation of a stock’s returns
over a period of time. Let Stbe the price of a stock
at time t. Holding the stock for one period from time t 1 to time t would result in a simple net return: Rt= St/St 1 1(Tsay, 2005). Therefore,
the volatility of returns for a stock from time t n to t can be defined as follows:
v[t n,t] = sPt
i=t n(Ri R)¯ 2
n , (1)
where ¯R =Pti=t nRi/(n + 1).
2.2 Financial Sentiment Lexicon
For most sentiment analysis algorithms, a senti-ment lexicon is the most crucial resource. As men-tioned in (Loughran and McDonald, 2011), a gen-eral purpose sentiment lexicon might misclassify common words in financial texts. As shown in their paper, almost three-fourths of the words in the 10-K financial reports from year 1994 to 2008, which are identified as negative by the widely used Har-vard Psychosociological Dictionary, are typically not considered negative in financial contexts.
In this paper, we use a finance-specific lexi-con that lexi-consists of the 6 word lists provided by (Loughran and McDonald, 2011) to analyze the relations between these sentiment words and financial risk. The six lists are shown as follows:1
1. Fin-Neg: negative business terminologies (e.g., deficit, default).
2. Fin-Pos: positive business terminologies (e.g., achieve, profit).
3. Fin-Unc: words denoting uncertainty, with em-phasis on the general notion of imprecision rather than exclusively focusing on risk (e.g., appear, doubt).
4. Fin-Lit: words reflecting a propensity for legal contest or, per our label, litigiousness (e.g., amend, forbear).
5. MW-Strong (Strong Modal Words): words ex-pressing strong levels of confidence (e.g., al-ways, must).
6. MW-Weak (Weak Modal Words): words ex-pressing weak levels of confidence (e.g., could, might).
1All these lists are available at http://www.nd.edu/
mcdonald/Word_Lists.html.
2.3 Problem Formulation 2.3.1 Regression Task
Given a collection of financial reports D = {d1, d2, . . . , dn}, in which each di 2 Rp and is
associated with a company ci, we seek to predict
the company’s future risk, which is characterized by its volatility vi. Such a prediction can be defined
by a parameterized function f as follows: ˆ
vi = f (di; w). (2)
The goal is to learn a p-dimensional vector w from the training data T = {(di, vi)|di 2 Rp, vi 2 R}.
Support Vector Regression (SVR) (Drucker et al., 1997) is a popular technique for training such a regression model. SVR is trained by solving the following optimization problem:
min w V (w) = 1 2hw, wi + C n n X i=1 max (|vi f (di; w)| ✏, 0) ,
where C is a regularization constant and ✏ controls the training error. More details about SVR can be found in (Sch¨olkopf and Smola, 2001).
2.3.2 Ranking Task
For the ranking task, our goal is to rank companies by using their financial reports according to the volatilities of stock returns. Following the work in (Tsai and Wang, 2013), we split the volatilities of company stock returns within a year into different risk levels, which can be considered as the relative difference of risk among the companies.
After classifying the volatilities of stock returns (of companies) into different risk levels, the ranking task can be defined as follows: Given a collection of financial reports D, we aim to rank the compa-nies via a ranking model f : Rp ! R such that the
rank order of the set of companies is specified by the real value that the model f takes. In specific, f (di) > f (dj) is taken to mean that the model
asserts that ci cj, where ci cj means that ci
is ranked higher than cj; that is, the company ciis
more risky than cj. In this paper, we adopt Ranking
SVM (Joachims, 2006) for the ranking task. 3 Experiments
This section first describes the details of our exper-imental settings. Then, we report the experexper-imental results of the models trained on the finance-specific
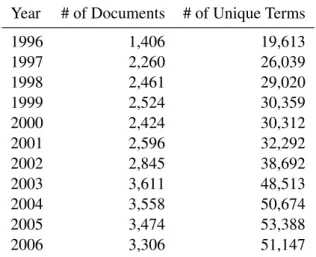
Year # of Documents # of Unique Terms 1996 1,406 19,613 1997 2,260 26,039 1998 2,461 29,020 1999 2,524 30,359 2000 2,424 30,312 2001 2,596 32,292 2002 2,845 38,692 2003 3,611 48,513 2004 3,558 50,674 2005 3,474 53,388 2006 3,306 51,147
Table 1: Statistics of the Corpora.
Dictionary # of Words # of Stemmed Words
Fin-Neg 2,349 918 Fin-Pos 354 151 Fin-Unc 291 127 Fin-Lit 871 443 MW-Strong 19 10 MW-Weak 27 15 Total 3,911 1,664
Table 2: Statistics of the Financial Lexicon. sentiments only and those on original texts for the regression and ranking tasks.
3.1 Experimental Settings
3.1.1 Corpora and Preprocessings
In the United States, the federal securities laws require publicly traded companies to disclose in-formation on a regular basis. A Form 10-K, an annual report required by the Securities and Ex-change Commission (SEC), provides a compre-hensive overview of the company’s business and financial conditions, and includes audited financial statements. In this paper, the 10-K Corpus (Kogan et al., 2009) is used to conduct our experiments, in which only Section 7 “management’s discussion and analysis of financial conditions and results of operations” (MD&A) is used because the section contains the most important forward-looking state-ments about the companies.
For the preprocessing, in our experiments, all documents and the 6 financial sentiment word lists were stemmed by the Porter stemmer, and some stop words were also removed. Table 1 lists the statistics of documents and unique terms in each year. Table 2 shows the statistics before and after
stemming in each of the 6 financial word lists. Note that some words occur in more than one word list, so the number of unique stemmed sentiment words is 1,546 rather than 1,664.
In addition, the twelve months before/after the report volatility for each company (denote as v (12)
and v+(12), respectively) can be calculated by
Equation (1), where the price return series can be obtained from the Center for Research in Secu-rity Prices (CRSP) US Stocks Database. For the ranking task, in order to obtain the relative risks among companies, we categorize the companies of each year into 5 risk levels by following the work in (Tsai and Wang, 2013).
3.1.2 Feature Representation
In our experiments, for the bag-of-words model, two word features are used to represent the 10-K reports. Given a document d, two word features (i.e., TFIDF and LOG1P) are calculated as follows:
• TFIDF(t, d) = TF(t, d) ⇥ IDF(t, d) = TC(t, d)/|d| ⇥ log(|D|/|d 2 D : t 2 d|), • LOG1P = log(1 + TC(t, d)).
Above, TC(t, d) denotes the term count of t in d, |d| is the length of document d, and D denotes the set of all documents in each year. Note that IDF is computed from the documents in a single year because the document frequency of a specific word may vary across different years. Following (Kogan et al., 2009), we also use the logarithm of the twelve months before the report volatility (i.e., log v (12))
as an additional feature. We denote these trained models as TFIDF+ and LOG1P+ hereafter. 3.1.3 Evaluation Metrics
For the regression task, the performance is mea-sured by the Mean Squared Error (MSE) between the predicted (ˆv+(12)
i ) and true log-volatilities
(v+(12) i ). MSE = 1 n n X i=1 ⇣ log⇣v+(12)i ⌘ log⇣vˆ+(12)i ⌘⌘2, where n is the number of tested companies.
For the ranking task, two rank correlation met-rics are used to evaluate the performance in our experiments: Spearman’s Rho (Myers and Well, 2003) and Kendall’s Tau (Kendall, 1938). Given two ranked lists X = {x1, x2, . . . , xn} and Y =
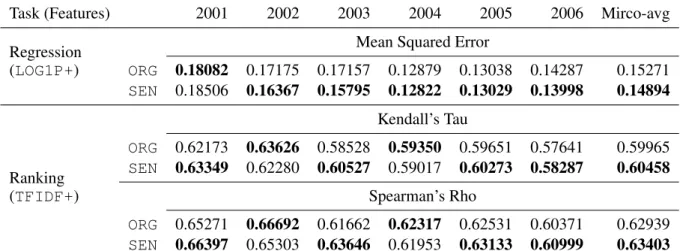
Task (Features) 2001 2002 2003 2004 2005 2006 Mirco-avg Regression Mean Squared Error
(LOG1P+) ORG 0.18082 0.17175 0.17157 0.12879 0.13038 0.14287 0.15271 SEN 0.18506 0.16367 0.15795 0.12822 0.13029 0.13998 0.14894 Kendall’s Tau Ranking ORG 0.62173 0.63626 0.58528 0.59350 0.59651 0.57641 0.59965 SEN 0.63349 0.62280 0.60527 0.59017 0.60273 0.58287 0.60458
(TFIDF+) Spearman’s Rho
ORG 0.65271 0.66692 0.61662 0.62317 0.62531 0.60371 0.62939 SEN 0.66397 0.65303 0.63646 0.61953 0.63133 0.60999 0.63403 Table 3: Experimental Results of Using Original Texts and Only Sentiment Words.
{y1, y2, . . . , yn},
Rho = 1 6 P
(xi yi)2
n(n2 1) ,
Tau = #concordant pairs #discordant pairs 0.5· n · (n 1) . For the measure of Kendall’s Tau, any pair of ob-servations (xi, yi) and (xj, yj) is concordant if
the ranks for both elements agree; that is, if both xi xjand yi yjor if both xj xiand yj yi.
In contrast, it is discordant if xi xjand yj yi
or if xj xi and yi yj. If xi = xj or yi = yj,
the pair is neither concordant nor discordant. 3.1.4 Parameter Settings
For the regression task, linear kernel is adopted with ✏ = 0.1 and the trade-off C is set to the default value of SVMlight,2which are the similar settings
to those in (Kogan et al., 2009). For ranking, linear kernel is adopted with C = 1, all the other parame-ters are set as the default values of SVMRank.3
3.2 Experimental Results
Table 3 tabulates the experimental results, in which the training data is composed of the financial re-ports in a five-year period, the following year of which is the test data. For example, the reports from year 1996 to 2000 constitute a training data, and the learned model is tested on the reports of year 2001.
We compare the performance of the models trained on the original texts (denoted as ORG here-after) with those on only sentiment words (denoted
2http://svmlight.joachims.org/
3http://www.cs.cornell.edu/people/tj/
svm_light/svm_rank.html
as SEN hereafter). In our experiments, the word feature LOG1P is chosen for the regression task and TFIDFfor the ranking one, as suggested in (Ko-gan et al., 2009) and (Tsai and Wang, 2013). Note that in these two studies, their models are trained on the original texts and the results are listed in the row denoted as ORG in Table 3. The bold face number in the table denotes the best result between ORGand SEN. As shown in the table, for the two tasks, the results of using only sentiment words, in most cases, perform better than those of using the original texts.
4 Analysis
4.1 Ranking vs. Regression
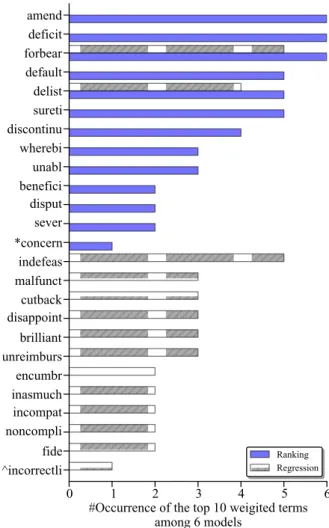
Figure 1 shows the top 10 learned words from both the ranking (TFIDF+) and regression (LOGP+) models trained on sentiment words only (SEN); in addition, the figure also lists the accumulated numbers of these words appearing in the 6 corre-sponding regression or ranking models.
Observe that the words learned from the rank-ing models are much more consistent than those from the regression ones. For example, the words “amend,” “deficit,” “forbear” appear in all of the 6 ranking models; in addition, there are 7 words from the ranking models get the majority vote with more than 4 occurrences, whereas only 3 words from the regression ones occur more than 4 times. On the other hand, there are 11 words from the ranking models and 20 words from the regression ones that occur only one time. The results shown in Fig-ure 1 correlate with the findings in (Tsai and Wang, 2013), which states that adopting the ranking mod-els to analyze the relations between financial risk
Figure 1: Number of Occurrences of the Top 10 Weighted Terms Learned via the Ranking and Re-gression Tasks. The notation * denotes that except the term “concern” there are other terms that occur only one time among 6 ranking models, which are listed as follows: breach, profit, violat, regain, uncomplet, accid, abl, integr, doubt, grantor; similarly, for the notation ^, the terms are: incorrectli, fault, nondisclosur, misus, breakag, defalc, ex-cit, unclear, sentenc, overdu, omit, inforc, irrevoc, unencumb, further, variant, precipit, libel, loss.
and text information might be a more reasonable way than the regression models.
4.2 Financial Sentiment Terms Analysis As shown in Section 4.1, the ranking models can obtain more consistent results than the regression ones. Therefore, in the following discussions, we conduct some analyses on the words learned from the ranking models.
Figure 2 plots the words learned from our rank-ing models. In the figure, the srank-ingle-outline circle denotes that only sentiment words are used as the training data; the double-outline circle denotes that all words in the original texts are considered when training. Moreover, the color filled in a circle with a term denotes which the sentiment word lists the
term belongs to; the circle with 2-mixed colors in-dicates the term belongs to two word lists. Note that the circle area is proportional to the average weight of each term.
In Figure 2, the top 5 average weighted words for the results of each kind of training data are marked by numbers from 1 to 5. For the case of training on sentiment words only (SEN), the top 5 average weighted words are amend, deficit, forbear, delist, default, whereas those under case ORG are ceg, nasdaq, gnb, coven, forbear; only one word forbear overlaps. An interesting finding is that when the models are trained on the original texts, some less informative terms like ceg (a company name, Co-Energy Group), nasdaq (an American stock exchange), gnb (a company name, GNB Tech-nologies), are highly ranked; however, the relation is weak between these words and financial risk. In contrast, as only sentiment words are used for training, it is more reasonable that the terms are highly related to financial risk. In addition, since the terms in the figure have been stemmed, one term may correspond to one or more words. We also list the original words from the sentiment lexi-con for each top 5 average weighted sentiment term in Figure 2. For example, the top 1 weighted term “amend” will have the list containing the words “amend,” “amendable,” “amendatory,” and so on.
Below we provide some original descriptions from 10-K reports that contain the top 2 weighted sentiment words in Figure 2. Note that the term with a higher weight is associated with higher finan-cial risk. First, the term “amend” from the Fin-Lit list is considered. One piece of paragraph quoted from the original report is listed as follows:
(from AGO, 2006 Form 10-K)
On March 22, 2005, we amended the term loan agreements to, among other reasons, lower the borrowing rate by 25 basis points from LIBOR plus 2.00% to LIBOR plus 1.75%.
In finance, the amend usually means “to change by some formal processes.” This top-ranked term indicates that companies amending their policies frequently are associated with relative high risk.
We then discuss the term “deficit” from the Fin-Neg list, which means an excess of liabilities over assets, of losses over profits, or of expenditure over income in finance. Therefore, it is natural to say that a company associated with higher deficit might
amend
deficit
forbear
delist
defaultsureti
discontinu wherebi unabl disput concern profit violat regain uncom -plet accid abl integr grantorceg
nasdaq gnb coven forbear waiver sureti excelsior rais ebix shelbour n placement syndic pfc stage same driver default small-cap seri hearth awg amend libert special benefici sever breach doubt Fin-Neg Fin-Pos Fin-Lit Fin-Unc Non SEN ORG 1 1 2 3 4 5 2 3 4 5 deficit deficits default defaulted defaulting defaults delist delisted deslisting delists amend amendable amendatory amended amending amendment amendments amends forbear forbearance forbearances forbearing forbearsFigure 2: Highly-Weighted Terms Learned from the 6 Ranking Models of Using Original Texts (ORG) and Only Sentiment Words (SEN). The color filled in a circle with a term denotes which the sentiment word lists the word belongs to; the circle with 2-mixed colors indicates the term belongs to two word lists. The single-outline circle denotes that only sentiment words from the 6 dictionaries (see Table 2) are used as the training data; the double-outline circle denotes that the original texts are considered when training. Top 5 terms for the results of each kind of training data are marked by numbers from 1 to 5; the original words from the sentiment lexicon for each top 5 average weighted sentiment terms are also provided.
have higher risk. One piece of paragraph quoted from the original report is listed as follows:
(from AXS-One Inc., 2006 Form 10-K) At December 31, 2005, we had cash and cash equivalents of $3.6 million and a working capital deficit of $3.6 million which included $8.2 million of deferred revenue. The increase of the working capital deficit from $3.3 million at De-cember 31, 2004 is primarily the result of a decrease in cash and decreased ac-counts receivable offset partially by a de-crease in deferred revenue.
5 Conclusions and Future Work
This paper identifies the importance of sentiment words in financial reports associated with financial risk. With the usage of a finance-specific sentiment lexicon, regression and ranking techniques are ap-plied to analyze the relations between the sentiment words and financial risk. The experimental results
show that, based on the bag-of-words model, the models trained on sentiment words only can re-sult in comparable performance to those on origin texts, which attests the importance of the financial sentiment words on risk prediction. In addition, the learned models also suggest strong correlations between financial sentiment words in financial re-ports and the risk of companies. As a result, these findings provide us more insight and understand-ing into the impact of financial sentiment words on companies’ future risk. There are several future work, such as how to use even further information (i.e., syntactic information) for analysis, and how to conduct more fine-grained analysis.
Acknowledgments
This research was partially supported by the Na-tional Science Council of Taiwan under the grants NSC 100-2218-E-133-001-MY2, 101-2221-E-004-017, 102-2221-E-004-006, and 102-2221-E-133-001-MY3.
References
H. Drucker, C.J.C. Burges, L. Kaufman, A. Smola, and V. Vapnik. 1997. Support vector regression ma-chines. Advances in neural information processing systems, pages 155–161.
Ronen Feldman. 2013. Techniques and
applica-tions for sentiment analysis. Communicaapplica-tions of the ACM, 56(4):82–89.
Diego Garca. 2013. Sentiment during recessions. The Journal of Finance (Online Published).
Thorsten Joachims. 2006. Training linear svms in lin-ear time. In KDD ’06, pages 217–226.
M.G. Kendall. 1938. A new measure of rank correla-tion. Biometrika, 30(1/2):81–93.
S. Kogan, D. Levin, B.R. Routledge, J.S. Sagi, and N.A. Smith. 2009. Predicting risk from financial reports with regression. In NAACL ’09, pages 272–280. Tim Loughran and Bill McDonald. 2011. When is a
liability not a liability? textual analysis, dictionaries, and 10-ks. The Journal of Finance, 66(1):35–65. Saif M. Mohammad and Peter D. Turney. 2010.
Emo-tions evoked by common words and phrases: using mechanical turk to create an emotion lexicon. In NAACL HLT 2010 Workshop on Computational Ap-proaches to Analysis and Generation of Emotion in Text, pages 26–34.
J. L. Myers and A. D. Well. 2003. Research design and statistical analysis.
Ramanathan Narayanan, Bing Liu, and Alok Choud-hary. 2009. Sentiment analysis of conditional sen-tences. In EMNLP ’09, pages 180–189.
S McKay Price, James S Doran, David R Peterson, and Barbara A Bliss. 2012. Earnings conference calls and stock returns: The incremental informative-ness of textual tone. Journal of Banking & Finance, 36(4):992–1011.
B. Sch¨olkopf and A.J. Smola. 2001. Learning with ker-nels: Support vector machines, regularization, opti-mization, and beyond.
Ming-Feng Tsai and Chuan-Ju Wang. 2013. Risk rank-ing from financial reports. In Advances in Informa-tion Retrieval, pages 804–807.