國 立 交 通 大 學
電子物理研究所
碩 士 論 文
碲化鎘膠體量子點之能量共振轉移
Resonant Energy Transfer of
CdTe Colloidal Quantum Dots
研 究 生:王威智
指導教授:周武清 教授
碲化鎘膠體量子點之能量共振轉移
Resonant Energy Transfer of
CdTe Colloidal Quantum Dots
研 究 生:王威智 Student:Wei-Jhih Wang
指導教授:周武清 教授 Advisor:Prof. Wu-Ching Chou
國 立 交 通 大 學
電子物理研究所
碩 士 論 文
A Thesis
Submitted to Institute of Electrophysics
College of Science
National Chiao Tung University
in partial Fulfillment of the Requirements
for the Degree of Master
in
Electrophysics
June 2009
Hsinchu, Taiwan, Republic of China
碲化鎘膠體量子點之能量共振轉移
研究生:王威智 指導教授:周武清 教授
國立交通大學電子物理研究所
中文摘要
我們利用光激螢光及時間解析光頻譜技術來分析單一種尺寸(5.1 奈米)與混合兩種 尺寸(3.4 和 5.1 奈米)的水溶性碲化鎘量子點之 Förster 能量共振轉移。 在單一種尺寸樣品中,我們觀察到量子點薄膜之光激螢光能量相較於水溶液有一個 紅移的現象。我們也利用時間解析光譜分析載子的複合機制,發現載子的生命期會隨著 不同量子點尺寸而改變。綜合以上討論可證實載子以非輻射性的方式將能量從小的量子 點轉移到大的量子點。並且發現能量紅移與樣品的尺寸分佈有關。 我們將兩種不同尺寸的量子點混和。從光激螢光光譜上可以觀察到小量子點的螢光 強度受到抑制,伴隨著大量子點的螢光強度增強,這是由於小量子點的放射光譜與大量 子點的吸收光譜之間的重疊增加,導致量子點之間的偶極交互作用力增強,造成明顯且 有效率的能量轉移。 最後,我們發現對於能量轉移的效率而言,小量子點與大量子點的混和濃度比例會 是一個很重要的影響因素。當小量子點與大量子點的混和比例越大,大量子點充分地被 小量子點包圍,提升小量子點的能量轉移效率。小量子點的數量持續增加,大量子點的 比例相對減少,此時小量子點的載子複合機制將不受到大量子點的影響。
Resonant Energy Transfer of
CdTe Colloidal Quantum Dots
Student:Wei-Jhih Wang Advisor:Prof. Wu-Ching Chou
Institute of Electrophysics
National Chiao Tung University
Abstract
The dynamics of Förster resonance energy transfer (FRET) in mono-dispersed (5.1 nm)
and mixed-size (50 % 3.4 nm and 50 % 5.1 nm) water-soluble CdTe quantum dots (QDs)
were studied by using photoluminescence (PL) and time-resolved PL (TRPL) spectroscopy.
A significant PL energy red-shift was observed for the mono-dispersed CdTe colloidal
QDs films when compared with that of the mono-dispersed CdTe colloidal QDs solutions.
The energy dependent TRPL spectra directly reveal the energy transfer from small to large
QDs. We found that the amount of PL energy red-shift is independent of CdTe QDs’ size but
depends on the PL line-width.
To study the effect the spectral overlap of donor emission and acceptor absorption on the
FRET efficiency, a mixture of two different sizes CdTe QDs (50 % 3.4 nm and 50 % 5.1 nm)
was studied. The quenching/enhancement of PL intensity and lifetime of donors/acceptors are
evidences of FRET effect in mixed-size water-soluble CdTe QDs.
FRET rate and the efficiency is firstly enhanced and then decreased. It is due to the fact that
acceptors are surrounded by more and more donors in the beginning. However, the relative
Acknowledgement
研究所的兩年過得還真快,轉眼間就要畢業了。在交大短短的兩年時間內,我遇到 了各式各樣的人事物,也學習到許許多多難得的經驗,雖然在研究的過程中遇到了不少 阻礙我前進的絆腳石,但是在朋友及家人的鼓勵與支持下,我走過來了。在畢業的前夕, 我坐在研究室裡回憶這兩年,心中的感動真是難以言語。 這段時間,我首先要感謝我的指導教授周武清博士,感謝您當年願意讓我加入奈米 科技實驗室這個大家庭,每次咪廳的時候,您不僅會給予我們學術上的建議,也教導我 們不論是現在或是以後都該有的做人處事的道理。還要感謝褚德三教授、楊賜麟教授、 張恆雄教授以及沈志霖教授,感謝各位教授給予我研究上的意見。再來我要特別感謝彥 丞學長,學長的研究精神及實驗的敏銳度、細心度都讓我十分欽佩,在學長的帶領下我 才能夠順利畢業,也恭喜學長在今年得到了博士學位!還要感謝實驗室的各位學長姐妹 們,感謝狗哥、龜泰、崑峯、瑞雯、惠琳、昱璇、李寧和溫博,有了你們的陪伴跟支持, 我才能夠有個多采多姿的研究生活。感謝狗哥在我一進實驗室就很照顧我,雖然你的聲 音很大,但是卻很親切,先預祝狗哥明年可以順利畢業啦!也要感謝崑峯學長對我的照 顧,每當我有研究或是生活上的問題時,你都能耐心分析給我聽並給予我建議,之前腳 踝扭傷事件,你還真是讓我感動耶!還要感謝畢業的繼祖學長在口試那天特別回來給我 支持,你的演講風格讓我十分欽佩,也一直是我學習的目標。另外我還要感謝鏡學、富 凱和俊榮,你們讓實驗室充滿歡樂,我們都很懷念你們,在這也祝福鏡學能順利拿到博 士學位,富凱能早日賺大錢,恭喜俊榮年紀輕輕就當上老師耶! 最後,我要感謝我的家人,爸爸、媽媽、姐姐、妹妹以及小成員咪魯,感謝你們一 路上的支持,特別要謝謝我最親愛的媽媽,謝謝您從我小時候就不斷栽培我、體諒我, 凡事都為我著想,並教導我許多做人做事的道理。也要謝謝我的姐姐,家裡的大小事都 是靠妳在幫忙打理,妳一定要健健康康的喔!我還要感謝我的女朋友 舒洵,在我大學 時期就支持我到現在,這段時間謝謝妳的寬容及體諒,妳的鼓勵跟支持一直是我前進的Contents
Abstract (Chinese version) 〃〃〃〃〃〃〃〃〃〃〃〃〃〃〃〃〃〃〃〃 i
Abstract (English version) 〃〃〃〃〃〃〃〃〃〃〃〃〃〃〃〃〃〃〃〃ii
Acknowledgement 〃〃〃〃〃〃〃〃〃〃〃〃〃〃〃〃〃〃〃〃〃〃〃iv
Contents 〃〃〃〃〃〃〃〃〃〃〃〃〃〃〃〃〃〃〃〃〃〃〃〃〃〃〃v
List of Figures 〃〃〃〃〃〃〃〃〃〃〃〃〃〃〃〃〃〃〃〃〃〃〃〃〃vi
List of Tables 〃〃〃〃〃〃〃〃〃〃〃〃〃〃〃〃〃〃〃〃〃〃〃〃〃ix
Chapter 1. Introduction 〃〃〃〃〃〃〃〃〃〃〃〃〃〃〃〃〃〃〃〃 1
1.1 Colloidal Quantum Dots 〃〃〃〃〃〃〃〃〃〃〃〃〃〃〃〃〃 1
1.2 Förster Resonance Energy Transfer (FRET) 〃〃〃〃〃〃〃〃〃〃 2
1.3 Motivation 〃〃〃〃〃〃〃〃〃〃〃〃〃〃〃〃〃〃〃〃〃〃 4
Chapter 2. Experimental Setup 〃〃〃〃〃〃〃〃〃〃〃〃〃〃〃〃〃 6
2.1 Micro-Photoluminescence System 〃〃〃〃〃〃〃〃〃〃〃〃〃 6
2.2 Time-Resolved Photoluminescence System 〃〃〃〃〃〃〃〃〃〃 7
Chapter 3. Results and Discussion 〃〃〃〃〃〃〃〃〃〃〃〃〃〃〃〃10
3.1 FRET in Mono-Dispersed CdTe Colloidal Quantum Dots 〃〃〃〃10
3.2 FRET in Mixed-Size CdTe Colloidal Quantum Dots 〃〃〃〃〃〃13
3.2.1 Effect of the Spectral Overlap 〃〃〃〃〃〃〃〃〃〃〃〃13
3.2.2 Effect of the Concentration Ratio of Donor to Acceptor 〃〃〃15
Chapter 4. Conclusions 〃〃〃〃〃〃〃〃〃〃〃〃〃〃〃〃〃〃〃〃33
References 〃〃〃〃〃〃〃〃〃〃〃〃〃〃〃〃〃〃〃〃〃〃〃〃〃〃34
List of Figures
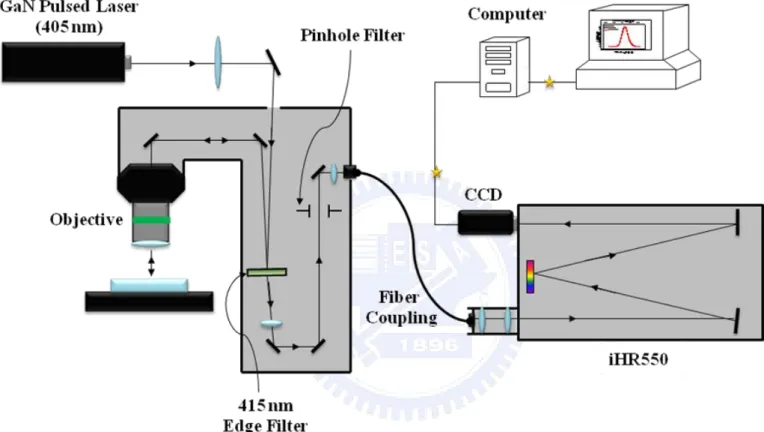
FIG. 2.1. The experimental setup of PL system. 〃〃〃〃〃〃〃〃〃〃〃〃〃〃〃〃〃8
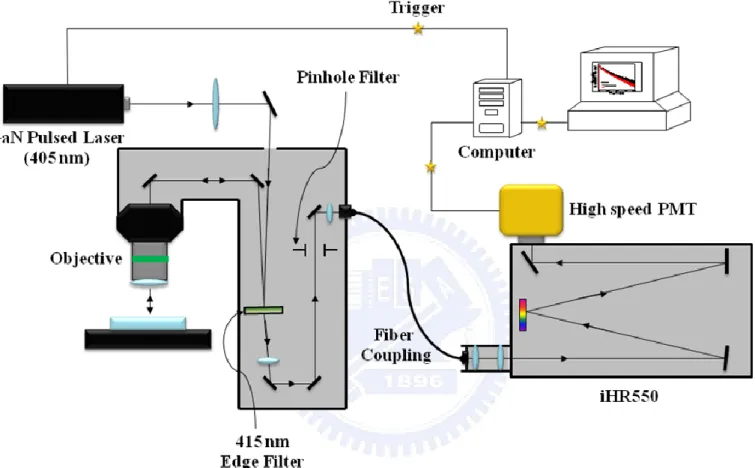
FIG. 2.2. The experimental setup of TRPL system. 〃〃〃〃〃〃〃〃〃〃〃〃〃〃〃〃9
FIG. 3.1. (a) Absorption and normalized PL spectra of mono-dispersed 5.1 nm CdTe QDs
solution at room temperature. (b) Normalized PL spectra of 5.1 nm
mono-dispersed CdTe QDs solution (red line) and film (black
line). 〃〃〃〃〃〃〃〃〃〃〃〃〃〃〃〃〃〃〃〃〃〃〃〃〃〃〃〃〃20
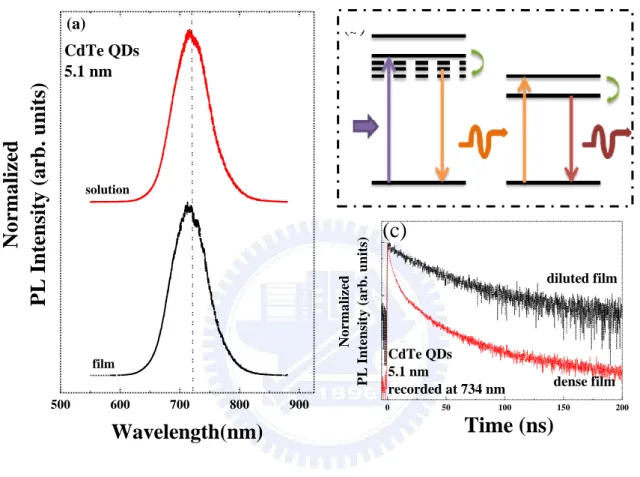
FIG. 3.2. (a) Normalized PL spectra of diluted CdTe QDs solution (red line) and film (black
line). (b) Schematic draw of radiative energy transfer. (c) PL decay curves of
diluted film (black line) and dense film (red line) measured at 734
nm. 〃〃〃〃〃〃〃〃〃〃〃〃〃〃〃〃〃〃〃〃〃〃〃〃〃〃〃〃〃〃21
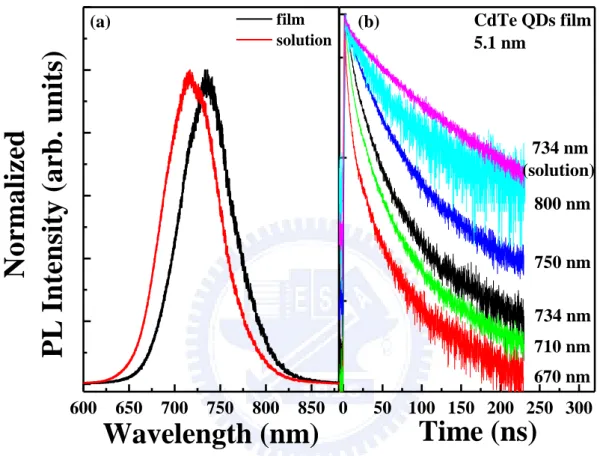
FIG. 3.3. (a) Normalized PL spectra of mono-dispersed 5.1 nm CdTe QDs solution (red line)
and film (black line). (b) TRPL spectrum of 5.1 nm CdTe QDs solution recorded
at 734 nm is also displayed. 〃〃〃〃〃〃〃〃〃〃〃〃〃〃〃〃〃〃〃〃22
FIG. 3.4. Instantaneous PL spectra of the mono-dispersed 5.1 nm CdTe QDs
film. 〃〃〃〃〃〃〃〃〃〃〃〃〃〃〃〃〃〃〃〃〃〃〃〃〃〃〃〃23
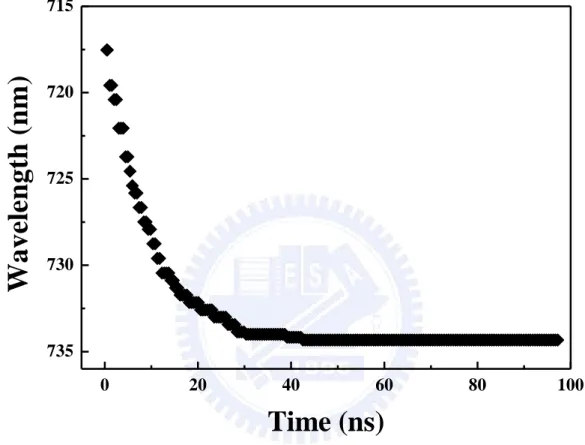
FIG. 3.5. Dynamic red-shift of the PL peak emission of the mono-dispersed 5.1 nm CdTe
nm (triangle) CdTe QDs size. 〃〃〃〃〃〃〃〃〃〃〃〃〃〃〃〃〃〃〃〃25
FIG. 3.7. (a) Absorption (dash line) and normalized PL spectra (solid line) for
mono-dispersed 2.3 nm (blue line), 3.4 nm (green line) and 5.1 nm (red line)
CdTe QDs solution at room temperature. (b) PL spectra for film of 3.4 nm
(green line), 5.1 nm (red line), and mixture of the two (black
line). 〃〃〃〃〃〃〃〃〃〃〃〃〃〃〃〃〃〃〃〃〃〃〃〃〃〃〃〃26
FIG. 3.8. (a) PL decay curves of the pure 3.4 nm CdTe QDs film (green line) and the
mixed-size CdTe QDs film (black line) measured at 635 nm. (b) PL decay curves
of the pure 5.1 nm CdTe QDs film (red line) and the mixed-size CdTe QDs film
(black line) measured at 734 nm. 〃〃〃〃〃〃〃〃〃〃〃〃〃〃〃〃〃〃27
FIG. 3.9. True-color images of the pure donors, pure acceptors, and mixed CdTe QDs in
solutions and films. 〃〃〃〃〃〃〃〃〃〃〃〃〃〃〃〃〃〃〃〃〃〃〃28
FIG. 3.10. (a) PL spectra of mixed-size CdTe QDs solutions with different donor to acceptor
concentration ratios (D/A = 1, 3, and 5). (b) PL spectra of mixed-size CdTe QDs
films with different donor to acceptor concentration ratios (D/A = 1, 3, and
5). 〃〃〃〃〃〃〃〃〃〃〃〃〃〃〃〃〃〃〃〃〃〃〃〃〃〃〃〃〃〃29
FIG. 3.11. (a) PL decay curves of donors detected at 635 nm in the mixed CdTe QDs films
with different D/A ratios. (b) PL decay curves of acceptors detected at 734 nm in
the mixed CdTe QDs films with different D/A ratios. The inset shows the initial
PL decay curves of acceptors. 〃〃〃〃〃〃〃〃〃〃〃〃〃〃〃〃〃〃〃30
of PL spectra of mixed-size CdTe QDs film (D/A = 5). 〃〃〃〃〃〃〃〃〃31
FIG. 3.13. (a) TRPL spectra of donors in mixed-size CdTe QDs films detected at 635 nm for
D/A = 5, 6, 8, and 9. (b) Average PL lifetime of donors (open circles) recorded
at peak position in the mixed-size CdTe QDs films as a function of D/A ratios.
List of Tables
Table 3.1 FWHM for 2.3 nm, 3.4 nm, and 5.1 nm CdTe QDs solution, and the amount of
red-shift for 2.3 nm, 3.4 nm, and 5.1 nm CdTe QDs film. 〃〃〃〃〃〃〃〃〃18
Table 3.2 Amount of spectra overlap, FRET efficiency, FRET rate, Förster critical radius,
and the distance between donor and acceptor for the mixture of two QDs size (3.4
Chapter 1. Introduction
This thesis studies the Förster resonance energy transfer in water-soluble CdTe colloidal
quantum dots (QDs) by using the photoluminescence (PL) and time-resolved PL (TRPL)
spectroscopy. Chapter 1 introduces the optical characteristics and potential applications of
colloidal QDs (Section 1.1). The Förster resonance energy transfer (FRET), which is a
non-radiative dipole-dipole coupling mechanism, is discussed (Section 1.2). The motivation
of this study is also illustrated (Section 1.3). Chapter 2 describes the experimental methods
used in this study. Chapter 3 discusses the FRET mechanism in mono-dispersed and
mixed-size CdTe QDs films. Finally, Chapter 4 summarizes this thesis.
1.1 Colloidal Quantum Dots
Chemically synthesized semiconductor nanocrystals (NCs) or colloidal quantum dots
(QDs) have been studied extensively over the past few years. In QDs, the charge carriers
confined to three dimensions resulting atomic-like electronic energy levels [1]. It is possible
to change their electronic and optical characteristics via tuning their chemical composition,
shapes, and sizes. As the dot size is reduced, the emission energy of QD shifts to high energy
due to quantum confinement effect [2]. Besides, QDs exhibit of high PL quantum yield
(PLQY). Y. He et al. have synthesized high-quality CdTe nanocrystals in aqueous phase by
utilizing illumination methods and the PLQY reaches 98% [3]. Based on tunable band gap
and efficient quantum yield of QDs, they are potential candidates for optoelectronics [4-7].
Furthermore, the photostability of colloidal QDs is higher than classical fluorescence dye
markers [8], colloidal QDs are used to replace fluorophores or dyes for use in biolabeling and
1.2 Förster Resonance Energy Transfer (FRET)
Förster resonance energy transfer (FRET) is a non-radiative dipole-dipole coupling
mechanism, which occurs not only between a molecular pairs or organic dyes but also
between semiconductor QDs. The mechanism governed to a large extent by spectral overlap
between the normalized emission spectrum of small dots (donors) and absorption spectrum of
large dots (acceptors), as well as by the spatial distance between donors and acceptors.
According to the Förster theory, the energy transfer rate is given by [10]
6 0
1
( )
(
)
T D DAR
k r
R
, (1)where D is the lifetime of the donor in the absence of the acceptor and RDA is the distance
between the donor and acceptor. R denotes the Förster critical radius at which the energy 0
transfer efficiency is 50%. The Förster critical radius depends on the overlap between
normalized emission spectrum of donor and absorption spectrum of acceptor. Generally, R 0
is in the range of 15 – 60 Å [11]. R is given by the following equation 0
2 4 1/ 6
0
0.2108[
donor( )]
R
n
J
(Å )
, (2)where 2 is the dipole orientation factor and ranges from 0 to 4, n is the refractive index
of medium, donor is the PL quantum yield of donor in the absence of acceptor, and J( ) is
the integral spectral overlap between the absorption peak of acceptor and emission peak of
donor. J( ) is described as follows
4 0
( )
D( )
A( )
J
F
d
, (3)where FD( ) is the normalized emission spectral of donor and A( ) is the absorption
coefficient of the acceptor. The FRET efficiency () is accounted for the fraction of excitions
1/
T T D T D Tk
k
k
k
k
, (4)Using Eqs. (1), the FRET efficiency can be related to the ratior R : / 0
6 0
1
1 (
R
DA/
R
)
. (5)The FRET efficiency can also obtain from the PL lifetime and PL intensity of the donor,
which are given by [12]
1
M D
, (6)1
M DF
F
, (7)where M and D are the PL lifetime of the donor mixed with acceptors and that of pure
donor, respectively. F and M F are the PL integral intensity of the donor mixed with D
acceptors and that of pure donor, respectively.
Recently, the FRET process between semiconductor QDs has been investigated in
closely packed mixed layers and in separated donor and acceptor layers [13-16]. Feldmann’s
group has demonstrated a cascaded FRET in artificial solids formed by layers of QDs [17].
Efforts to improve the FRET process have been focused on structures with reduced
donor-acceptor QDs’ separation, improved spectral overlap of the donor emission and
acceptor absorption spectra, and increased packing density of the layers. Achermann et al.
have proposed a method to inject excitons from InGaN quantum well into CdSe/ZnS colloidal
QDs indirectly via FRET process. This approach can eliminate the limitation of colloidal QDs
for applications in optoelectronics because the electrical pumping is designed on InGaN
1.3 Motivation
The FRET-related studies, in the past few decades, are all focused on CdSe QDs [19-22].
However, CdSe/ZnS QDs cannot be directly used in biological applications due to their
hydrophobic character. A general approach is to transfer the hydrophobic QDs from the
organic phase to aqueous solution by wrapping an amphiphilic polymer around the particles
[23]. Although this method is efficient, it is relatively complicated. Another effective
approach is to substitute the hydrophilic molecules, which have strong polar groups such as
carboxylic acid or reactive groups such as Si-O-R, for surface-binding TOPO [24]. However,
the PLQY of the CdSe QDs decreases rapidly when the QDs are transferred into water.
Recently, CdTe QDs have attracted much attention because their emission wavelength
can reach near-infrared (better penetrability) range and the QDs exhibit high PL quantum
yield. Most importantly, they are water soluble and can be directly synthesized in aqueous
solution. Therefore, CdTe QDs possess potential for using in biology and optoelectronics.
FRET-related studies in CdTe QDs are recently of increasing interest in both physics and
biology research activities. However, studies on FRET mechanism of mono-dispersed and
mixed-size CdTe QDs still lack in the literature. Xu et al. investigated FRET between CdTe
QDs during the evaporation of the solvent using only PL measurement [25-26]. From the PL
spectra, they found that the integral PL intensity of small dots decrease sharply while that of
the large dots increase only slightly. It implies that the transfer efficiency is quite low and the
FRET process cannot be fully supported in this case due to the lack of TRPL results.
In this thesis, we study the Förster resonance energy transfer in mono-dispersed and
mixed-size CdTe QDs films by using PL and TRPL measurements. In order to shorten the
inter-dot distance, CdTe QDs were drop cast onto glass slide from aqueous solution. After
evaporation, the CdTe QDs deposited on the glass slide and formed a close-packed solid state
FRET efficiency, a mixture of two different sizes CdTe QDs (50 % 3.4 nm and 50 % 5.1 nm)
was studied. We also found that the donor to acceptor concentration ratio in the mixed-size
Chapter 2. Experimental Setup
In this chapter, we will introduce the experimental systems used in this thesis. The
experimental systems include micro-photoluminescence (μ-PL) system and time-resolved
photoluminescence (TRPL) system.
2.1 Micro-Photoluminescence System
The experimental setup of the μ-PL system is shown in Figure 2.1. The samples were
deposited on a glass slide and loaded on the stage of microscope. The GaN pulsed diode laser
(405 nm) was used as an excitation source at room temperature. An incident beam from a
diode laser was focused to about 5 μm in diameter on the sample using a 20x
long-working-distance (~ 20 mm) microscope objective. The PL signal was collected by the
same microscope objective and guided to an optical fiber. The 415 nm edge filter was utilized
to filter out the incident laser light. The iHR550 spectrometer, which is equipped with a
multichannel LN2-cooled charge-coupled device (CCD), was used to analyze the PL spectra.
The spectrometer is controlled by a computer which is also used to store and plot the collected
2.2 Time-Resolved Photoluminescence System
The experimental setup of TRPL system is similar to the PL system and shown in Figure
2.2. The only differences are: (1) the trigger from the pulsed laser diode is used to define the
start (t = 0) of decay profile, (2) a high speed PMT instead of CCD is used the detect the PL
signal. The diode laser produces light pulses with a repetition rate of 2.5 MHz. The signals
were further analyzed by a Time Harp counting card, which was triggered with a signal from
the diode laser. The decay traces were recorded using the time-correlated single photon
counting technique (Time-Harp, PicoQuant). The overall temporal resolution is around 400
ps.
Chapter 3. Results and Discussion
In this chapter, we study the FRET dynamics in close-packed CdTe colloidal QDs films
via PL and TRPL measurements. In Section 3.1, the FRET mechanism in mono-dispersed
CdTe colloidal QDs films will be discussed. In Section 3.2, we discuss the FRET mechanism
in mixed-size CdTe QDs films. In addition, the FRET of the mixed-size CdTe QDs films with
different donor to acceptor concentration ratios will also be investigated.
3.1 FRET in Mono-Dispersed CdTe Colloidal Quantum Dots
Figure 3.1(a) shows PL emission and absorption spectra of mono-dispersed CdTe QDs
(D = 5.1 nm) solution (1.0 × 10⁻⁵ M). The PL emission peak is situated at ~ 719 nm. The
CdTe QDs were then drop cast onto glass slide from aqueous solution. After evaporation, the
CdTe QDs deposited on the glass slide and formed a close-packed solid state film. Figure
3.1(b) displays the PL spectra of 5.1 nm mono-dispersed CdTe QDs solution and film. An
energy red-shift of about 40 meV can be observed for the QDs film. This energy red-shift
could be caused by (1) the change of QDs’ surface environment (oxidation) and (2) energy
transfer among QDs. In the case of (2) energy transfer among QDs, the red-shift should be
influenced by the inter-dot distance. On the other hand, the change of surface environment
(oxidation) is not sensitive to the inter-dot distance. In order to identify the origin of the
energy red-shift, a diluted CdTe QDs solution (1.0 × 10⁻⁷ M) was prepared and drop cast
onto glass slide. Figure 3.2(a) shows the PL spectra of diluted CdTe QDs solution and film.
We found that indeed the profile and the peak position of the normalized PL spectra remain
the same as shown in Figure 3.2(a). Thus, we conclude that such a large energy red-shift in
the close-packed film is attributed to the existence of energy transfer.
Energy transfer, including radiaive energy transfer and non-radiative energy transfer,
(see Figure 3.2(b)): a photon emitted by a donor is absorbed by an acceptor (reabsorption).
Under the process of radiative transfer, the average distance between donor and acceptor
must be larger than the wavelength and the fluorescence lifetime of donors is unchanged
[11]. In our system, the inter-dot distance in the dense film is approximately 7 nm. Figure
3.2(c) presents the TRPL spectra of dense and diluted film recorded at 734 nm. The lifetime
in the dense film (6.5 ns) is shorter than in the diluted film (40.0 ns). Therefore, the energy
red-shift accompanied with the quenching of lifetime of small QDs is evidence of FRET
effect between proximal QDs.
The non-radiative energy transfer by dipole-dipole interactions in mono-dispersed CdTe
QDs film can be further confirmed by wavelength dependent TRPL measurements. Figure
3.3(a) displays PL spectra of mono-dispersed 5.1 nm CdTe QDs solution (1.0 × 10⁻⁵ M) and
film. Figure 3.3(b) shows the TRPL spectra of mono-dispersed 5.1 nm CdTe QDs film as a
function of wavelength (from 670 to 800 nm). A TRPL spectrum of the solution recorded at
734 nm is also displayed in Figure 3.3(b). In order to resolve the time constants, all of the
decay curves were analyzed by two PL decay times, the initial (fast) and the slow PL decay
time. In Figure 3.3(b), as the dot size increases, the initial PL decay time increase from 2.8
ns (at 670 nm) to 31.0 ns (at 800 nm), indicating the energy transfer from small to large dots
right after the initial excitation. However, the slow decay time remains constant (52.0 ns)
throughout the whole spectrum range. The decay time of CdTe QDs solution at 734 nm is
about 55.0 ns, which is very close to the slow decay time of the film. Due to the large
inter-dot distances in the solution, the dipolar coupling effect between adjacent QDs can be
neglected. Thus, the decay time origins from the QDs in the absence of energy transfer
process. This implies that the slow decay times of the film origin from a subset of CdTe QDs
in the film do not participate in energy transfer because of the absence of proximal resonant
QDs film. After the excitation of the mono-dispersed 5.1 nm CdTe QDs film, the PL
emission is peaked at 719 nm. It is identical with the emission from the 5.1 nm CdTe QDs
solution. The emission peak shifts to the red rapidly before 20.0 ns and then becomes almost
constant at 734 nm after 40.0 ns. Figure 3.5 shows the dynamic red-shift of the PL peak
emission of the mono-dispersed 5.1 nm CdTe QDs film. It indicates that all excitons transfer
from small to large dots and the transfer process will be suppressed as time passes [13].
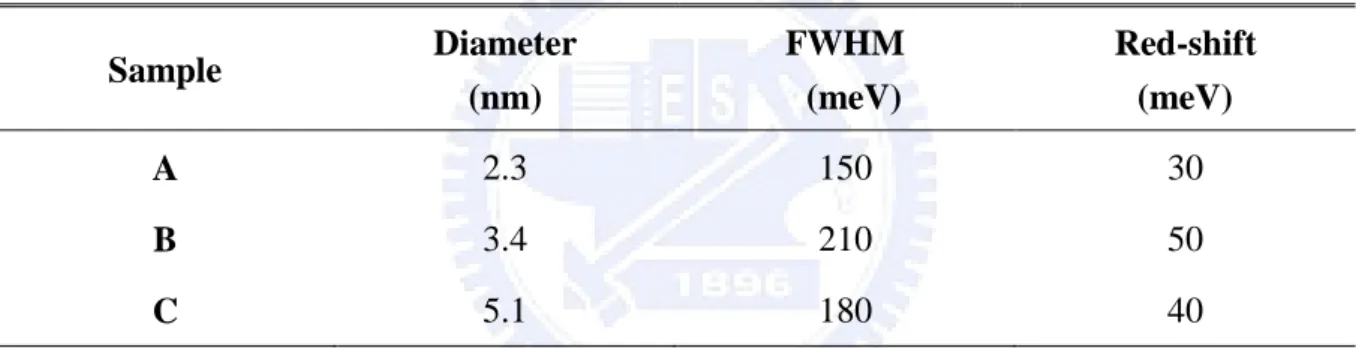
The red-shift of PL energy can also be observed in CdTe QDs films with different dot
sizes (2.3 nm and 3.4 nm in this study). We found that the amount of PL energy red-shift is
independent of CdTe QDs’ size but depends on the PL linewidth of the sample. Figure 3.6
plots the PL energy shift (ΔE) versus full width at half maximum (FWHM) of the CdTe QDs.
The data are also listed in Table 3.1. Obviously, as the FWHM of the CdTe QDs increases,
the PL energy red-shift increases. It suggests that the broader the dot size distribution, the
larger the spectral overlap between the emission of small dots and absorption of large dots.
3.2 FRET in Mixed-Size CdTe Colloidal Quantum Dots
In this section, we discuss the mixed-size CdTe QDs films. In Section 3.2.1, a mixture of
two different sizes CdTe QDs film will be studied. In Section 3.2.2, the influences of donor to
acceptor concentration ratios in mixed-size CdTe QDs films will be discussed.
3.2.1 The Dependence of FRET on Spectral Overlap
in Mixed-Size CdTe QDs
Figure 3.7(a) shows absorption and PL spectra of 2.3, 3.4, and 5.1 nm CdTe QDs in
aqueous solution at room temperature. To study the mechanism of the FRET, we prepare a
mixed solution having 50 % of 3.4 nm dots and 50 % of 5.1 nm dots (with larger spectral
overlap) in water. The small (large) dots play of the role of donors (acceptors). Figure 3.7(b)
displays the PL spectra of pure donors, pure acceptors, and the mixed films. The PL peak
energy for the films exhibits an energy red-shift as compared with that of the solutions. This
is because the energy transfer between proximal dots due to QDs’ size distribution discussed
in Section 3.1. Moreover, we observe that the PL intensity of donors quench and that of
acceptors enhance in the mixed film. It is attributable to the electronic energy transfer from
donors to acceptors, since the inter-dot distance between donors and acceptors are reduced
[14,28].
Further evidences for energy transfer in the mixed film were obtained from TRPL
measurements. Figure 3.8(a) shows fluorescence decay curves for the pure donors and mixed
films monitored at the peak (635 nm) energy. The decay rate of the mixed film clearly
increases with respect to the pure donors. Furthermore, in Figure 3.8(b), the decay rate of the
mixed film recorded at peak (734 nm) position decreases with respect to the pure acceptors.
TRPL (Figure 3.8) spectra are consistent with FRET from donors to acceptors [14,28].
Figure 3.9 shows true-color images of the pure donors, pure acceptors, and mixed CdTe
QDs in solutions and films. The images of pure donor (acceptor) QDs in both solution and
film exhibit light red (dark red). The image of the mixed QDs solution presents the color
between light red and dark red. However, the image of the mixed QDs film displays almost
the same color (dark red) with the pure acceptors. It implies that the decrease of the inter-dot
distance in the mixed film results in more efficient FRET between donors and acceptors [25].
To have a quantitative understanding of FRET mechanism, we fit the PL decay curves by
the bi-exponential function and then obtain the average lifetime of donors [12]. As can be
seen in Figure 3.8(a), the lifetime of donors in the mixed film (4.2 ns) is faster than that of
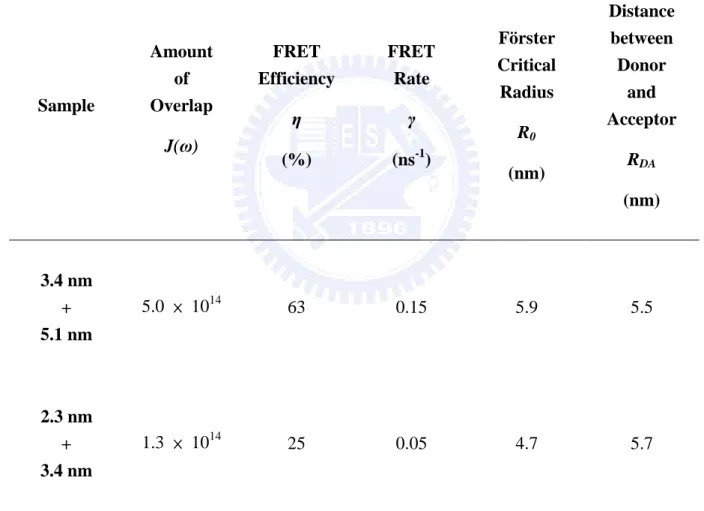
pure donors (11.3 ns). The FRET efficiency (η ~ 63 %) can be calculated using Eq. (5). The
value is larger than the FRET efficiency (η ~ 25 %) of the mixture film of 2.3 and 3.4 nm
CdTe QDs. The increased FRET efficiency is mainly attributed to the increase of spectral
overlap between donor emission and acceptor absorption, which is listed in Table 3.2. From
Eq. (2), the critical distance of FRET (R0) is calculated to be 5.9 nm which closes to the value
of 4.7 nm of CdSe QDs reported previously [14,27]. Using Eq. (4), the inter-dot distance (RDA
~ 5.5 nm) between donors and acceptors can also be obtained. The FRET rate γ is 0.15 ns-1
and it is calculated by Eq. (1). All of the FRET parameters discussed are shown in the Table
3.2. Our results demonstrate that it is feasible to investigate the influence of inter-dot distance
and spectral overlap between donor emission and acceptor absorption on the coupling system
3.2.2 The Dependence of FRET on Donor to Acceptor
Concentration ratios in Mixed-Size CdTe QDs
In this section, we discuss the dependence of FRET on the donor to acceptor
concentration ratios (D/A) in the mixed-size CdTe QDs films. Figure 3.10(a) shows the PL
spectra of mixed-size CdTe QDs solutions with different donor to acceptor concentration
ratios (D/A = 1, 3, and 5). As the ratio is increased, the PL intensity of donors is strongly
enhanced. Slightly increases in PL intensity of acceptors can be assigned to the spectral
overlap between the emissions of donors and acceptors. FRET from donors to acceptors in the
mixed solution can be ruled out, since no obvious lifetime changes in both donors and
acceptors as the ratio increases. Figure 3.10(b) shows the PL spectra of mixed-size CdTe QDs
films with different donor to acceptor concentration ratios (D/A = 1, 3, and 5). In comparison
with the experimental results shown in Figure 3.10(a), as the donor increases, the PL intensity
of acceptors is significantly enhanced. This indicates that the efficiency of FRET from donors
to acceptors is enhanced because acceptors are surrounded by more and more donors [28].
Figure 3.11(a) displays the PL decay curves of donors detected at 635 nm in the mixed
CdTe QDs films with different D/A ratios. Figure 3.11(b) displays the PL decay curves of
acceptors in the mixed CdTe QDs films with different D/A ratios detected at 734 nm. With an
increasing amount of donors, the lifetime of donors (acceptors) in the mixed CdTe QDs film
decreases (increases). As can be seen shown in the inset of Figure 3.11(b), the lifetime curves
of acceptors in the mixed CdTe QDs films with high D/A ratios exhibit pronounced prolonged
excitation during the first few nanoseconds. It is because the magnitude of donor per acceptor
is increased and the large number of excitation energy will be transferred from donors to
acceptors over first several nanoseconds. The prolonged excitation of acceptors in the mixed
the energetic feeding of the acceptors lasts over several nanoseconds, even though the
emission of the donors drops within the first nanosecond. Franzl et al. reported that excitation
energy in small CdTe QDs can be trapped and subsequently be transferred in a stepwise
manner to the layer of large QDs [29]. Because the trapped excitations of donors do not
contribute to fluorescence, the trapped excitation is not visible in the decay curves of the
donors in the mixed film as shown in Figure 3.11(a). However, after the transfer of the
trapped excitations to proximal acceptor, the excitations become visible again through the
emission from acceptor which is called trapped exciton recycling effect. The simultaneous
occurrence of decreasing of the donor decay time and feeding of acceptor decay time provides
a strongly evidence of FRET.
Figure 3.12(a) shows the TRPL image of mixed-size CdTe QDs film (D/A = 5). Initially
after excitation, the donor emission is peaked at 615 nm and the acceptor emission is peaked
at 719 nm. Besides, the PL intensity of donors is about three times higher than that of
acceptors. As time passes, the PL intensity of donors falls sharply and the emission from
acceptors dominates the whole spectrum. Moreover, the PL emission peaks of donors and
acceptors shift dramatically towards the low energy side within the first 10.0 ns after
excitation. It indicates that the excitons are in the process of energy transfer from small dots to
large dots, resulting in the quenching of PL intensity and lifetime of donors as well as an
enhancement of acceptors. Beyond 10.0 ns, the emission peak is almost constant at 635 and
734 nm for donors and acceptors, respectively, revealing that all excitons have transferred to
large dots and the energy transfer is suppressed. The dynamics of energy transfer can be
further depicted by the temporal evolution PL spectra as shown in Figure 3.12(b).
In order to investigate the dependence of FRET on the D/A ratios to an extended range,
mixed-size CdTe QDs films with the ratio of 6, 7, 8, and 9 were further studied. Figure 3.13(a)
shows the TRPL spectra of donors in mixed-size CdTe QDs films detected at 635 nm for D/A
increases and approaches that of pure donors. Figure 3.13(b) plots the average PL lifetime of
donors recorded at peak position in the mixed-size CdTe QDs films as a function of D/A
ratios. As the ratio is increased from 1 to 6, the FRET rate is changed from 0.13 to 0.93 ns-1
and the efficiency is changed from 63 to 91 %. This is because acceptors are surrounded by
more and more donors. It can be estimated that each acceptor dot is approximately surrounded
with six donor dots when the ratio is 6 [25]. However, as the ratio is further increased and
reached 9, the lifetimes of donors is increased and approached to that of pure donors. It is
because the relative amount of available acceptors is decreased, i.e. the donor emission
dominates the entire PL spectrum.
Table 3.1 FWHM for 2.3 nm, 3.4 nm, and 5.1 nm CdTe QDs solution, and the amount of
red-shift for 2.3 nm, 3.4 nm, and 5.1 nm CdTe QDs film.
Sample Diameter (nm) FWHM (meV) Red-shift (meV) A 2.3 150 30 B 3.4 210 50 C 5.1 180 40
Table 3.2 Amount of spectra overlap, FRET efficiency, FRET rate, Förster critical radius,
and the distance between donor and acceptor for the mixture of two QDs size (3.4 nm + 5.1
nm and 2.3 nm + 3.4 nm). Sample Amount of Overlap J(ω) FRET Efficiency η (%) FRET Rate γ (ns-1) Förster Critical Radius R0 (nm) Distance between Donor and Acceptor RDA (nm) 3.4 nm + 5.1 nm 5.0 × 10¹⁴ 63 0.15 5.9 5.5 2.3 nm + 3.4 nm 1.3 × 10¹⁴ 25 0.05 4.7 5.7
400 500 600 700 800 900 0.0 0.2 0.4 0.6 0.8 1.0 0.0 0.2 0.4 0.6 0.8 1.0 (a)
P
L
I
n
te
n
sit
y
(
a
rb
.
u
n
it
s)
A
b
so
rp
tio
n
(
a
rb
.
u
n
it
s)
Wavelength (nm)
CdTe QDs solution 5.1 nm 600 650 700 750 800 850 film solution CdTe QDs 5.1 nmWavelength (nm)
N
o
rm
a
liz
ed
P
L
I
n
te
n
sit
y
(
a
rb
.
u
n
it
s)
(b)FIG. 3.1. (a) Absorption and normalized PL spectra of mono-dispersed 5.1 nm CdTe QDs
solution at room temperature. (b) Normalized PL spectra of 5.1 nm mono-dispersed CdTe
FIG. 3.2. (a) Normalized PL spectra of diluted CdTe QDs solution (red line) and film (black
line). (b) Schematic draw of radiative energy transfer. (c) PL decay curves of diluted film
(black line) and dense film (red line) measured at 734 nm. (b) 500 600 700 800 900 (a) film
N
o
rm
a
liz
ed
P
L
I
n
te
n
sit
y
(
a
rb
.
u
n
it
s)
Wavelength(nm)
CdTe QDs 5.1 nm solution 0 50 100 150 200(c)
CdTe QDs 5.1 nmrecorded at 734 nm dense film
Time (ns)
N o rm a liz ed P L I n te n sit y ( a rb . u n it s) diluted filmFIG. 3.3. (a) Normalized PL spectra of mono-dispersed 5.1 nm CdTe QDs solution (red line)
and film (black line). (b) TRPL spectrum of 5.1 nm CdTe QDs solution recorded at 734 nm is
also displayed. 0 50 100 150 200 250 300 600 650 700 750 800 850 (b) (a) 734 nm CdTe QDs film 5.1 nm 734 nm (solution) 800 nm 750 nm 710 nm 670 nm
Time (ns)
film solutionN
o
rm
a
liz
ed
P
L
I
n
te
n
sit
y
(
a
rb
.
u
n
it
s)
Wavelength (nm)
640 660 680 700 720 740 760 780 734nm 50.0 ns 40.0 ns 20.0 ns 10.0 ns
Wavelength (nm)
P
L
I
n
te
n
sit
y
(
a
rb
.
u
n
it
s)
2.0 ns 719nmFIG. 3.5. Dynamic red-shift of the PL peak emission of the mono-dispersed 5.1 nm CdTe QDs film. 0 20 40 60 80 100 735 730 725 720 715
W
a
v
ele
n
g
th
(
n
m
)
Time (ns)
140 150 160 170 180 190 200 210 220 30 40 50 Colloidal CdTe QDs D = 3.4 nm D = 5.1 nm
E
n
er
g
y
S
h
if
t
(
m
eV
)
FWHM (meV)
D = 2.3 nmFIG. 3.6. The amount of red-shift versus FWHM for 2.3 nm (square), 3.4 nm (circle), 5.1
400
500
600
700
800
900
Wavelength (nm)
(b) film
P
L
I
n
te
n
si
ty
(a
r
b
.
u
n
it
s)
(a) solution
A
b
so
r
p
ti
o
n
(a
r
b
.
u
n
it
s)
P
L
I
n
te
n
si
ty
(a
r
b
.
u
n
it
s)
mixed sample
acceptor
donor
FIG. 3.7. (a) Absorption (dash) and normalized PL spectra (solid) for mono-dispersed 2.3
nm (blue line), 3.4 nm (green line) and 5.1 nm (red line) CdTe QDs solution at room
temperature. (b) PL spectra for film of 3.4 nm (green line), 5.1 nm (red line), and mixture of
FIG. 3.8. (a) PL decay curves of the pure 3.4 nm CdTe QDs film (green line) and the
mixed-size CdTe QDs film (black line) measured at 635 nm. (b) PL decay curves of the pure
5.1 nm CdTe QDs film (red line) and the mixed-size CdTe QDs film (black line) measured at
734 nm.
0 50 100 150 0 50 100 150
pure donor film mixed film
N
o
rm
a
liz
ed
P
L
I
n
te
n
sit
y
(
a
rb
.
u
n
it
s)
Time (ns)
recorded at 635 nmpure acceptor film mixed film
FIG. 3.9. True-color images of the pure donors, pure acceptors, and mixed CdTe QDs in
500 600 700 800 500 600 700 800 (b) film
P
L
I
n
te
n
sit
y
(
a
rb
.
u
n
it
s)
Wavelength (nm)
(a) solution D / A = 5 D / A = 3 D / A = 1FIG. 3.10. (a) PL spectra of mixed-size CdTe QDs solutions with different donor to acceptor
concentration ratios (D/A = 1, 3, and 5). (b) PL spectra of mixed-size CdTe QDs films with
0 50 100 150 200 0 10 20 30 40 50 N o rm a li ze d P L I n te n si ty ( a rb . u n it s) Lifetime (ns) D / A = 5 D / A = 3 D / A = 1 pure acceptor
N
o
rm
a
liz
ed
P
L
I
n
te
n
sit
y
(
a
rb
.
u
n
it
s)
Time (ns)
CdTe QDs film 3.4 (D) + 5.1 (A) recorded at 734 nm (b) 0 10 20 30 40 50(a) CdTe QDs film 3.4 (D) + 5.1 (A) recorded at 635 nm
N
o
rm
a
liz
ed
P
L
I
n
te
n
sit
y
(
a
rb
.
u
n
it
s)
Time (ns)
D / A = 5 D / A = 3 D / A = 1FIG. 3.11. (a) PL decay curves of donors detected at 635 nm in the mixed CdTe QDs films
with different D/A ratios. (b) PL decay curves of acceptors detected at 734 nm in the mixed
CdTe QDs films with different D/A ratios. The inset shows the initial PL decay curves of
560 600 640 680 720 760 800 (b)
P
L
I
n
te
n
si
ty
(
a
r
b
.
u
n
it
s)
Wavelength (nm)
40.0ns 10.0ns 20.0ns 5.0ns 2.0ns 0.5ns 550 600 650 700 750 800 0 10 20 30 40 50Wavelength (nm)
T
im
e
(
n
s)
(a) P L I n te n si ty ( a r b . u n it s) 35.00 176.5 890.5 2000FIG. 3.12. (a) TRPL image of mixed-size CdTe QDs film (D/A = 5). (b) Temporal evolution
0 2 4 6 8 10 2 4 6 8 10 12
L
if
et
im
e
(n
s)
Donor/Acceptor Ratio
3.4 nm + 5.1 nm CdTe QDs film recorded at 635 nm (b) 3.4 nm 0 10 20 30 40 D / A = 5 D / A = 6 D / A = 8 D / A = 9 CdTe QDs film 3.4nm(D)+5.1nm(A) recorded at 635 nm (a)N
o
rm
a
liz
ed
P
L
I
n
te
n
sit
y
(
a
rb
.
u
n
it
s)
Time (ns)
FIG. 3.13. (a) TRPL spectra of donors in mixed-size CdTe QDs films detected at 635 nm for
D/A = 5, 6, 8, and 9. (b) Average PL lifetime of donors (open circles) recorded at peak
position in the mixed-size CdTe QDs films as a function of D/A ratios. The PL lifetime of
Chapter 4. Conclusions
In conclusion, we demonstrated the FRET dynamics in mono-dispersed and mixed-size
CdTe QDs films by using PL and TRPL spectroscopies. A significant PL energy red-shift was
observed in mono-dispersed CdTe colloidal QDs films when compared with solutions. The
energy dependent TRPL measurements directly reveal the energy transfer from small to large
QDs within the sample inhomogeneous distribution. We found that the amount of PL energy
red-shift is independent of CdTe QDs’ size but depends on the PL linewidth of the sample.
The quenching/enhancement of PL intensity and lifetime of donors/acceptors are evidences of
FRET effect in mixed-size (50 % 3.4 nm and 50 % 5.1 nm) water-soluble CdTe QDs. Finally,
we also found that the donor to acceptor concentration ratio in mixed-size CdTe QDs films is
an important parameter, influenced the FRET efficiency. As the ratio is increased from 1 to 6,
the FRET rate is changed from 0.13 to 0.93 ns-1 and the efficiency is changed from 63 to 91 %.
This is because acceptors are surrounded by more and more donors. However, as the ratio is
further increased to 9, the lifetime of donors is approached to that of pure donors. It is because
References
[1] A. P. Alivisatos, Science 271, 933 (1996).
[2] X. Michalet, F. F. Pinaud, L. A. Bentolila, J. M. Tsay, S. Doose, J. J. Li, G. Sundaresan, A.
M. Wu, S. S. Gambhir, and S. Weiss, Science 307, 538 (2005).
[3] Yao He, Li-Man Sai, Hao-Ting Lu, Mei Hu, Wen-Yong Lai, Qu-Li Fan, Lian-Hui Wang,
and Wei Huang, Chem. Mater. 19, 359 (2007).
[4] V. L. Colvin, M. C. Schlamp, and A. P. Alivisatos, Nature 370, 354 (1994).
[5] Seth Coe, Wing-Keung Woo, Moungi Bawendi, and Vladimir Bulovic, Nature 420, 800
(2002).
[6] QingJiang Sun, Y. Andrew Wang, Lin Song Li, DaoYuan Wang, Ting Zhu, Jian Xu,
ChunHe Yang, and YongFang Li, Nature Photonics 1, 717 (2007).
[7] J. M. Caruge, J. E. Halpert, V. Wood, V. Bulović, and M. G. Bawendi, Nature Photonics 2,
247 (2008).
[8] Alyona Sukhanova, Jérôme Devy, Lydie Venteo, Hervé Kaplan, Mikhail Artemyev,
Vladimir Oleinikov, Dmitry Klinov, Michel Pluot, Jacques H. M. Cohen, and Igor Nabiev,
Anal. Biochem. 324, 60 (2004).
[9] Igor L. Medintz, H. Tetsuo Uyeda, Ellen R. Goldman, and Hedi Mattoussi, Nature
Material 4, 435 (2005).
[11] B. Valeur, Molecular Fluorescence: Principles and Applications, (Wiley, New York,
2002).
[12] Neslihan Cicek, Sedat Nizamoglu, Tuncay Ozel, Evren Mutlugun, Durmus Ugur Karatay,
Vladimir Lesnyak, Tobias Otto, Nikolai Gaponik, Alexander Eychmüller, and Hilmi
Volkan Demir, Appl. Phys. Lett. 94, 061105 (2009).
[13] S. A. Crooker, J. A. Hollingsworth, S. Tretiak, and V. I. Klimov, Phys. Rev. Lett. 89,
186802 (2002).
[14] C. R. Kagan, C. B. Murray, M. Nirmal, and M. G. Bawendi, Phys. Rev. Lett. 76, 1517
(1996).
[15] T. Franzl, D. S. Koktysh, T. A. Klar, A. L. Rogach, and J. Feldmann, Appl. Phys. Lett.
84, 2904 (2004).
[16] Marc Achermann, Melissa A. Petruska, Scott A. Crooker, and Victor I. Klimov, J. Phys.
Chem. B, 107, 13782 (2003).
[17] Thomas Franzl, Alexey Shavel, Andrey L. Rogach, Nikolai Gaponik, Thomas A. Klar,
Alexander Eychmüller, and Jochen Feldmann, Small 1, 392 (2005).
[18] Marc Achermann, Melissa A. Petruska, Simon Kos, Darryl L. Smith, Daniel D. Koleske,
and Victor I. Klimov, Nature 429, 642 (2004).
[19] Masaki Kawai, Aishi Yamamoto, Norihiro Matsuura, and Yoshihiko Kanemitsu, Phys.
[20] C. W. Chen, C. H. Wang, C. M. Wei, and Y. F. Chen, Appl. Phys. Lett. 94, 071906
(2009).
[21] C. W. Chen, C. H. Wang, Y. F. Chen, C. W. Lai, and P. T. Chou, Appl. Phys. Lett. 92,
051906 (2008).
[22] Akihiro Ueda, Takeshi Tayagaki, and Yoshihiko Kanemitsui, Appl. Phys. Lett. 92,
133118 (2008).
[23] Teresa Pellegrino, Liberato Manna, Stefan Kudera, Tim Liedl, Dmitry Koktysh, Andrey
L. Rogach, Simon Keller, Joachim Rädler, Giovanni Natile, and Wolfgang J. Parak,
Nano Lett. 4, 703 (2004).
[24] Daniele Gerion, Fabien Pinaud, Shara C. Williams, Wolfgang J. Parak, Daniela Zanchet,
Shimon Weiss, and A. Paul Alivisatos, J. Phys. Chem. B 105, 8861 (2001).
[25] Ling Xu, Jun Xu, Zhongyuan Ma, Wei Li, Xinfan Huang, and Kunji Chen, Appl. Phys.
Lett. 89, 033121 (2006).
[26] Ling Xu, Jun Xu, Wei Li, Zhao Weiming, Ping Sun, Zhongyuan Ma, Xinfan Huang, and
Kunji Chen, J. Mater. Sci. 42, 9696 (2007).
[27] C. R. Kagan, C. B. Murray, and M. G. Bawendi, Phys. Rev. B 54, 8633 (1996).
[28] Sergiy Mayilo, Jan Hilhorst, Andrei S. Susha, Cornelia Höhl, Thomas Franzl, Thomas A.
Klar, Andrey L. Rogach, and Jochen Feldmann, J. Phys. Chem. C 112, 14589 (2008).