探討大白鼠之風險選擇行為之神經機制 - 政大學術集成
94
0
0
全文
(2) Table of contents. 中文摘要 …………………………………………………………………1. Abstract ……………………….……………………………….………2 Chapter One: Introduction ………………..………………...………..4 Chapter Two: Methods ……………………….……………………...16 Subjects …………………………………………………….……..16 Apparatus …………………………………………………………16. 政 治 大 Discrimination test ……………………………………….……….17 立. Drugs ……………………………………………………………..16. Locomotion test …………………………………………………..17. ‧ 國. 學. Procedures of Experiment 1a …………………..……………….…17. ‧. Procedures of Experiment 1b .…………………..……..………..…20. y. Nat. Procedures of Experiment 2 ………..………………..………..…21. er. io. sit. Data analysis ………………...……………………………………..23 Histology…………………………………………………………..23. al. n. v i n Ch Chapter Three: Results ……………………………………………….24 engchi U Experiment 1a:. Probabilistic risky choice in different EV conditions...............….…24 Experiment 1b: Effects of amphetamine on probabilistic risky choice…...…………26 Experiment 2: Effects of lesion manipulations on probabilistic risky choice……...28 Histology……………………………………………………………28 Effects of NAC lesion…………………………………………….30 Effects of DLS lesion……………………………………………..32 i.
(3) Effects of OFC lesion……………………………………………..34 Effects of mPFC lesion…………………………………………...36 Chapter Four: Discussion…………………………………………….39 References ………………………………………………………….….54 Figures………………………………………………………………….61 Appendix…………………………………..…………………………87. 立. 政 治 大. ‧. ‧ 國. 學. n. er. io. sit. y. Nat. al. Ch. engchi. ii. i n U. v.
(4) 中文摘要 「風險決策」行為非常普遍的存在於吾人之日常生活中,而選項所帶來的風 險和獎勵是吾人進行決策時的重要考量因素。風險選擇的適當與否,對於個體的 生存扮演著相當重要的角色。在以往的文獻中,對於決策的行為歷程已有所關注 及探討,但對於風險選擇行為的神經生理機制迄今未明。本研究藉由大白鼠於 T 字迷津中,選擇確定之低酬賞或高不確定性之高酬賞的行為表現,進行風險選擇 行為的探討。本研究中以兩項主要實驗,探討風險選擇行為之神經行為機制。實 驗 1a 中,確定之低酬賞端固定呈現 1 顆食物粒,而高不確定性之高酬賞端則同. 治 政 大 地檢驗期望值(0.5、1 和 2)於此風險選擇行為中扮演的角色。行為結果顯示當風 立 時操弄酬賞物機率(50%、25%及 12.5%)以及酬賞物的量(2、4 及 8 顆),以系統性. 險較低時,大白鼠會選擇高不確定性之高酬賞端;而風險較高時,則轉為選擇確. ‧ 國. 學. 定之低酬賞端。實驗 1b 中,系統性地施打不同劑量之安非他命,探討多巴胺系. ‧. 統在此風險選擇行為中之機制。實驗結果顯示施打安非他命後,大白鼠表現出相. y. Nat. 對地追求風險之行為,亦即選擇高不確定之高酬賞端之比例顯著高於控制組。實. er. io. sit. 驗 2 中,藉由毀除大腦特定部位(依核、背外側之紋狀體、眶前額皮質、內側之 前額皮質),檢驗風險選擇行為之神經基礎。毀除後之結果顯示,僅有依核受到. al. n. v i n 毀除之大白鼠表現出相對地趨避風險之選擇行為。綜合以上結果,本研究建立之 Ch engchi U 風險選擇行為與多巴胺有關,而依核在此行為歷程中扮演重要的調節角色。. 關鍵字: 關鍵字 :決策,風險選擇,期望值,中腦多巴胺系統,神經毒素毀除,大白鼠. 1.
(5) Abstract Many decisions people make every day involve uncertainty where both risks and rewards associated with each option need to be considered.. Behavioral performance. associated to risk-based choice appears wildly over the lifespan, and the fitness of risky choice behavior plays an important role in individual survival. Despite a growing body of research has focused to investigate the neurobiology of decision making, little is known about the neurobehavioral mechanisms of risky choice behavior.. Based on a pilot work, this study used a T-maze to study decision under a. 政 治 大 obtain either a large reward associated with risk of non-reward “empty” or a small 立 probability-based risk in the rat. The subject was assessed on making choice to. reward ensured for every entry. Two experiments were conducted in this project to. ‧ 國. 學. investigate neurobehavioral mechanisms of probabilistic risky choice behavior.. In. ‧. Experiment 1a, probabilistic risky choice behavior was systemically assessed under. sit. y. Nat. three expected values (0.5, 1.0, and 2.0) by manipulating the probabilities of reward. io. er. presence (50%, 25%, and 12.5%) and the reward magnitude (2, 4, or 8 pellets) in the probabilistic high reward (PHR) arm. Behavioral data showed that the subject chose. al. n. v i n the probabilistic high reward in C a lower risk conditionU h e n g c h i but would shift to the choice of certain low reward (CLR) as the risk is increased.. In Experiment 1b, the dose effects. of amphetamine on this probabilistic risky choice task was tested to verify whether the dopaminergic mechanism was involved. Amphetamine, presumably activating brain dopamine systems, produced a relatively risk-seeking effect on the present behavioral task.. In Experiment 2, the excitoneurotoxic lesion was conducted in the. nucleus accumbens, the dorsolateral striatum, the orbitofrontal cortex, and the medial prefrontal cortex to examine the neural substrates for this probabilistic risky choice behavior. The results showed that the lesion of the nucleus accumbens significantly produced a relatively risk-averse effect on the present behavioral task, as compared to 2.
(6) the lesions made on the other three brain areas.. In conclusion, the probabilistic risky. choice behavior established in the present study is dopamine dependent. And, the nucleus accumbens plays a major role of mediating this behavioral processing.. Keywords: decision making, risky choice, expected value, mesolimbic dopamine systems, neurotoxic lesion, rat. 立. 政 治 大. ‧. ‧ 國. 學. n. er. io. sit. y. Nat. al. Ch. engchi. 3. i n U. v.
(7) Chapter One: Introduction The issue of decision making has received considerable attention in a fashion of continuous growth recently. To examine decision making, the choice behavior could be simply measured when an individual makes decision among different options each with a certain value of outcome and a specific probability for the outcome. However, in the real-world, the choice behavior is more complex than it was thought. For example, buying stuffs, investing stocks, taking tests and choosing a job for career development, choice behavior with uncertainty is involved in almost everything that. 政 治 大 It is now clear that decision making is a higher order of cognitive function. 立. people engage to do.. psychology and other disciplines of social science.. 學. ‧ 國. Substantial data have been accumulated to elucidate decision making from. How the brain mediates or. ‧. modulates the processes or components involved in decision making remains. sit. y. Nat. inconclusive. Despite this, from clinical studies, behavioral patterns of decision. io. er. making observed in the patient with certain types of neurological or psychiatric disorder is different from that of normal individual. For instance, impulsivity for. al. n. v i n choosing the immediate reward C rather than the delayedUreward with a magnified hengchi. amount has been observed in the subject with the diagnosis of pathological gambling or drug addiction. Such a case is in common cross societies and cultures.. Thus, the. investigation of neural mechanisms of decision making becomes an important research topic and can enhance our understanding how the brain drives for decision making. Economical viewpoints According to the economical principles, the expected outcome values and the uncertainty of options are two factors being considered when people make decision or choose an option for the specific purpose (Schultz, Preuschoff, Camerer, Hsu, Fiorillo, 4.
(8) Tobler, & Bossaerts, 2008).. In general, expected value (EV) can be calculated by. knowing the outcome probability and the possible outcome value of a specific option. From the economical viewpoint, the subject should reasonably choose the option with higher EV in order to get more profits. However, the subjective value which differed between individuals has neglected in the basic concepts of EV. Thus, “expected utility” has been proposed and taken the individual subjective values into account (von Neumann and Morgenstern, 1947). The differences between expected utility and EV are the expected utility argued that individual’s subjective value is not a linear. 政 治 大 higher outcome values would became less worthy for the decision makers, such 立. correlation with the outcome values. That is, if an outcome value increased, the. phenomenon shows a concave utility function (Schultz et al. 2008).. ‧ 國. 學. In the past, many studies indicated that most people would not so rational in In prospect theory (Kahneman & Tversky, 1979), the. io. sit. But in a monetary loss condition, most. er. condition, most people were risk-averse. people are risk-seeking.. In a monetary gain. y. Nat. individual’s attitudes toward gain and loss are not the same.. ‧. some specific conditions.. For example, a choice between certain $9,000 and 50% of. al. n. v i n C hchoose $9,000; inUcontrast, a choice between $20,000 dollars, most people would engchi. certain loss $9,000 and 50% of loss $20,000 or loss nothing, most people would bet on the 50% of loss nothing. Moreover, the results from the experiments of framing effect (Tversky & Kahneman, 1981) reveal a perception of decision problem and the evaluation of probabilities and outcomes produce predictable shift of preference when the same problem is framed in different ways. These findings indicate the deviation from the prediction of EV can be a bias to change the choice made by people.. As. addressed in Neuroeconomics edited by Glimcher, Camerer, Fehr, and Poldrack (2009), people often make decisions based on the emotional states (Glimcher et al. 2009, chap 16 & 19), social preferences (Glimcher et al. 2009, chap 18), past 5.
(9) experiences (Glimcher et al. 2009, chap 22) and environmental conditions (Glimcher et al. 2009, chap 28) rather than the purely judgments from outcome values or EV. Although the earlier concepts about EV failed to precisely predict individual’s choice or attitude in certain conditions, it is still a key variable for decision making or processing choice behaviors (Schultz, 2010). Dopamine and decision making In recent years, the midbrain dopamine system has been argued for playing an important role in decision making and related cognitive processes, such as prediction. 政 治 大 brain have been reported to be critically involved in different types of decision 立. error and reward valuation (Schultz, 2010). Several dopamine related areas in the. making including the analysis of cost and benefit (Boksem & Tops, 2008; Salamone,. ‧ 國. 學. Correa, Farrar, Nunes, & Pardo, 2009), delay (or temporal) discounting (Cardinal,. ‧. 2006; Kobayashi & Schultz, 2008) and probabilistic task (Niv, Duff, & Dayan, 2005;. sit. y. Nat. Schultz et al, 2008). Furthermore, a series of neurophysological studies done by. io. er. Schultz and his colleagues demonstrated that neuronal activities of ventral tegmental area encode the reward probability and risk (Schultz et al., 2008; Schultz, 2010;. al. n. v i n CKobayashi Fiorillo, Tobler, & Schultz, 2003; 2008). h e n g &c Schultz, hi U. With dopaminergic. activation, the subject can learn and/or integrate the information which includes reward value, reward probability and reward magnitude among different options in order to making decisions (Schultz et al., 2008).. It is worth to further delineate. which area of the midbrain dopamine system is involved in a specific type or process of decision making. The analysis of cost and benefit A basic form associated with decision making is the process of the analysis of cost and benefit. Namely, the subject makes decision to choose an option either high cost/benefit or low cost/benefit. Neural mechanisms underlying the analysis of cost 6.
(10) and benefit are reasonably inferred from human study of neuropsychology (Boksem & Tops, 2008). The involvement of the midbrain dopamine system in the choice behavior task related to cost/benefit analysis has also been reported in animal studies (Cousins, Atherton, Turner, & Salamone, 1996; Salamone, Cousins, & Snyder, 1997). In these experiments, two choice options were set on the two arms of T-maze, one arm was the high-cost-high-benefit (HH) arm, and the other was the low-cost-low-benefit (LL) arm. The “high cost” for rats was designed by a barrier placed on the way to access the high reward.. The rat has to climb and across the barrier, presumably with. In contrast, there was no barrier 政 治 大 (low cost) on an arm entry to receive a smaller amount of reward. The results show 立 higher cost, to obtain a lager amount of reward.. that the normal rat chooses the HH arm more than the LL arm, indicating that the. ‧ 國. 學. subject is willing to pay more effort in order to get more benefit.. In contrast, choice. ‧. response would be shifted to LL arm in the rat with lesions of the nucleus accumbens. sit. y. Nat. (Salamone, Correa, Farrar, & Mingote, 2007) and medial prefrontal cortex (Walton,. io. er. Bannerman, Alterescu, & Rushworth, 2003). These data indicate that the rat would not pay more effort to get more benefit under the impairment of midbrain dopamine. n. al. system.. Ch. Probabilistic risky choice behavior. engchi. i n U. v. The probabilistic risky choice behavior, as aforementioned, is gaining more and more attention in the field of decision making.. According to Schultz et al. (2008),. the definition of risk is the degree of second moment of the probability distribution over possible outcomes.. Risk and ambiguity are two forms of uncertainty.. The. difference between these two terms is up to whether the probability is known or not. The probability is known in the risk form, whereas that is not for ambiguity.. While. subjects facing risky choice task, the probability will be an important variable that may potentially affect the decision. The effects of different probabilities on 7.
(11) individual decision making are recently reported in human gambling task and animal study. Risk-based task in human The Iowa Gambling Task (IGT) (Bechara, Damasio, Damasio, & Anderson, 1994; Bechara, Damasio, Damasio, & Lee, 1999) is one of the crucial studies about human decision making based on risky choice.. In IGT, the subjects were asked for making. choices among four card decks A, B, C, and D which were presented on the screen. Decks A and B were defined as “bad deck” which brought large gain and large loss,. 政 治 大 brought small gain and small loss, with a total gain at the end. 立 with a total loss in the long run.. In contrast, decks C and D were “good deck” which In the beginning of. IGT, subjects chose “bad deck” more frequent because of the immediately large. ‧ 國. 學. reward outcomes. However, the subjects gradually shifted to choose “good deck”. ‧. after several trials. That the subject makes decision, in the long run, would intend to. sit. y. Nat. avoid the loss indicate a perception of risk existed and a nature of risk avoidance.. io. er. The animal experiments related to probabilistic risky choice issues. The aforementioned IGT studies raise many intriguing issues about probabilistic. al. n. v i n C hLasthuis, den Heijer, van den Bos, van der Harst, and Spruijt engchi U. risky choice behavior.. (2006) developed a rodent model of IGT.. In modifying from human IGT, the. monetary gain was substituted by sugar pellets and monetary loss was conducted by quinine-treated pellets in this model. There were also four choice options which divided into two “bad arms” and two “good arms.”. In which, every 10 choices in. “bad arms” contained a chance of winning big reward (3 sugar pellets) but rest of 9 trials were losses (quinine-treated pellets).. In “good arms,” every 10 trials contained. 8 trials of small reward (1 sugar pellet) among quinine-treated pellets. Regardless to the strain, gender or housing condition, the response pattern of rodent performed was similar to that performed by human subjects on IGT. 8.
(12) Another animal model associated with probabilistic risky choice behavior was established on the basis of a probabilistic discounting task by using the operant chamber (Cardinal & Howes, 2005).. In that study, two levers were set as for two. different reward options including a large/uncertain reward lever and a small/certain reward lever. Pressing the small/certain reward lever would present 1 pellet reward for sure, whereas pressing the large/uncertain reward lever would present 4 pellets reward with specific probabilities. The probabilities to receive a large reward were manipulated from 100% decreased to 50%, 25%, 12.5%, and 6.25%. When the. 政 治 大 reward lever decreased and in turn shifting to respond on the small/certain reward 立. probability decreased, the percentage of rat’s response of choosing the large/uncertain. In comparing to the sham lesion controls, the rats with lesions of the core. 學. ‧ 國. lever.. subarea of nucleus accumbens showed a relatively risk-averse pattern by significantly. sit. y. Nat. Pharmacological treatments on risk-based tasks. ‧. decreasing the responses on the large/uncertain reward lever.. io. er. The probability discounting task in the rat developed by Cardinal and Howes (2005) led subsequent studies with psychopharmacological approach to investigate. al. n. v i n C h and risky choice the relationship between neurotransmitter behavior. engchi U. St Onge and. Floresco (2008) modified an operant chamber with two levers set for evaluating the probabilistic discounting task. After initial magazine training, different groups of rats received either dopamine agonists or antagonists via intraperitoneal injection. Nine different dopamine related drugs were tested, including dopamine general agonist amphetamine and specific dopamine receptors (D1, D2, D3, D4) agonists and antagonists. The results indicate that the injections of the dopamine D1 and D2 agonist increased the percentage of choosing the large/risky reward lever.. However,. the injection of dopamine D3 agonist decreased the percentage of choosing the large/risky reward lever and shifted toward the small/certain reward lever. 9.
(13) Conversely, neither D4 agonist nor D4 antagonist produced any significant effect on this task. Thus, these pharmacological data show that different dopamine subtype receptors may be involved in the risky choice behavior. In considering that the probabilistic risky choice behavior in the subject of drug addiction different from that of normal subject, Floresco and Whelan (2009) examined the effects of repeated amphetamine treatment on a probabilistic and an effort discounting task.. The subject was presumably developed a drug induced. sensitization by 15 intraperitoneal injections of amphetamine every 2 days with doses. 政 治 大 this repeated amphetamine administration increases risky choice. 立. increased from 1 mg/kg to 5 mg/kg after every third injection. The results show that However, this. amphetamine treatment did not alter effort-based decision making on the effort. ‧ 國. 學. discounting task.. It is thus suggested that the sub-chronic administration of. ‧. amphetamine impairs decision making based on balancing the risk and reward.. It is. sit. y. Nat. worthy to further examine what neural mechanisms potentially underlie this. io. al. n. injection.. er. behavioral change after the aforementioned drug treatment given by systemic. i n Neurophysiological approachesC applied in risk-base tasks hengchi U. v. In addition to pharmacological approach, Fiorillo et al. (2003) used. electrophysiological recording for directly investigating the relationships between dopamine neurons and probabilistic risky choice behavior. The electrodes were implanted in Rhesus monkeys’ midbrain dopamine related areas A8, A9, and A10. In each trial, subjects were presented by different pictures on the screen as conditioned stimuli. Each picture was correspondingly represented with a specific probability (100%, 75%, 50%, 25%, or 0%) to obtain the reinforcer.. In the condition. that the monkeys obtain reward under a relatively lower probability (25%), the increased firing responses of dopamine neurons occurred at the reward delivery time 10.
(14) point. Another interesting result was observed when monkeys obtained reward as presented by relatively higher probability (75% or 100%).. In which, the firing of. dopamine neurons increased but with a less magnitude than that elicited in the condition of 25%.. In addition, the peak of these neuronal firings located closely to. the time point of the onset of conditioned stimulus (the picture) but not the reward delivery. Together, the degrees of dopamine neuron firing are depended on the predictability of reward presence, which can be determined by the reward probabilities. This experiment provided direct evidence in supporting that dopamine. 政 治 大 Brain functions and lesion studies 立. neurons play an important role in the probabilistic risky choice task.. Based on a hypothesis that different areas of the brain could potentially form a. ‧ 國. 學. circuit associated with decision making, an increasing number of studies indicate that. ‧. several brain areas including the prefrontal cortex (PFC), the orbitofrontal cortex. sit. y. Nat. (OFC), the dorsal striatum have involved in the process of decision making (Balleine,. io. Murray, O’Doherty, & Schoenbaum, 2007).. al. er. Delgado, & Hikosaka, 2007; Lee, Rushworth, Walton, Watanabe, & Sakagami, 2007;. n. v i n C h with neurotransmitters Based on that the OFC is contained of dopamine and engchi U. serotonin, Walker, Robbins, and Roberts (2009) conducted neurotoxins to induce. dopamine or serotonin depletions in the marmosets’ OFC area. The marmosets were trained to choose one of two stimuli on the touch sensitive screen for reward. After initial training, subject underwent Pavlovian training for learning an association between the stimuli (picture) and conditioned stimuli (sound). Then, an extinction task was conducted. The results show that the subjects with dopamine, but not serotonin, depletion in the OFC kept responding in the extinction phase. These data imply that reinforcement function have been impaired after the neurotoxin induced dopamine depletion. Walker et al. (2009) suggested that the OFC is critical for 11.
(15) representing reward value and is also necessarily for learning and updating information. Further, some other brain areas are suggested to link with the function of probabilistic risky choice behavior, including anterior cingulated cortex and OFC (Mobini, Body, Ho, Bradshaw, Szabadi, Deakin, & Anderson, 2002; Walton, Kennerley, Bannerman, Phillips, & Rushworth, 2006). Moreover, as mentioned earlier, the nucleus accumbens core also played an important role on probabilistic risky choice behavior (Cardinal & Howes, 2005).. For example, when subjects. 政 治 大 lesion of nucleus accumbens core chose small/certain reward more likely and showed 立 making decisions on large/uncertain reward or small/certain reward, the rat with. relatively risk-averse attitude as compared to sham lesion group. As for the OFC,. ‧ 國. 學. Mobini et al. (2002) tested the lesion effects of the OFC on both delayed and In the probabilistic task, one of the levers. ‧. probabilistic reinforcement conditions.. sit. y. Nat. presented one reward pellet with 100% probability, while the other lever presented two reward pellets with specific probabilities (88%, 72%, 48%, 32%, 20%, and 8%). er. io. aThel results show that the rat withi vOFC lesion declined n Cless their preference for the larger but reinforcer. U h eprobable ngchi n. according to each phase.. With a modification on the task of Cardinal and Howes (2005), St. Onge and. Floresco (2009) investigated the role of the PFC on the probabilistic risky choice. The microinfusion of overdosed GABA agonist was used to directly inactivated rats’ medial PFC, OFC and anterior cingulate respectively. The results show that the rat with medial PFC inactivation increased the choices toward the large/risky lever. However, the OFC and anterior cingulated inactivation had no effect on choice behavior but the response latencies did longer than control. Based on these findings, the medial PFC is thought to play an important role in mediating risk-based decision.. 12.
(16) EV as a key variable in probabilistic risky choice task The probability to present reward and the reward magnitudes are two variables concerned by the subject in the probabilistic discounting task. To choose, both probability and magnitude are crucial information for the decision making. Following the EV being defined as a summation of each reward probability multiple with its reward magnitude, it is important to investigate the neural mechanism underlying the processes relevant to EV during decision making. Recently, a few studies using human subjects to examine how the EV may alter. 政 治 大 Polezzi, Sartori, Rumiati, Vidotto and Daum (2010) recorded the EEG changes when 立 in risk related decision making.. By using electroencephalography (EEG) technique,. human subjects making decisions between zero EV and positive EV of 2.5.. In the. ‧ 國. 學. results, there was not significant difference between positive EV options and zero EV. ‧. options on the EEG components of P300 wave and feedback related negativity (FRN).. sit. y. Nat. However, by using specific techniques to analyzed electrical sources, the results. io. while subjects doing this decision making task.. al. er. indicate that the midbrain dopamine system, especially striatum, was highly activated Rolls, McCabe, and Redoute (2008). n. v i n C h imaging (fMRI) U using functional magnetic resonance to study human decision making engchi under different EV’s. They aimed to locate the brain areas that represent EV or reward magnitude (RM).. With different EV (5, 9, 10 and 30) and RM (0, 10 and 30),. the specific brain regions that correlated to EV or RM were found by the brain imaging analysis. The results show that activations of the medial OFC were correlated with both EV and RM, the activations of ventral striatum were correlated with RM but not the EV and the anterior insula were correlated negatively with EV. Moreover, another fMRI study by Tobler, Christopoulos, O’Doherty, Dolan, and Schultz (2009) indicate that the EV signals were risk-attitudes dependent between individuals. Four levels of EV range from 50 to 200 were used, each of them had a 13.
(17) high- and low- risk variant with the same EV. The results of fMRI analyses revealed that the EV signals in lateral prefrontal cortex reduced by risk in risk-averse individuals, but increased in the risk-seeking individuals. Also, Tobler et al. (2009) suggested that the EV and risk were coding in the striatum. These findings suggest that the dopamine system may also relate to the EV concepts on the human subjects. However, the data from EEG and fMRI are still weak on explanation of the causal effect of the brain and the behavior. In summary, a growing number of studies in the neuroscience of decision. 政 治 大 However, most of the animal model studies focused on investigating or manipulating 立 making have started focusing on the issue of the probabilistic risky choice behavior.. the reward probabilities but neglected the issue of EV. The importance of EV on. ‧ 國. 學. decision making has been highlighted by several studies (Rolls et al., 2008; Polezzi et. ‧. al., 2010; Schultz, 2010). That is, the subject making decisions could indeed be. sit. y. Nat. influenced by different EV. Moreover, considerable evidences suggest that the. io. er. dopaminergic activation encoded EV and responded to the stimulus associated to EV. Thus, the present study emphasized on the manipulations of different EV and. al. n. v i n investigated the neurobehavioralCmechanisms of the rats’ h e n g c h i U probabilistic risky choice behavior.. Rationale From literature reviewed above, a few studies examined the effects of reward probabilities on risky choice in animal models (Cardinal & Howes, 2005; Mobini et al., 2002; St. Onge & Floresco, 2008, 2009). These previous studies manipulated the reward probabilities but holding the reward magnitude in constant on each lever, in consequence, the EV changed with these different reward probabilities. However, the issue of EV has not been manipulated and discussed in these studies. Following the argument that the EV was related to the desirability of subjects in the decision 14.
(18) making (Rolls et al., 2008; Schultz, 2010), it is worthy to conduct a systemic examination on the EV in the probabilistic risky choice behavior. Thus, present study manipulated different EV based on the adjustment of the probability to present reward and the reward magnitude. Through a pilot work (Yang, Lin, & Liao, 2007), the present animal model were constructed by using a T-maze. One of the arms was designated as probabilistic high reward (PHR) arm and the other one as certain low reward (CLR) arm. Choosing CLR arm would present 1 pellet reward for sure.. In contrast with CLR arm, higher. 政 治 大 data showed that the rats shifted their preference from the PHR arm toward the CLR 立. reward would be found in the PHR arm but with specific probabilities. Preliminary. arm while PHR arm’s reward probability decreased. The results confirmed the. ‧ 國. 學. risk-related decision making in this behavioral task. Another pilot study of the. ‧. pharmacological test on the effects of acute amphetamine was conducted in this lab. sit. y. Nat. (Lin, Yang, Yen, & Liao, 2008). The results show that the rat with amphetamine. io. er. treatment would choose the PHR arm more than that under saline control. The aforementioned data were collected only from the condition of EV=1 on. al. n. v i n It is C possible that the performance h e n g c h i U on the probabilistic. both CLR and PHR arm.. risky choice behavior can be altered under conditions with different EV.. The present. study systemically examined three conditions of EV in 0.5, 1.0, and 2.0 on PHR arm, but EV on CLR arm was kept constant at 1 in all three conditions.. If rats’. probabilistic risky choice behavior performance appears differently under three EV conditions, it is then inferred that the subject has basic perception of EV for making choice or decision. Finally, the present study evaluated the lesion effects of the probabilistic risky choice behavior in order to reveal the neural substrates for this behavior.. 15.
(19) Chapter Two: Methods Subjects Wistar rats (250-300g) were the subjects of this study, as purchased from BioLASCO Taiwan.. Each rat was housed individually and maintained on a 12h of. light/dark cycle. The temperature was kept constant around 22±2℃ in the animal colony. During the experimentation, the subjects were maintained in a food deprivation regimen, which were about 85% of their normal weight. The water was provided in ad libitum. All experiments were regulated by the local animal care. 政 治 大. committees of National Cheng Chi University. Apparatus. 立. 學. ‧ 國. For testing the probabilistic risky choice, a T-maze was used in this study which was consisted of one start arm (55 cm × 15 cm × 25 cm) and two goal arms (55 cm × Chocolate pellets, approximately 0.15 g per pellet, were used. ‧. 15 cm × 25 cm each).. sit. y. Nat. as the reward put in the end of the goal arms.. io. er. A rectangle box (80 cm × 25 cm × 35 cm) was used in the discrimination test. One end of this rectangle box was separated by an opaque plate (35 cm × 25 cm) into. n. al. i n C h amounts of reward two compartments for baiting different engchi U. v. For measuring the general locomotion, a box (35 cm × 35 cm × 55 cm) with an. infrared camera set 150 cm above the central point of box floor was used in the locomotor activity test. Drugs The drug used in Experiment 1b was the dopamine general agonist amphetamine. The amphetamine was dissolved in physiological 0.9% saline and protected from light. The drug doses, 0.5 and 1.0 mg/kg are referred to those used in Lin, Yang, Yen, and Liao (2007).. 16.
(20) Discrimination test A simple discrimination test on reward magnitude was conducted in Experiment 2.. In a rectangle box, each side compartment was baited either 1 pellet or 2 pellets. for every trials.. If the rat performs the ability to distinguish the reward magnitude. between 1 and 2 pellets, the rat was presumably have the ability to distinguish further differences of the reward magnitude ratios of 1:4 and 1:8 set in the probabilistic risky choice task. The criterion set for each rat to learn this basic discrimination capability was determined by entering the larger reward compartment for successive 10 trials.. 政 治 大 To secure the subject not being affected by lesion, the locomotion activity test 立. Locomotion activity test. was conducted in Experiment 2. Each rat was allowed to freely explore the box for. ‧ 國. 學. 30 minutes. The traveling distance of each rat was measured.. Each group was. sit. y. Nat. All the rats were randomly assigned into 3 groups.. ‧. Procedures of Experiment 1a. io. habituation session of 15 min.. n. al. er. corresponding to each EV condition. Before training, there was a one-day In which, the subject was allowed to freely explore. i Cany the whole area of T-maze without reward baited. U n hengchi. v. In the subsequent training of probabilistic risky choice behavior, one arm of the. T-maze was designated as certain low reward (CLR) arm and the other arm was the probabilistic high reward (PHR) arm.. In the CLR arm, 1 pellet reward was delivered. for sure in every entrance. As for the PHR arm, the reward magnitude and the probability of its delivery were varied in the conditions with different degrees of risk for obtaining the reward.. The magnitude of CLR arm versus that of PHR arm was. set in three reward ratios including 1:2, 1:4, and 1:8.. In the condition of reward ratio. 1:2, the reward magnitude of 2 chocolate pellets was presented with 50% of probability in the PHR arm.. In the condition of reward ratio 1:4, the reward 17.
(21) magnitude of 4 chocolate pellets was presented with 25% of probability in the PHR arm. Also, in the condition of reward ratio 1:8, the reward magnitude of 8 chocolate pellets was presented with 12.5% of probability in the PHR arm. Either CLR or PHR arm in any of three reward ratios was under a premise that the EV was kept constantly at 1.. In a pilot study, we found that the rats in the reward ratio 1:16. condition performed with a “floor effect.” That is, the rats chose the CLR arm mostly and showed a significant aversion of entering the PHR arm. Therefore, to prevent a confounding effect potentially affected by the floor effect, the reward ratio. 政 治 大 There were totally three reward ratio conditions 1:2, 1:4, and 1:8, the rats were 立. of 1:16 was not proposed to test in this project.. randomly assigned to accomplish all of these three conditions under a Latin square design.. ‧ 國. 學. Protocols for each reward ratio were divided into 3 phases: forced choice phase, free. After 3 days of rest phase, next reward. sit. y. Nat. trials per day with an exception of the rest phase.. ‧. choice phase, and rest phase. Each reward ratio condition was run in 14 days, and 16. io. er. ratio was examined continuously. The following illustration shows the behavioral test on probabilistic risky choice maintained in the condition of reward ratio of 1:2.. n. al. Ch. engchi. i n U. v. The first phase of each reward ratio condition was the one-day forced choice phase. The purpose of the forced choice phase is to ensure the rat knowing and to distinguish the difference of reward magnitude between both arms.. In the forced. choice phase, one of the T-maze’s arms was blocked by a barrier, so that the rats were. 18.
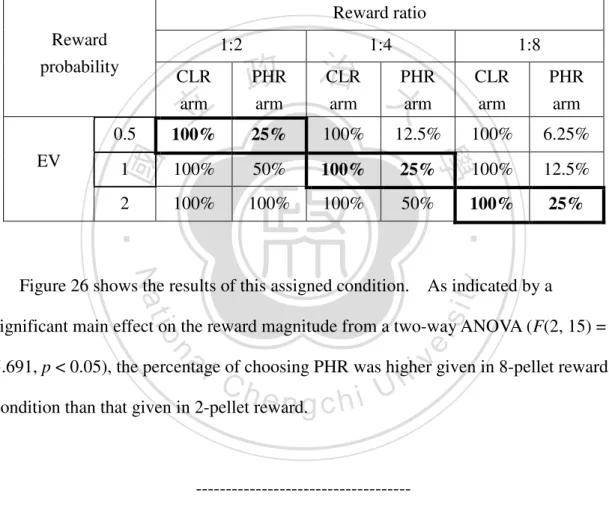
(22) forced to choose the arm without the barrier. Each rat in the first 8 trials was only allowed to choose the CLR arm, and subsequent 8 trials set for choosing the PHR arm. The probability to obtain reward was 100% for every entrance no matter choosing CLR or PHR arm in this forced choice phase.. It is inferred, the rats would prefer to. go to the PHR arm after the forced choice phase.. Next, in the free choice phase of. 10 days, the rat was allowed to freely choose either the CLR or PHR arm.. There. were 16 trials per day in this phase. For each trial in the free choice phase, the probability component of obtaining reward was set into the PHR arm only.. 政 治 大 stayed in its home cage without any training treatment. 立. finishing the free choice phase, there were 3 days of rest phase.. After. In which, the rat. The major aim of this experiment was to investigate whether different EV’s other. ‧ 國. 學. than 1, such as 0.5 or 2, set in the PHR arm would affect this probabilistic risky. In contrast, the CLR arm was always keep. sit. y. Nat. probabilities in the PHR arm only.. ‧. choice behavior. The manipulations of EV were conducted by different reward. io. er. constantly presenting 1 pellet for every entrance across all different reward ratio conditions or different EV conditions. The following table lists the reward. al. n. v i n Carm probability conducted in the PHR these reward ratios of 1:2, 1:4 and 1:8, h eunder ngchi U across three EV of 0.5, 1 and 2.. Reward probability (PHR arm). Expected value (set in PHR arm). Reward ratio 1:2. 1:4. 1:8. 0.5. 25%. 12.5%. 6.25%. 1. 50%. 25%. 12.5%. 2. 100%. 50%. 25%. In the condition of EV=0.5 set in PHR arm, the reward probability was reduced by half to that of the condition of EV=1. Such that, to keep EV at 0.5, the reward 19.
(23) probabilities were decreased from 50% to 25% with 2 pellets in reward ratio of 1:2 (25% × 2 = 0.5), from 25% to 12.5% with 4 pellets in reward ratio 1:4 (12.5% × 4 = 0.5), and from 12.5% to 6.25% with 8 pellets in reward ratio 1:8 (6.25% × 8 = 0.5). Regarding to condition of EV=2 in PHR arm, the reward probability was doubled as compared to that of the condition of the EV=1.. To keep EV at 2, the probabilities. were be increased from 50% to 100% with 2 pellets in reward ratio 1:2 (100% × 2 = 2), from 25% to 50% with 4 pellets in reward ratio 1:4 (50% × 4 = 2), and from 12.5% to 25% with 8 pellets in reward ratio 1:8 (25% × 8 = 2).. 政 治 大 That is, three separate groups were assigned for three EV 立. In regarding to the experimental design, EV conditions were arranged in the between-subject manner.. conditions. Each group of rats was engaged only one EV condition.. ‧ 國. 學. Procedures of Experiment 1b. sit. y. Nat. amphetamine on the probabilistic risky choice behavior.. ‧. This experiment was to test the effects of dopamine general agonist. io. er. All the rats used in Experiment 1a were continuously subjected to the Experiment 1b. There were also three EV conditions (0.5, 1, and 2), the assignment. al. n. v i n C hEV condition was U of three groups of rats into specific the same in the Experiment 1a. engchi For example, the rat that experienced EV=0.5 condition in Experiment 1a was continuously entering the same EV=0.5 condition in the Experiment 1b.. The protocols of probabilistic risky choice behavior with three reward ratios (1:2, 1:4, and 1:8) conducted in Experiment 1b were similar to those used in Experiment 1a. But, each of the reward ratios contained an additional drug treatment phase of four days. The following illustration shows the drug treatment on probabilistic risky choice behavior maintained in the condition of reward ratio of 1:2.. 20.
(24) The drug treatment phase was starts from day 8 to 11 (also from day 7 to 10 of free choice). The rat were intraperitoneally injected by dosing with the order of. 政 治 大 Every drug administration 立 was given in 15 minutes before behavioral test.. saline, amphetamine 0.5 mg/kg, saline, and amphetamine 1.0 mg/kg over four days. The. ‧ 國. 學. injection volume was kept in consistently in 1 ml/kg of body weight. In completing the drug test of the first reward ratio condition, the other two. ‧. reward ratio conditions were subsequently preceded.. In other words, every subject. sit. y. Nat. assigned in a specific condition of certain EV was received drug tests across all three. n. al. er. io. reward ratio conditions in Experiment 1b. Procedures of Experiment 2. Ch. engchi. i n U. v. The aim of this experiment was to investigate the neural substrates of the probabilistic risky choice behavior by the use of excitotoxic lesion technique. The main lesion sites in this experiment were nucleus accumbens (NAC) and orbitofrontal cortex (OFC).. In considering to the heterogeneity of anatomy and function in the. subareas of striatum and prefrontal cortex, the dorsolateral striatum (DLS) and medial prefrontal cortex (mPFC) were targeted as anatomical control for NAC and OFC respectively. Surgery: Subjects were provided food and water ad libitum and subjected to surgery when their body weight stabilized at about 280-300 g. Each rat was. 21.
(25) anaesthetized by intraperitoneal injection of Zoletil 50 (Virbac, Carros, France) in a volume of 1 ml/kg. After anesthesia, the rat was positioned in a stereotaxic apparatus (DKI-900) and drilled with two small holes in the skull over each hemisphere for microinjection of the ibotenic acid (Tocris, USA) into one of the following brain targets: (1) NAC: [AP] = +1.2 mm, [ML] = ±2.0 mm, [DV] = -7.1 mm; (2) DLS: [AP] = +0.7 mm, [ML] = ±3.6 mm, [DV] = -5.0 mm; (3) OFC: [AP] = +3.9 mm, [ML] = ±2.6 mm, [DV] = -2.9 mm; (4) mPFC: [AP] = +3.4 mm, [ML] = ±0.7 mm, [DV] = -2.8 mm.. Injection was given via the 23-gage stainless steel. 政 治 大 (Plastics One, Roanoke, VA, USA) by using a 2.0 µL Hamilton syringe (Hamilton, 立 cannula (Shineteh, Taipei, Taiwan) which connected by a polyethylene PE20 tube. NV, USA).. ‧ 國. 學. In the lesion group, 0.5 µL of ibotenic acid was injected into lesion site at a rate. In the case of the sham lesion group, the. sit. y. Nat. completion of the injection in each site.. ‧. of 0.1 µL per 15 sec. The cannula was left in position for 3 minutes after the. io. er. surgery procedure was identical except for the vehicle infused only.. After surgery, each rat was subjected to a 7-day recovery. During which, the rat. al. n. v i n was allowed to freely access to C food and water. The U h e n g c h i rat was gradually resumed to the food deprivation regimen before the behavioral tests.. In terms of behavioral task applied in Experiment 2, only the condition of EV=1 equally set in both CLR and PHR arm was conducted. This behavioral protocol was referred by the results obtained from Experiments 1a and Experiment 1b. In brief, the conditions of EV=0.5 and EV=2 set in PHR arm produced a “floor effect” and a “ceiling effect” respectively on rats’ choice performance (See the results of Experiment 1a and Experiment 1b for more details). Naive subjects were used in this experiment. There were totally eight groups of rats (n = 9 in each group). Four of the groups were the lesion groups: NAC, OFC, DLS, and mPFC. And, the other 22.
(26) four groups were the sham control groups in corresponding to each of four brain lesion groups. The behavioral procedures were similar to the Experiment 1a, which also include three reward ratios and each of them has three phases. The details of experimental procedures to test the probabilistic risky choice behavior are the same as those described in Experiment 1a. Histology After behavioral measure finished in Experiment 2, all the subjects were. 政 治 大 intracardially with normal saline followed by 24% formalin. 立. sacrificed by overdose of chloralhydrat (Ferak, Berlin, Germany) and perfused The brain was removed. and placed in a sucrose/formalin mixture for at least 48 hours. The brain was. ‧ 國. 學. sectioned at 40 µm with a freezing microtome and mounted on polysine slides. ‧. (Menzel-Glaser, Berlin, Germany) and stained with cresyl violet for further. y. sit. io. er. Data analysis. Nat. histological assessment.. All data were analyzed by analysis of variance (ANOVA) with appropriate. al. n. v i n Choc The post test was conducted when h ecomparison ngchi U. experimental designs. appropriate.. All the tests with statistical significance were determined by a criterion. of p < 0.05.. 23.
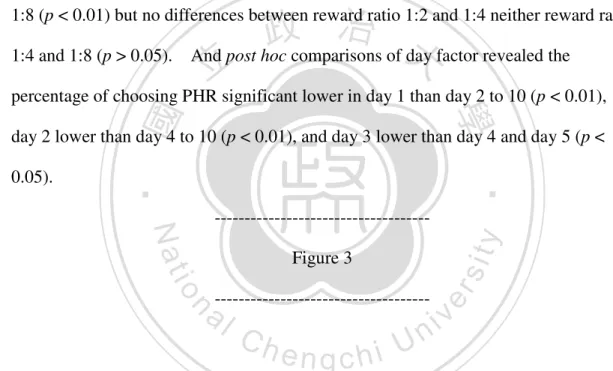
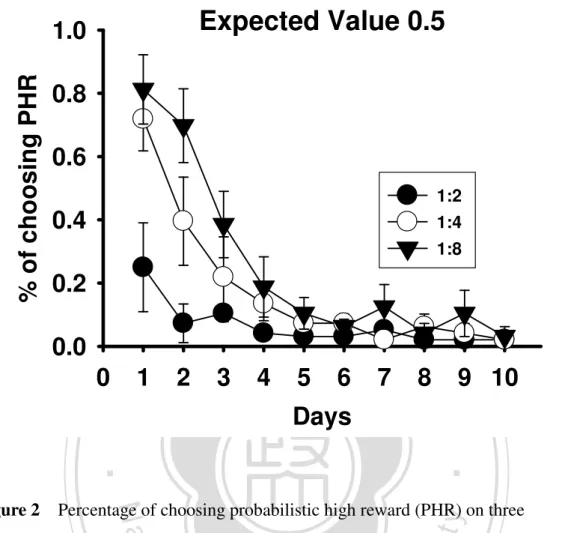
(27) Chapter Three: Results Experiment 1a: Probabilistic risky choice in different EV conditions The results of Experiment 1a are presented in Figure1, Figure2, and Figure 3, respectively covering the data collected when the EV set on 1, 0.5, and 2 on the PHR arm.. In Figure 1, the results of a two-way ANOVA showed a significant main effect. of reward ratio (F(2, 10) = 14.613, p < 0.01) and a significant reward-ratio-by-day interaction (F(18, 90) = 2.679, p < 0.01). A test of simple main effect revealed a significant difference of reward ratio factor on the last nine days (from day 2 to 9, in the orders of F(2, 4) = 8.133, 31.778, 21.128, 28.299, 29.000, 22.991, 31.452, 30.117, and 45.408, p < 0.05).. 政 治 大. Further post hoc comparisons revealed that the percentage of. 立. choosing PHR significantly higher in reward ratio 1:2 than reward ratio 1:4 from day. ‧ 國. 學. 2 to 10 (p < 0.05) and reward ratio 1:8 from day 2 to 10 (p < 0.05) but no difference between reward 1:4 and 1:8 in each of all nine days (p > 0.05).. ‧ y. sit. io. Figure 1. er. Nat. ------------------------------------. n. a-----------------------------------iv l C n hengchi U. In Figure 2, the results of ANOVA showed a significant main effect of reward ratio (F(2, 10) = 6.988, p < 0.05), a significant main effect of day (F(9, 45) = 35.66, p < 0.001), and a significant reward-ratio-by-day interaction (F(18, 90) = 3.592, p < 0.001). A test of simple main effect revealed a significant difference of reward ratio factor only on the second day (F(2, 4) = 7.484, p < 0.05). Further post hoc comparisons revealed the percentage of choosing PHR significantly higher in reward ratio 1:4 than reward ratio 1:2 (p < 0.05) and significantly higher in reward ratio 1:8 than reward 1:2 (p < 0.05).. 24.
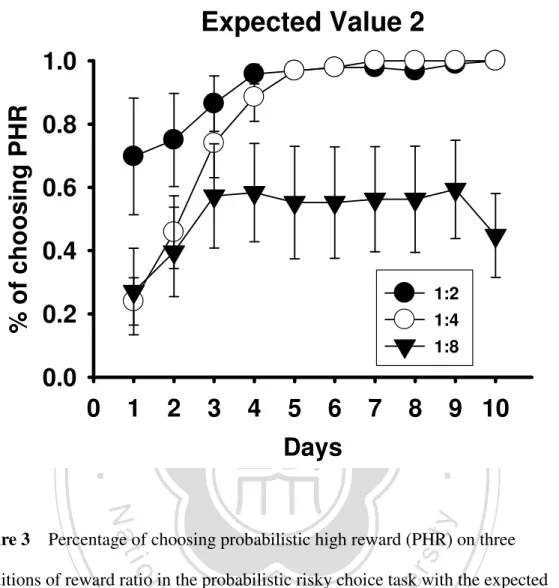
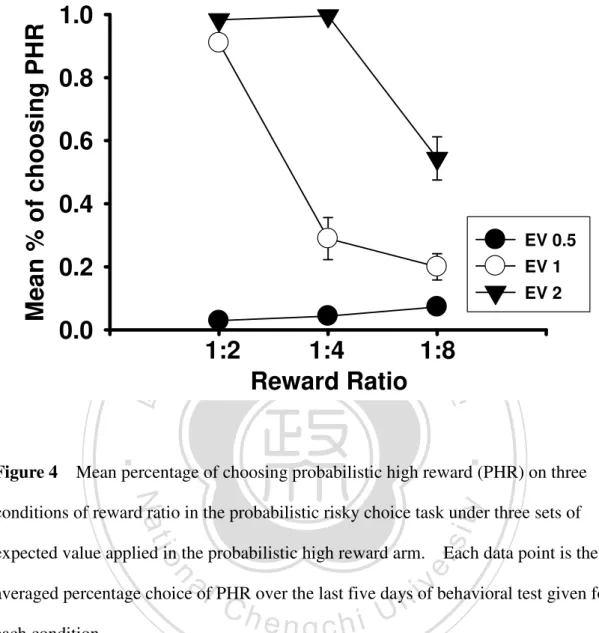
(28) -----------------------------------Figure 2 ------------------------------------. In Figure 3, the results of ANOVA showed a significant main effect of reward ratio (F(2, 10) = 8.406, p < 0.01) and a significant main effect of day (F(9, 45) = 21.836, p < 0.001).. Post hoc comparisons of reward ratio factor revealed the. percentage of choosing PHR significantly higher in reward ratio 1:2 than reward ratio. 政 治 大 And post hoc comparisons of day factor revealed the 立. 1:8 (p < 0.01) but no differences between reward ratio 1:2 and 1:4 neither reward ratio 1:4 and 1:8 (p > 0.05).. percentage of choosing PHR significant lower in day 1 than day 2 to 10 (p < 0.01),. ‧ 國. 學. day 2 lower than day 4 to 10 (p < 0.01), and day 3 lower than day 4 and day 5 (p <. ‧ y. Figure 3. io. sit. Nat. ------------------------------------. er. 0.05).. n. a-----------------------------------iv l C n hengchi U. Figure 4 shows the mean values of choosing PHR over the last five days of free choice phase on each of three reward ratios. The results of a two-way ANOVA revealed a significant main effect of EV (F(2, 10) = 77.406, p < 0.001), a significant main effect of reward ratio (F(2, 10) = 15.406, p < 0.01), and a significant EV-by-reward-ratio interaction (F(4, 20) = 9.214, p < 0.001). A test of simple main effect revealed a significant difference of EV factor on reward ratio 1:2 (F(2, 4) = 2688.648, p < 0.001) and 1:4 (F(2, 4) = 1607.175, p < 0.001) and a significant difference of reward ratio on EV=1 (F(2, 4) = 35.664, p < 0.01). Further post hoc comparisons of EV factor revealed that in reward ratio 1:2, the percentage of choosing 25.
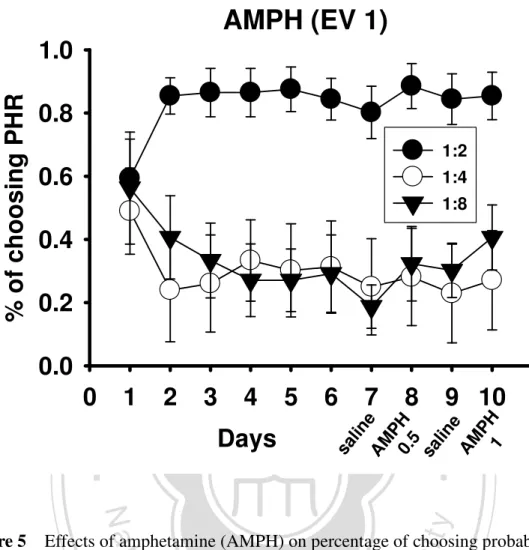
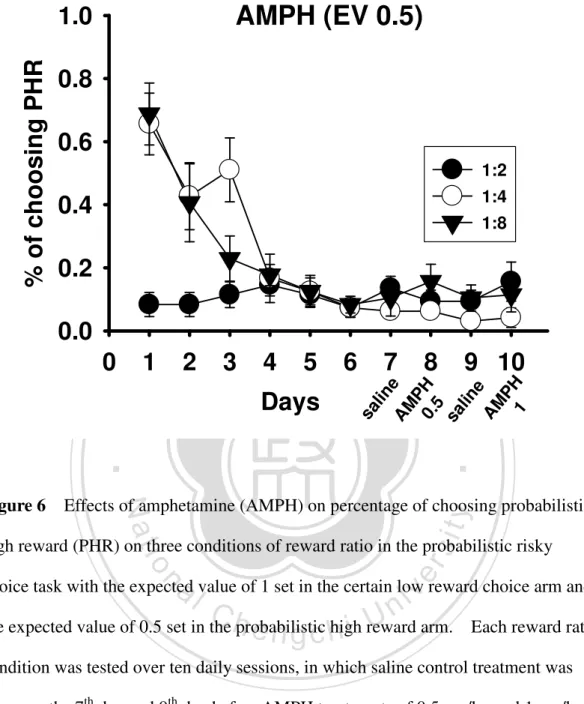
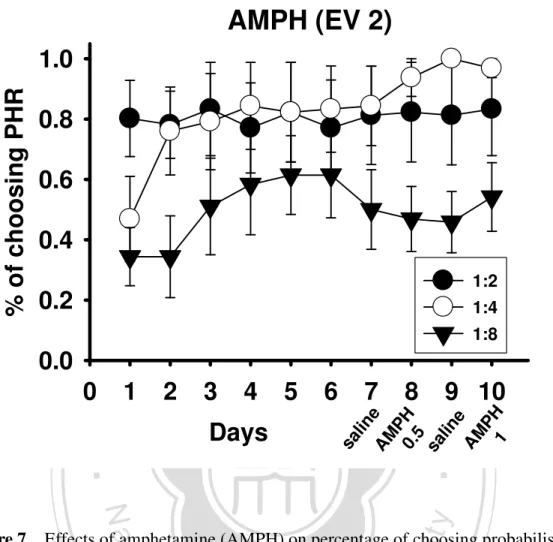
(29) PHR significant higher in EV=2 than EV=0.5 (p < 0.001) and EV=1 higher than EV=0.5 (p < 0.001); and in reward ratio 1:4, EV=2 was significantly higher than EV=1 (p < 0.01) and EV= 0.5 (p < 0.001).. The post hoc comparisons of reward. ratio factor revealed that in EV=1, the percentage of choosing PHR significantly higher in reward ratio 1:2 than reward ratio 1:4 (p < 0.01) and 1:8 (p < 0.01).. -----------------------------------Figure 4. 政 治 大. ------------------------------------. 立. Experiment 1b: Effects of amphetamine on probabilistic risky choice behavior. ‧ 國. 學. The results of Experiment 1b are presented, based on the condition of EV set in. ‧. PHR arm as 1, 0.5 and 2, in Figure5, Figure 6, and Figure 7 respectively.. In each of. y. sit. io. er. treatment.. Nat. these three figures, only the data collected in the last four days are relevant to the drug. n. a-----------------------------------iv l C Figure 5 n hengchi U ----------------------------------------------------------------------Figure 6 ----------------------------------------------------------------------Figure 7 ------------------------------------. 26.
(30) The effect of amphetamine on the present probabilistic risky choice behavior is shown in Figure 8.. For the condition of EV=1 set in both PHR and CLR arm, as. shown in the top panel of Figure 8, the main effects of dose and reward ratio, F(2, 10) = 5.798 and F(2, 10) = 6.883 respectively, are significant (p < 0.05).. Post hoc. comparisons of main effect of dose revealed that the higher dose of amphetamine (1 mg/kg) significantly increased the percentage of choosing PHR compared to saline treatment (p < 0.01). Notably, the effect of lower dose amphetamine (0.5 mg/kg) was only marginal significantly increase the percentage of choosing PHR compared to. 政 治 大 ratio revealed the percentage of choosing PHR significantly higher in reward ratio 1:2 立. saline control group (p = 0.051). The post hoc comparisons of main effect of reward. than reward ratio 1:4 (p < 0.01) and 1:8 (p < 0.01).. io. y. sit. ------------------------------------. er. Nat. Figure 8. ‧. ‧ 國. 學 ------------------------------------. al. n. v i n The data analyses for thoseC shown in the intermediate h e n g c h i U panel, as revealed by a. two-way ANOVA, neither the main effect of dose nor the main effect of reward ratio were significant (p > 0.05). Also, the test of EV-by-reward-ratio interaction was not significant (p > 0.05).. For the data presented in the bottom panel of Figure 8, none. of the tests of two-way ANOVA was significantly detected (p > 0.05, see Table 1 of Appendix for the details). -----------------------------------Table 1 ------------------------------------. 27.
(31) Experiment 2: Effects of lesion manipulations on probabilistic risky choice Histology The results of histological analyses of bilateral lesions in NAC, DLS, OFC, and mPFC were presented in Figure 9, Figure 10, Figure 11, and Figure 12 respectively. These rats showed extensive cell collapse and gliosis in the location of the lesion sites. In Figure 9, the diagram shows the histological examination of NAC. The top panel shows the diagram of the extension of NAC lesions (n = 9). The black area. 政 治 大 grey area represents the maximum lesion area. The sketch diagram was adopted 立. represents the most intensive of lesions area made for all the subjects, whereas the. from the Figure 23 of the rat brain atlas by Paxinos and Watson (2007). Bottom. ‧ 國. 學. panel shows the representative photographs of coronal sections, and the red circle. y. The areas of damage in the ventral part of striatum and did. sit. Nat. (left photo) respectively.. ‧. remarked areas highlight the location of NAC lesions (right photo) and sham lesion. io. er. not extended to the lateral ventricle.. n. al. i n Ch -----------------------------------engchi U. v. Figure 9. ------------------------------------. In Figure 10, the diagram shows the histological examination of DLS. The top panel shows the diagram of the extension of DLS lesions (n = 9). The black area represents the most intensive of lesions area made for all the subjects, whereas the grey area represents the maximum lesion area.. The sketch diagram was adopted. from the Figure 27 of the rat brain atlas by Paxinos and Watson (2007). Bottom panel shows the representative photographs of coronal sections, and the red circle 28.
(32) remarked areas highlight the location of DLS lesions (right photo) and sham lesion (left photo) respectively. -----------------------------------Figure 10 ------------------------------------. In Figure 11, the diagram shows the histological examination of OFC. The top panel shows the diagram of the extension of OFC lesions (n = 9). The black area. 政 治 大 grey area represents the maximum lesion area. The sketch diagram was adopted 立. represents the most intensive of lesions area made for all the subjects, whereas the. from the Figure 9 of the rat brain atlas by Paxinos and Watson (2007). Bottom panel. ‧ 國. 學. shows the representative photographs of coronal sections, and the red circle remarked. io. y. sit. ------------------------------------. n. al. Figure 11. er. Nat. respectively.. ‧. areas highlight the location of OFC lesions (right photo) and sham lesion (left photo). i n Ch -----------------------------------engchi U. v. In Figure 12, the diagram shows the histological examination of mPFC. The top panel shows the diagram of the extension of mPFC lesions (n = 9). The black area represents the most intensive of lesions area made for all the subjects, whereas the grey area represents the maximum lesion area. The sketch diagram was adopted from the Figure 10 of the rat brain atlas by Paxinos and Watson (2007). Bottom panel shows the representative photographs of coronal sections, and the red circle remarked areas highlight the location of NAC lesions (right photo) and sham lesion (left photo) respectively. 29.
(33) -----------------------------------Figure 12 -----------------------------------Effects of NAC lesion The results of post-lesion tests on locomotor activity and discrimination test are shown in Figure 13.. In the top panel of Figure 13, the locomotor activity of the. NAC lesion group was significantly higher than that of the sham lesion control group (t(11) = 2.94, p < 0.05).. As the intermediate panel and bottom panel of Figure 13. 政 治 大 discrimination task showed no significant difference between the NAC lesion and the 立 shows, the results of independent t-test applied on the two measures of the. sham control groups (p > 0.05).. io. y. sit. ------------------------------------. er. Nat. Figure 13. ‧. ‧ 國. 學 ------------------------------------. al. n. v i n Figure 14 shows the effectsCof NAC lesion on probabilistic risky choice behavior. hengchi U. The results of a three-way ANOVA revealed a significant main effect of lesion (F(1,. 16) = 8.954, p < 0.01), a significant main effect of reward ratio (F(2, 32) = 20.568, p < 0.001), and a significant main effect of day (F(9, 144) = 28.026, p < 0.001). Also, for the two-way interaction tests, there was a significant reward-ratio-by-day interaction (F(18, 288) = 10.023, p < 0.001) and a significant lesion-by-day interaction (F(9, 144) = 2.441, p < 0.05). However, the lesion-by-reward-ratio-by-day interaction was not significant (F(18, 288) = 1.242, p > 0.05).. In Figure 15, the tests of simple main effect of lesion-by-day interaction. revealed significantly difference in lesion factor, further post hoc revealed a decrease 30.
(34) in NAC lesion group on day 4, day 5, day 7, day 8, day 9, and day 10 (p < 0.05). The of day factor in lesion-by-day interaction revealed significant difference in NAC lesion group (F(9, 8) = 5.701, p < 0.05). Further post hoc comparisons revealed that the percentage of choosing PHR significantly higher in day 1 than day 2 to day 9 (p < 0.05), day 2 higher than day 3 to day 10 (p < 0.001), day 3 higher than day 4 to day 10 (p < 0.01), day 4 higher than day 7 to day 8 (p < 0.05), day 5 higher than day 7 to day 8 (p < 0.05), day 6 higher than day 8 and day 9 (p < 0.05), and day 7 higher than day 10 (p < 0.05). Also, a test of simple main effect of reward-ratio-by-day interaction. 政 治 大 orders of F(2, 15) = 12.462, 6.051, 14.865, 10.875, 14.092, 14.042, 21.581, 19.108, 立. revealed a significant difference of reward ratio factor on each of all ten days (in the. 14.510, and 27.064, p < 0.05) and a significant difference of day factor on reward. ‧ 國. 學. ratio 1:4 (F(9, 8) = 5.364, p < 0.05) and 1:8 (F(9, 8) = 44.287, p < 0.001).. Further. ‧. post hoc comparisons of reward ratio factor revealed the percentage of choosing PHR. sit. y. Nat. was significantly higher in reward ratio 1:2 than reward ratio 1:4 from day 2 to 10 (p. io. er. < 0.05) and higher than reward ratio 1:8 in the first 2 days (p < 0.05). Also, reward ratio 1:8 was significantly higher than reward ratio 1:4 in the first 2 days (p < 0.05).. al. n. v i n Cfactor The post hoc comparisons of day revealed that in reward ratio 1:4, the U hen i h gc. percentage of choosing PHR significantly higher in day 1 than other 9 days (p < 0.05), day 2 higher than day 3 and day 5 to 10 (p < 0.05), day 3 higher than day 10 (p < 0.05), day 5 higher than day 10 (p < 0.05), day 6 higher than day 8 (p < 0.05), day 7 higher than day 8 and day 10 (p < 0.05), and day 9 higher than day 10 (p < 0.05). And, in reward ratio 1:8, the percentage of choosing PHR significantly higher in day 1 than day 2 to 10 (p < 0.001), day 2 higher than day 3 to 10 (p < 0.05), day 4 higher than day 5 to 10, (p < 0.05), day 5 higher than day 7 and day 10 (p < 0.05), and day 8 higher than day 10 (p < 0.05).. 31.
(35) -----------------------------------Figure 14 ----------------------------------------------------------------------Figure 15 ------------------------------------. Figure 16 shows the effects of NAC lesion on probabilistic risky choice behavior. 政 治 大 The main effect of reward ratio was significant in all three blocks (p < 0.01) 立. in the first 3 days, the intermediate 4 days, and the last 3 days of ten-day free choice test.. and would not be mentioned below.. In the first 3 days (top panel), there was no. ‧ 國. 學. significant main effect of lesion (F(1, 16) = 0.2, p > 0.05) nor significant. ‧. lesion-by-reward-ratio interaction (F(2, 32) = 0.34, p > 0.05). The results of a. sit. y. Nat. two-way ANOVA revealed a significant main effect of lesion (F(1, 16) = 8.792, p <. io. er. 0.01) in the intermediate 4 days and a significant main effect of lesion (F(1, 16) = 6.939, p < 0.05) in the last 3 days (See Table 2 of Appendix for the details).. n. al. Ch. engchi. i n U. v. -----------------------------------Figure 16 ----------------------------------------------------------------------Table 2 -----------------------------------Effects of DLS lesion The effects of DLS lesion on locomotor activity and discrimination test are shown in Figure 17.. In the top panel of Figure 17, there were no differences on 32.
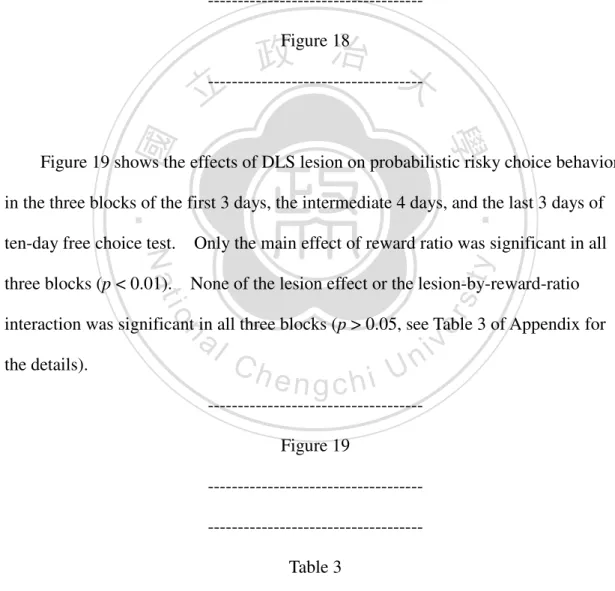
(36) locomotor activity between DLS lesion group and sham lesion group (t(10) = 0.349, p > 0.05). Also, as lower two panels of Figure 17, there were no differences on the two measures of the discrimination between two groups (p > 0.05).. -----------------------------------Figure 17 ------------------------------------. 政 治 大 The results of a three-way ANOVA revealed a significant main effect of reward ratio 立. Figure 18 shows the effects of DLS lesion on probabilistic risky choice behavior.. (F(2, 32) = 24.687, p < 0.001), and a significant main effect of day (F(9, 144) =. ‧ 國. 學. 18.684, p < 0.001). Also, for the two-way interaction tests, there was a significant. ‧. reward-ratio-by-day interaction (F(18, 288) = 18.487, p < 0.001). However, the. sit. y. Nat. lesion-by-reward-ratio-by-day interaction was not significant (F(18, 288) = 0.904, p >. io. er. 0.05). A test of simple main effect of reward-ratio-by-day interaction revealed a significant difference of reward ratio factor on each of last nine days (from day 2 to 9,. al. n. v i n C15.947, in the orders of F(2, 15) = 9.369, 21.426, 25.833, 45.589, 51.143, U h e n12.846, i h gc. 65.990, and 71.946, p < 0.01) and significant difference of day factor on reward ratio 1:4 (F(9, 8) = 3.988, p < 0.05) and 1:8 (F(9, 8) = 8.093, p < 0.01). Further post hoc comparisons of reward ratio factor revealed the percentage of choosing PHR was significantly higher in reward ratio 1:2 than reward ratio 1:4 from day 2 to 10 (p < 0.05) and higher than reward ratio 1:8 from day 3 to 10 (p < 0.05). Also, reward ratio 1:8 was significantly higher than reward ratio 1:4 in the first 2 days (p < 0.05). The post hoc comparisons of day factor revealed that in reward ratio 1:4, the percentage of choosing PHR significantly higher in day 1 than other 9 days (p < 0.05), day 2 higher than day 3 and day 5 to 10 (p < 0.05), day 3 higher than day 4 (p < 0.05), 33.
(37) day 6 higher than day 8 (p < 0.05), and day 7 higher than day 8 (p < 0.05).. And, in. reward ratio 1:8, the percentage of choosing PHR significantly higher in day 1 than day 2 to 10 (p < 0.05), day 2 higher than day 3 to 10 (p < 0.001), day 3 higher than day 5 to 10, (p < 0.01), day 4 higher than day 6 to 10 (p < 0.05), day 5 higher than day 7 and day 10 (p < 0.05), day 6 higher than day 7 to 10 (p < 0.05), and day 7 higher than day 10 (p < 0.05).. -----------------------------------Figure 18 政 治 大 -----------------------------------立. ‧ 國. 學. Figure 19 shows the effects of DLS lesion on probabilistic risky choice behavior. ‧. in the three blocks of the first 3 days, the intermediate 4 days, and the last 3 days of. three blocks (p < 0.01).. None of the lesion effect or the lesion-by-reward-ratio. er. io. sit. y. Only the main effect of reward ratio was significant in all. Nat. ten-day free choice test.. interaction was significant in all three blocks (p > 0.05, see Table 3 of Appendix for. n. al. the details).. Ch. engchi. i n U. v. -----------------------------------Figure 19 ----------------------------------------------------------------------Table 3 -----------------------------------Effects of OFC lesion The effects of OFC lesion on locomotor activity and discrimination test are shown in Figure 20.. In the top panel of Figure 20, the results of independent t-test 34.
(38) revealed a significant increase on locomotor activity in OFC lesion group than that of sham lesion group (t(16) = 2.827, p < 0.05). As for the discrimination ability, as the lower two panels of Figure 20, no differences on both of two measures of the discrimination between two groups were detected (p > 0.05).. -----------------------------------Figure 20 ------------------------------------. 政 治 大 Figure 21 shows the effects of OFC lesion on probabilistic risky choice behavior. 立. The results of a three-way ANOVA revealed a significant main effect of lesion (F(1,. ‧ 國. 學. 16) = 9.725, p < 0.01), a significant main effect of reward ratio (F(2, 32) = 17.831, p. ‧. < 0.001), and a significant main effect of day (F(9, 144) = 10.257, p < 0.001). Also,. sit. y. Nat. for the two-way interaction tests, there was only a significant reward-ratio-by-day. io. er. interaction (F(18, 288) = 8.437, p < 0.001). The lesion-by-reward-ratio-by-day interaction was not significant (F(18, 288) = 1.322, p > 0.05). A test of simple main. al. n. v i n C h revealed a significant effect of reward-ratio-by-day interaction difference of reward engchi U ratio factor on last nine days (from day 2 to 9, in the orders of F(2, 15) = 6.952,. 11.594, 9.539, 10.971, 16.946, 19.050, 26.919, 49.429, and 34.195, p < 0.01) and significant difference of day factor in reward ratio 1:8 (F(9, 8) = 6.042, p < 0.01). Further post hoc comparisons of reward ratio factor revealed the percentage of choosing PHR was significantly higher in reward ratio 1:2 than reward ratio 1:4 from day 2 to 10 (p < 0.05) and higher than reward ratio 1:8 from day 4 to 10 (p < 0.05). Also, reward ratio 1:8 was significantly higher than reward ratio 1:4 in day 2 and day 3 (p < 0.05). The post hoc comparisons of day factor revealed that in reward ratio 1:8, the percentage of choosing PHR significantly higher in day 1 than day 2 to 10 (p 35.
(39) < 0.05), day 2 higher than day 3 to 10 (p < 0.05), day 3 higher than day 5 to 10 (p < 0.05), day 4 higher than day 7 to 10 (p < 0.05), day 5 higher than day 8 to 10 (p < 0.05), day 6 higher than day 7 to 10 (p < 0.05), day 7 higher than day 8 to 10 (p < 0.05), and day 8 higher than day 10 (p < 0.05).. -----------------------------------Figure 21 ------------------------------------. 政 治 大 Figure 22 shows the effects of OFC lesion on probabilistic risky choice behavior 立. in the three blocks of the first 3 days, the intermediate 4 days, and the last 3 days of. ‧ 國. 學. ten-day free choice test.. The main effect of reward ratio was significant in all three. ‧. blocks (p < 0.01). The results of two-way ANOVA revealed only a significant main. sit. y. Nat. effect of lesion in the intermediate 4 days (F(1, 16) = 5.592, p < 0.05). None of. io. al. n. details).. er. two-way interaction was significant (p > 0.05, see Table 4 of Appendix for the. i n Ch -----------------------------------engchi U. v. Figure 22. ----------------------------------------------------------------------Table 4 -----------------------------------Effects of mPFC lesion In the sham lesion group, one rat died during surgery, and the other one rat was excluded from analyses of probabilistic risky choice behavior due to persistent of choosing left arm of the T-maze (> 93%) across all three reward ratios. 36.
(40) Figure 23 shows the effects of mPFC lesion on locomotor activity and discrimination test.. In the top panel of Figure 23, there were no difference on. locomotor activity between mPFC lesion group and sham lesion group (t(15) = 0.539, p > 0.05). Also, as lower two panels of Figure 23, there were no differences on both of two measures of the discrimination between two groups (p > 0.05).. -----------------------------------Figure 23. 政 治 大. ------------------------------------. 立. Figure 24 shows the effects of mPFC lesion on probabilistic risky choice. ‧ 國. 學. behavior. The results of a three-way ANOVA revealed a significant main effect of. y. Also, for the two-way interaction tests, there was a. sit. Nat. 126) = 8.055, p < 0.001).. ‧. reward ratio (F(2, 28) = 7.331, p < 0.01), and a significant main effect of day (F(9,. io. er. significant reward-ratio-by-day interaction (F(18, 252) = 13.656, p < 0.001). However, the lesion-by-reward-ratio-by-day interaction was not significant (F(18, 252). al. n. v i n C h main effect of reward-ratio-by-day A test of simple interaction engchi U. = 1.062, p > 0.05).. revealed a significant difference of reward ratio factor on day 1 and day 4 to 10 (F(2, 15) = 4.001 in day 1; from day 4 to 10, in the orders of F(2, 15) = 6.254, 7.842, 7.386, 13.158, 17.914, 37.756, and 27.067, p < 0.05) and significant difference of day factor in reward ratio 1:8 (F(9, 6) = 37.610, p < 0.001).. Further post hoc comparisons of. reward ratio factor revealed the percentage of choosing PHR was significantly higher in reward ratio 1:2 than reward ratio 1:4 from day 4 to 10 (p < 0.05) and higher than reward ratio 1:8 in day 1 and day 4 to 10 (p < 0.05). But there was no significant difference between reward ratio 1:4 and 1:8 in day 1 and day 4 to 10 (p > 0.05). The post hoc comparisons of day factor revealed that in reward ratio 1:8, the percentage of 37.
(41) choosing PHR significantly higher in day 1 than day 2 to 10 (p < 0.05), day 2 higher than day 3 to 10 (p < 0.05), day 3 higher than day 4 to 10 (p < 0.01), day 4 higher than day 7 to 10 (p < 0.05), day 5 higher than day 7 to 10 (p < 0.01), day 6 higher than day 7 to 10 (p < 0.05), day 7 higher than day 10 (p < 0.05), and day 9 higher than day 10 (p < 0.05). -----------------------------------Figure 24 ------------------------------------. 政 治 大 Figure 25 shows the effects of mPFC lesion on probabilistic risky choice 立. days of ten-day free choice test.. 學. ‧ 國. behavior in the three blocks of the first 3 days, the intermediate 4 days, and the last 3 In the first 3 days, a two-way ANOVA revealed. ‧. only a significant lesion-by-reward-ratio interaction (F(2, 28) = 3.755, p < 0.05).. In. sit. y. Nat. the intermediate 4 days and last 3 days, the main effect of reward ratio was significant,. io. al. n. for the details).. er. F(2, 28) = 11.509, F(2, 28) = 17.693 respectively (p < 0.001, see Table 5 of Appendix. i n Ch -----------------------------------engchi U Figure 25. ----------------------------------------------------------------------Table 5 ------------------------------------. 38. v.
(42) Chapter Four: Discussion In this present study, by the establishment of a probabilistic risky choice model in the rat, the neural substrates of risk-based decision making were systemically investigated by the use of excitotoxic lesion technique. The results of Experiment 1a show that the manipulations of different EV’s set in CLR and PHR arm significantly affected the probabilistic risky choice made by the rat. When two chosen options had the same EV = 1 set for both CLR and PHR arm, the rat exhibited different patterns of choice behavior following different reward In addition, given in options 政 治 大 with different EV’s (EV 0.5 vs. EV 1 or EV 2 vs. EV 1), the subject apparently chose 立 probabilities and magnitudes under each reward ratio.. the option which had higher EV. This finding implies that the rat may have a. ‧ 國. 學. “sense” to process basic EV in this probabilistic risky choice behavior.. ‧. The effects of amphetamine tested in Experiment 1b, showed a drug induced. sit. y. Nat. relatively risk-seeking choice behavior when the condition of EV set in both CLR and. io. er. PHR arms at 1. These results provide an evidence to support the role of dopamine system is involved in the present behavioral task of probabilistic risky choice.. al. n. v i n In Experiment 2, the resultsCshow that the lesion U h e n g c h i of NAC produced a relatively. risk-averse choice behavioral effect.. By contrast, the lesion of DLS as an anatomical. control, had no such an effect on probabilistic risky choice behavior. These findings indicate the heterogeneity of behavioral function existed between the NAC and DLS on probabilistic risky choice. Regarding to the subarea of prefrontal cortex as manipulated, the OFC lesion produced a tendency of relatively risk-averse choice behavior by the rat showing a marginal significant decrease on the percentage of choosing PHR in the last 3 days of free choice phase. By contrast, lesion of mPFC did not alter the probabilistic risky choice behavior in this study.. 39.
數據
+7

相關文件
6 《中論·觀因緣品》,《佛藏要籍選刊》第 9 冊,上海古籍出版社 1994 年版,第 1
The first row shows the eyespot with white inner ring, black middle ring, and yellow outer ring in Bicyclus anynana.. The second row provides the eyespot with black inner ring
• helps teachers collect learning evidence to provide timely feedback & refine teaching strategies.. AaL • engages students in reflecting on & monitoring their progress
Robinson Crusoe is an Englishman from the 1) t_______ of York in the seventeenth century, the youngest son of a merchant of German origin. This trip is financially successful,
fostering independent application of reading strategies Strategy 7: Provide opportunities for students to track, reflect on, and share their learning progress (destination). •
Although Taiwan stipulates explicit regulations governing the requirements for organic production process, certification management, and the penalties for organic agricultural
First Taiwan Geometry Symposium, NCTS South () The Isoperimetric Problem in the Heisenberg group Hn November 20, 2010 13 / 44.. The Euclidean Isoperimetric Problem... The proof
different spectral indices for large and small structures Several scintil- lation theories including the Phase Screen, Rytov, and Parabolic Equa- tion Method
