2005InternationalConferenceonWirelessNetworks,Communications and MobileComputing
Performance Comparison
of Indoor
Positioning Techniques
based
onLocation
Fingerprinting
in Wireless Networks
Tsung-Nan Lin,
Po-Chiang
Lin
Graduate
Institute
of
Communication
Engineering
National Taiwan
University, Taipei,
Taiwan
Email:
{tsungnan,r92942075}
@ntu.edu.twAbstract
Appropriate and correct indoor positioning in wireless networkscouldprovide interestingservices andapplications
in many domains. Thereare Timeof Arrival (TOA), Time
DifferenceofArrival (TDOA), Angle of Arrival (AOA), and
location fingerprinting schemes that can be used for positioning. We locus on location fingerprinting in this paper since it is more applicable to complex indoor
environments than other schemes. Locationfingerprinting uises received signalstrengthtoestimatelocations of mobile nodes or uisers. Probabilistic method, k-nearest-neighbor, and neural networks are pi-eviously proposed positioning techniquesbasedon locationfingerprintitng. However, most
ofthesepreviouisworks onlyconcentrate onaccuracy, which
meansthe averagedistance error. Actlually, it is notenough
tomeasure theperformanceofapositioningtechniquieby the accutracyonly. Acomprehensiveperformancecomparisonis
also critical andhelpfidl in orderto choose the mostfitting algorithmin realenvironments. In this paper, wecompare comprehensively various performance metrics including accuracy, precision, complexitv, robuistness, andscalability. Through our analysis and experiment results, k-nearest-neighborreportsthe bestoverallperformance for the indoor positioning purpose.
1.
Introduction
The popularity of wireless access infrastructure and mobile devices fulfils people's desire to access the multimedia services ubiquitously. Meanwhile,
providing additional context-aware services based on the existing wireless access infrastructure gets more and more interest. Indoor positioning is one of the important techniques to make context-aware services feasible. Many domains get benefits from indoor location information of mobile units to provide useful applications and services, such as museum tour-guide andlocation-based handoff[1] [2].
Manypositioning techniqueshave beenproposed,as introduced in[12-14], andthey couldbeclassified into
This workwassupported inpartby YULON NISSAN Motor Co
undergrant94-S-C04-H andbyTaiwanNational Science Council undergrant93-221 3-E-002-057.
the following categories, including Time of Arrival (TOA) [23], Time Difference ofArrival (TDOA) [3] [4], Angle of Arrival (AOA) [5], and location fingerprinting [6] [20-22]. However, not all techniques are suitable for indoor positioning because of the complexity in the indoor environments. TOA,
TDOA, andAOAall estimate thelocation based on the triangulation technique which requires the line-of-sight (LOS) between the transmitter and the receiver [24]. Fornormal indoorenvironments, it isdifficulttofinda LOS between the transmitter and the receiver. Therefore, the time and angle of arrival signal would beaffected by the multipatheffect, thus the positioning accuracy would be reduced. Moreover, the measurement of time and angle of arrival signal
requires special hardware, so the cost for the positioning task would be high. The last category, location fingerprinting, which could overcome the drawbacks mentioned above, use the received signal strength (RSS) at the sampling locations to build a
";radio
map" for the target environment. Location fingerprinting performs well for non-line-of-sight (NLOS) circumstances and LOS environments are not required. Thus it is suitable for indoor positioning. There are two stages for location fingerprinting: off-linestage and on-line stage. During off-line stage, site survey is performed in the target environment to collect the RSS from nearby base stations at sampling locations. Somepreprocessing may be needed in this stage. In the on-line stage, the positioning techniques measure the RSS in real-time and calculate the estimated location coordinates basedon theknowledge builtduring the off-line stage.Probabilistic method, k-nearest-neighbor, and
neuiralnetworks are three popularmachine techniques which can be usedin locationfingerprinting. Youssef et. al. proposed ajoint clustering technique for indoor positioning, whichis based onprobabilistic method[7]. Bahl et. al. proposed an in-building user location and tracking system - RADAR [8], which adopts
pick the one that best matches the observed signal strength. Neural networks have been shown to be capable of approximating any nonlinear function to certain degree of accuracy [10]. Therefore, Battiti et. al. use neural networks to model the nonlinear mapping between the location information and theRSS [15]. However, there is no comprehensive performance comparison about them so far, so it is hard to say which one is better. Most ofthe previous works only concentrate on the accuracy, whichmeans the average distance error, but it is notenough. Inthis paper, we perform comprehensive performance comparison based on five important criteria, including accuracy, precision, complexitv, robustness, and scalabilitv. Inadditiontotheaccuracy, weanalyzethe distribution of distance errors, which is called precision. The positioning technique with precision concentrated onsmall values of distance errors would be preferred, since it is more likely to get small distance error. Complexity considers the computing
time and consumed power in the on-line stage, which is critical when we implement positioning techniques in mobile devices that have limited CPU power and battery life. Furthermore, apositioning techniquewith high robustness could function normally even when some of the observed signal strength is never seen before, or when some base stations are unavailable. Scalability ensurestheregular positioning algorithm is stillfunctional when the scope of the environment gets large.
This paper is organized as follows. Section 2 discusses the three indoorpositioning techniques based onlocationfingerprinting. Insection 3,weexplain the experiment environmentandtools using for this paper. Section 4 presents the five important performance criteria and comparison results. Finally, section 5 concludes the paper.
2. Indoor
Positioning
Techniques based
on
Location
Fingerprinting
Location fingerprinting regards the positioning problem as a pattern classification problem [9]. The estimated location coordinate is calculated based on the radio map built in the off-line stage and the different supervisedlearningmethodsmentioned in the
following subsections. 2.1 Probabilistic Method
Supposethat there are n locationcandidates
b,
02,(3,
..., w, This means there are n classes, and the mostappropriate one ischosenbased on theposteriori probability. During the off-line stage, the RSS from nearby base stations is measured in these n samplinglocations. Suppose vector S is the observed RSS
during on-line stage, and then the location candidate &, is chosen if itsposteriori probability is thehighest.
Thedecisionrule is:
Decide oi if
P(&il
S)>P(O1j S), fori,j= 1, 2, 3,...,n,jiFromBayes'theorem:
5(o
)
-P(SKIO1i)
P((1)
p(S)
posteriori probability P(
,l
S) is the combination of likelihood P( S &i), prior probability P(o), and observed evidenceP(S). SinceP(S) keeps thesame for one positioning process, and the prior probability P( o,) thatamobile nodelocates at a specific location is assumed to be the same for all over the target environment, the comparison of the posteriori probability could be considered as the comparison of likelihood:Decide
&.i
ifP(SI
) >P(SIo1),
fori,j=1,2,3,..., n,j.iThe likelihood of each location candidate is assumedtobethe Gaussian distribution. Therefore,by parametric learning, themeansand standarddeviations of each locationcandidate couldbecalculated from the sample data. The base stations in the environmentare assumedtobeindependent, sotheoverall likelihood of one location candidate can be calculated by directly multiplying the likelihoods of all base stations:
P(9
I
oij)=
P(Sl
I
Oji)x
P(S,?
I
oij)x
...xP(Sm
oi)(2)
where m is the numberofbase stations and
Sj
means the RSS fromthej-th base station.In order to interpolate the position coordinates to give more accurate results, we calculate the estimated location (x, y) as the average of the coordinates of all location candidates by adopting their posteriori probabilities as weights.
(x,
y)=ZE(P(wi
S (XZ,(3)
i=l
2.2K-Nearest-Neighbor
K-nearest-neighbor [9] calculates the distances between the observed signal strength and all the sample data sets in the previously-installed database. Assumes, is thej-th sampling data from the i-th base station, and
Si
is the observed signalstrength from the i-th base station in theon-line stage, where i= 1, 2, .... m,j= 1, 2, ..., n,m isthenumber ofbase stations in the environment,and n is the numberofsample data sets. ThedistancebetweenSiand thes,j
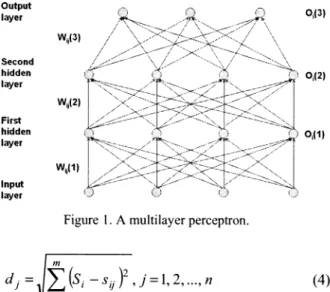
data set for all base stationsis:Output layer Wip(3) Second hidden layer Wij(2) First hidden layer Wi,,1) Input layer Oi(3) 0,i2) 001)
Figure 1.Amultilayer perceptron.
Inm
di
(Si
-s4)2
,j=l,2,...,n
After calculated the distance with respect to whole sample set, a set ofk data samples from database is chosen according the smallest dista Then, by averaging these k location coordinates, location (x,y) of the on-line collected signal car estimated.
k
(x,y)= k(Xi,
Yii=1
where (xi,
Yi)
is the location coordinates ofthe candidate.2.3 NeuralNetworks
Neural networks are proved to be effectil constructing the non-linear input-output mapping have been used in several applications such
classification, approximation, and regularization
[
The multilayer perceptron (MLP) is one of the n
common neural networks that adopt the superv leaming algorithms. MLP consists ofa set ofsen, units that constitutes the input layer, one or n
hidden layers of computational neurons, andan ou layer. The input signalpropagates through thenetu inaforwarddirection,on alayer-by-layer basis. Fi
1 displays aMLP withtwo hidden layers. The ou
of the ithneuronattheIthlayercanbedescribedas
N,,
ai
(I)=
S)j4
()
oi
(I-I)
+oi (I)
j=1 °i
(I)= f(a (I))
where
ai(l)
andoi(l)
are the activation and ou value of the neuron i in the Ith hidden layer. activation is theweighted sumof outputfromneur at (1- 1)th layer plusthe bias term.oj(l)
refers to weight connectingthe output from thejthneuron at 1 layerto the input of the ith neuron at the Ith laFigure2. Partofthe fifth floorplaneofNTUEE,wherewe
performntheexperiment. Theblack dotsshow the locations
oftheaccesspoints.
(4)
The functionf
is a smooth nonlinear differentiable everywhere). Usually it the function:the
f(x)=
ince.
l+e-x
the or the hyperbolic tangent function:
'ibe f
(-e
f(x)
=t~anhf
x=e
y2
1
+e-x
(5) The MLP can be viewed as a nonlinear input-output
mappingfromann-dimensionalEuclidean inputspace
i-th to an m-dimensional Euclidean output space. The universal approximation theorem provides the mathematical justification for the approximation ofan
arbitrarycontinuousfunction[16-19].
aeld
3. Experiment Environments and Toolsasn
In order to compare the performance of the three10].
techniques
mentionedabove,
wecollectsignal strength
most inareal environment. Figure2 showstheenvironment
ised
isory
where we perform theexperiment. The dimension of the corridor is 24.6 x 17.6 meters. Every place inthissory environment is covered by at least five IEEE 802.1 lb
ltpUt APs. We adopt an IBM ThinkPad T40 laptop as the
tork
mobile node, with RedHat 7.1 Linux operating system.guork
A Lucent WaveLan/IEEE Wireless Card withltput Youssef's driver [11] is installed to gather signal
stput
strength
fromnearby
APs.*:
Wecollecttwo groupsofsignal
strength
foroff-line (6)measuring
and on-linetesting
purpose. First wemeasuresignalstrengthat42 sampling locationsonthe
corridor for the firstgroup. These sampling locations areseparatedby 2 meters. Ateachlocationwecollect
itput 100 samples ofthe signal strength. Then we collect
The another set of signal strength in 84 positions at
rons different time for the second group. These locations
the are separatedby 1 meter. At each locationwe collect
it - 100samplesofthe signalstrength.
function
(i.e.,
is a sigmoid(8)
2 10 .5 tI , I es 1( 20 30 40 50 60 70 80 4(2 100 NumberofSmiples
Figure 3. Accuracy of the threepositioning techniques Byparametriclearning from the sample data, weget the estimate of the means and standard deviations of the likelihoods used in theprobabilistic method. In k-nearest-neighbor, there are no preprocessing requirements. We change the number of the nearest neighbors, k, from I to 2 and4 to see the effects. In neuralnetworks, we adoptthree-layer MLP topology. Neural Network Toolbox in Matlab is used for designing, training and testing. We adopt sigmoid functionasthe transfer functionof neurons, andsetthe number of iterations as 1000. We also change the number of hidden layerneurons from 4to8 and 16to see itseffects.
4. Performance Criteria
and
Comparison
Results
The following describes the five performance criteria andourexperiment results basedonthesample data andpreprocessing results got in Section 3.
4.1Accuracy
Accuracy shows how accurate the positioning techniques could achieve. We adopt mean distance error as the performance metric, which is the average Euclidean distance between the estimated location
(x, y) andthe truelocation(x,y):
E(distance
error) =E(
(x - x)2+ (y -y)2
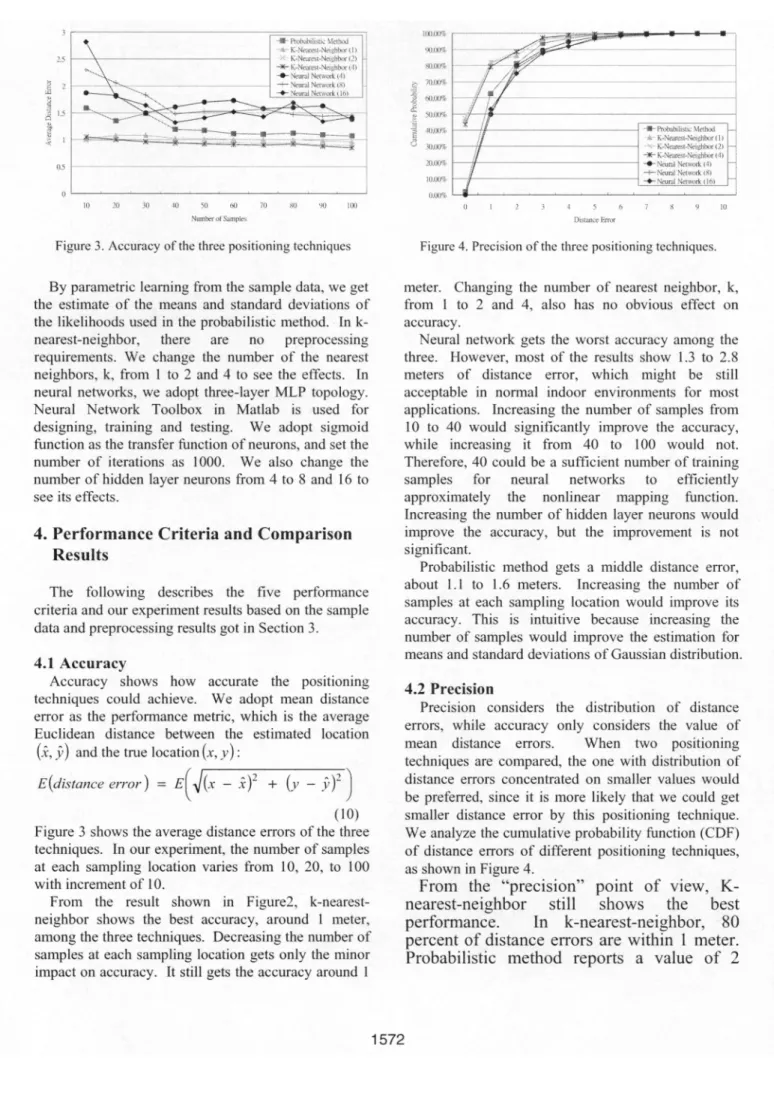
(10) Figure 3 shows the average distanceerrorsof the three techniques. In ourexperiment, the numberofsamples at each sampling location varies from 10, 20, to 100 with increment of10.From the result shown in Figure2, k-nearest-neighbor shows the best accuracy, around I meter, amongthe three techniques. Decreasing the number of samples ateach sampling locationgetsonly the minor impact on accuracy. It still gets the accuracy around 1
9 70.(0% 0.00% C 70.00% 20.00% 10.00% 0.00% -_-WPn6bilisgiwMethod_ AK-Neaeo-Neighbr (0I _ -K-Nearer-Neioh00r (2)_ -X-K- t-Neighbor(4) _ --Neusa Netork (4) -+--N-] Neo-k (8) -_-NeuradNetwork (16) _ 0 1 2 3 4 5 6 7 8 9 10 Disamce E-r
Figure4.Precision of the threepositioningtechniques.
meter. Changing the number ofnearest neighbor, k, from 1 to 2 and 4, also has no obvious effect on accuracy.
Neural network gets the worst accuracy among the three. However, most ofthe results show 1.3 to 2.8 meters of distance error, which might be still acceptable in normal indoor environments for most applications. Increasing the number of samples from 10 to 40 would significantly improve the accuracy, while increasing it from 40 to 100 would not. Therefore,40 could be a sufficient number of training samples for neural networks to efficiently approximately the nonlinear mapping function. Increasing the number ofhidden layer neuronswould improve the accuracy, but the improvement is not significant.
Probabilistic method gets a middle distance error, about 1.1 to 1.6 meters. Increasing the number of samples at each sampling location would improve its accuracy. This is intuitive because increasing the number of samples would improve the estimation for meansand standarddeviations of Gaussiandistribution.
4.2 Precision
Precision considers the distribution of distance errors, while accuracy only considers the value of mean distance errors. When two positioning techniques are compared, theone with distribution of distance errors concentrated on smaller values would bepreferred, since it is more likely that we could get smaller distance error by this positioning technique. We analyze thecumulative probability function (CDF) of distance errors of different positioning techniques, as showninFigure4.
From the
"precision" point of view,
K-nearest-neighbor still shows the best
performance.
In
k-nearest-neighbor,
80
percent
of distance errors
are
within 1
meter.
Probabilistic method reports a value of 2
meters to reach the
same cumulative
probability.
In
the neural
networks, 80
percent of
distance
errors are within 2 to
2.5
meters, which
is
dependent
on
the
number
of
hidden layer neurons. This
analysis
shows
consistent
result
with
the
accuracy
companson.
PcationtneTehuiqws Conputin- Time
PrcbabilitcMiethod 2seconds
K-
Neare-Neigh-bor.e
. lo ci10econd 100rnip1esateachiamhnglcaticn)K-N-earet-Neihbor.
(10sample-sateachsamphnstocation)
NeuralNetwoiksm0:s -25seconds
Tabble1.
Comput'ig
timeofthethreepounomng :ecd=ques
4.3
Complexity
Complexity considers the computing time required for the on-line stage. When the computation is performed on the mobile node, the impact of complexitywouldbeobvious. Becauseof theshortage of CPUprocessing powerandbattery life in a mobile device, the positioning technique with smaller complexity would be preferred. In the experiments,
werepeateachpositioningprograms for 2500 timeson an IBM ThinkPad T40 laptop with Intel 1600 MHz CPU. Table 1shows therespectivecomputing time.
When applying 100 samples at each sampling location, k-nearest-neighbor requires the most computingtimecomparingtothe othertwotechniques. Neural networkneeds the leastcomputing time, but its accuracy is thepoorestof the three. There isatradeoff between complexity and accuracy / precision. It is noted that the complexity of k-nearest-neighbor is strongly dependent on the number ofsamples at each sampling location, while the other two are not. Decrease the number of samples at each sampling locationto 10wouldimprove the computing time of k-nearest-neighbor to competitive 1 second, while still keepsconsiderably accurate.
4.4 Robustness
Apositioning technique with high robustness could functionnormally for thefollowingtwocases.
Case 1. when someofthe observedsignal strength is neverseenbefore:
For probabilistic method, since Gaussian distribution is continuous, even the never-seen signal strength would get respective likelihood value.
Therefore, probabilistic method is able to function
normally.
For k-nearest-neighbor, the arbitrary value of the
signal strength could be used to calculate the distance in the signal space. Therefore, the never-seen signal strengthwouldnotbeaproblem.
Since neural networks have the generalization capability,the never-seensignal strengthwould not be aproblem,either.
Case 2. whensomebase stations become unavailable: Assume that the u-th base station is unavailable. Its signal strength is
Su
. The number of available base stationschangesfrom m to(m -1).For probabilistic method, we simply set the likelihood
P(Su
wi)=1 for all location candidates, and then formula(2) could function as usual.For k-nearest-neighbor, we change from m-dimensional to (m - 1)-dimensional signal space, and thenk-nearest-neighborfunctionsnormally.
For neural networks, we could assign a value smaller than allvalues we seenbefore (-100 dBm, for example) to
SU,
sothe positioning could still function. However, choosing a representative value requires a carefulconsideration.4.5 Scalability
Scalability ensures an algorithm can reuse its knowledge (parameters constructed previously) when the scope ofthe environment gets large. Usually the radio cover range of abase station has some limit. A large area might not be covered by the same set of base stations. Some positioning techniques may require extrapreprocessingtohandle this problem.
Assuming there are totally M base stations in the whole environment, and we collect data from m base stationsduring the on-line stage.
Forprobabilisticmethod,wefirst check the database. Ifthe location candidate t); is not covered by these m base stations, we set its posteriori probability
P(wjIS)
tobe0, which means that the mobile node is probably not atthislocation candidateFor k-nearest-neighbor, only the subsets ofsample data that contain these m base stations are chosen. Then we perform calculation as subsection 2.2 describesaccordingtothese subsets of sampledata.
Neural networksrequire the input base stationstobe fixed, in order to be trained and tested. We have to divide the whole area into several smaller sub-areas. Each sub-area is coveredbya setofbase stations. We design and train a neural network for each sub-area. Whileperforming positioning, first ofall, wehave to decide which sub-area the mobile node maybelongto by checkingthe sensed base stations, and thenwecan
perform positioning by means ofthe specified neural network usingin thatsub-area.
5.
Conclusion
For many location-based services and applications,
it is crucial to find out an appropriate and correct positioning technique. The probabilistic method, k-nearest-neighbor, and neural networks are techniques of estimating the location based on information of received signal strength. In this paper, we achieve comprehensive comparison ofthree indoorpositioning techniques based on location fingerprinting. We compare performance of five performance criteria, including accuracy, precision, complexity, robustness, and scalability. Additionally, we find out that k-nearest-neighbor gets the best performance with high accuracy and precision, and its complexity could be reduced to a competitive level, while still keep good accuracy. Furthermore, k-nearest-neighbor could handle the robustness and scalability issues by little or no extraefforts.
6. References
[1] S.Thrun, "Probabilistic algorithms in robotics," Al Magazine, 21(4):93-109,2000.
[2] M. H. Jin, H. K. Wu, and J. T. Hormg, "An Intelligent Handoff Scheme Based On Location Prediction Technologies", IEEEEuropean Wireless 2002.pp. 551
-557, Feb.2002
[3] M. A. Spirito, "On the Accuracy of Cellular Mobile
Station Location Estimation", IEEE Transactions on
VehicularTechnology, Vol. 50,No.3, May 2001. [4]T. S. Rappaport, J. H. Reed, andD. Woerner, "Position
location using wireless communications onhighways of thefuture", IEEEComm. Magazine, Vol. 34, pp. 33-41,
Oct. 1996.
[5] S. Tekinay, "Wireless Geolocation Systems and Services," Special Issue of theIEEE Comm. Magazine, April 1998
[6] M. Brunato and C. K. Kall6, "Transparent Location
Fingerprinting for Wireless Services," technical report
DIT-02-07 1, Informatica e Telecomunicazioni,
UniversityofTrento,2002
[7] M. A. Youssef, A. Agrawala, A. U. Shankar, "WLAN
Location Determination via Clustering and Probability Distributions," IEEE International Conference on
PervasiveComputing and Communications, 2003.
[8] P. Bahl and V. N. Padmanabhan. RADAR: An
In-BuildingRF-based User Location and TrackingSystem. InIEEEInfocom2000,volume2,pages 775-784, March
2000.
[9] R. 0. Duda, P. E. Hart, D. G., "Pattern Classification,"
SecondEdition,JohnWiley,2000
[101 S. Haykin, "Neural Networks - A Comprehensive Foundation," SecondEdition,Prentice-Hall, 1999. [I1]M. A. YoussefsWebPage,
http://www.cs.umd.edu/users/moustafa/
[12] J. Hightower, G. Borriello, "Location systems for
ubiquitous computing," IEEE Computer Magazine, volume 34,issue 8, Aug.2001,pp.57-66.
[13] K. Pahlavan, X. Li, J. Makela, "Indoor geolocation science and technology," IEEE Communications Magazine,February2002.
[14] Y.Zhao, "Mobile phone location determination and its
impact on intelligent transportation systems," IEEE
Transactions onIntelligent Transportation Systems,Vol.
1, No. 1, March2000.
[15] R. Battiti, T. L. Nhat, A. Villani, "Location-aware computing: a neural network model for determining location in wireless LANs," Technical Report DIT-02-0083, Department of Information and Communication Technology, University of Trento, Feb.2002.
[16] G. Cybenko, "Approximation by superpositions of a sigmoidal function," Mathematics of Control, Signals, and Systems, 2(4):303-314, 1989.
[17] K. Funahashi, "On the approximate realization of continuous mappings by neural networks," Neural Networks, 2(3):183-192, 1989.
[18] K.Hornik, M. Stinchcombe, andH.White, "Multilayer feedforward networks are universal approximators," NeuralNetworks, 2(5):359-336,1989.
[19] B. Irie and S. Miyake, "Capabilities of three-layered perceptrons," in Proceedings of the IEEE International Conference onNeural Networks, volume 1, pages 641-648, SanDiego, CA, 1988.IEEE.
[20] K. Kaemarungsi, P. Krishnamurthy, "Properties of indoor received signal strength for WLAN location fingerprinting," in Proceedings of the First Annual
International Conference on Mobile and Ubiquitous Systems: Networking and Service, 2004.
[21] A. Taheri, A. Singh, E. Agu, "Location fingerprinting on
infrastructure 802.11 wireless local area networks (WLANs)
using Locus," in Proceedings of the 29th Annual IEEE
IntemationalConference on Local ComputerNetworks, 2004. [22] K. Kaemarungsi, P. Krishnamurthy, "Modeling of indoor
positioning systems based on location fingerprinting," IEEE
fNFOCOM 2004.
[23] P.H.Dana, "Globalpositioning system overview,"
http://www.colorado.edu/geography/gcraft/notes/gps/gps.html
[24] J. Hightower, G. Borriello, "Location sensing techniques," technical report UW-CSE-01-07-01, Computer Science and Engineering,University of Washington, August 8,200 1.