NONPOINT SOURCE POLLUTION POTENTIAL INDEX: A CASE
STUDY OF THE FEITSUI RESERVOIR WATERSHED, TAIWAN
Kung-Cheh Li* and Mei-Chin Yeh
ABSTRACT
Nonpoint pollution has become the main source of water pollution in Taiwan. In recent years, the Feitsui Reservoir has been threatened by eutrophication due to the nonpoint pollution from its watershed. This study develops a nonpoint source pollu-tion potential index (NPPI) to identify and rank critical contributing areas in the Feitsui Reservoir watershed, so that, where appropriate, best management practices (BMPs) can be initiated to efficiently improve water quality. The NPPI ranking model is an aggregation function, composed of six subindices − runoff volume, specific peak run-off rate, soluble nitrogen (N), phosphorus (P) and chemical oxygen demand (COD) in the runoff and specific sediment yield, each with a relative importance weighting. The NPPI ranking system can be used not only as a management tool to prioritize the critical pollutant source areas on a regional watershed basis, but also as a policy deci-sion-making tool to evaluate the effects of applying alterative BMPs for targeting the problem of nonpoint pollution.
Key Words: nonpoint source pollution, potential index, Feitsui Reservoir, watershed management, best management practices.
*Corresponding author. (Tel: 23698112; Fax: 886-2-23638173; Email: [email protected])
K. C. Li and M. C. Yeh are with the Graduate Institute of Envi-ronmental Engineering, National Taiwan University, Taipei, Tai-wan 106, R.O.C.
I. INTRODUCTION
M o s t w a t e r s h e d s i n T a i w a n h a v e b e e n overdeveloped. Additionally, the high potential for pollution, due to erosion from the denudation process, as well as excessive output of nutrients from agricul-tural activities, has degraded the quality of bodies of water. Consequently, many of these upland water-sheds have become significant sources of nonpoint source pollution. Unfortunately, Taiwan’s authori-ties do not have a useful tool to identify and priori-tize where remedial measures should be taken to con-trol nonpoint source pollution.
An agricultural pollution potential index was developed to identify and rank the nonpoint source p o l l u t i o n p o t e n t i a l s o f 1 0 4 w a t e r s h e d s i n Pennsylvania, USA. This ranking index, consisting of four components - a runoff index, a sediment
production index, an animal loading index, and a chemical use index, was used to predict the relative potentials for agricultural nonpoint source pollution in these watersheds. Each index accounted for 25% of the final index. Ten out of 104 watersheds were screened as prioritized areas to be investigated (Hamlett et al., 1992). A combined potential rating factor, which included a watershed delivery factor, a groundwater delivery factor, an animal nutrient factor, and a management factor, each with a relative weight of importance, was used by Brenner and Mondok to evaluate the nonpoint source pollution potential of an agricultural watershed (Brenner and Mondok, 1995). The potential rating factor for the watershed was found to be significantly correlated with four water quality variables − fecal coliform, phosphate, nitrate and percent of saturation of dissolved oxygen. Furthermore, a potential pollution hazard index, called the nonpoint source agricultural hazard index (NPSAHI) was used in the province of Cremona, Italy, with particular reference to groundwater pollution. Two categories of parameters were considered in NPSAHI − hazard factors, which represent the farm-ing activities that impact groundwater, and control
factors, which are adaptations of the hazard factors to the characteristics of the site (Trevisan et al., 2000). Previous studies have emphasized that the proposed nonpoint source potential indices of watersheds were restricted to the study area, and specific to local conditions. Unfortunately, little research has applied the nonpoint source pollution potential index in Taiwan. Undoubtedly, developing a potential index which can be adapted to Taiwan’s conditions should be studied.
This study aims to develop a nonpoint pollution potential ranking system in terms of a potential in-dex which is well suited to represent the nonpoint s o u r c e p o l l u t i o n c h a r a c t e r i s t i c s o f T a i w a n ’ s watersheds. Using this localized Nonpoint Source Pollution Potential Index (NPPI) − a ranking model comprised of the components responsible for nonpoint source pollution, Taiwan’s authorities can rank the nonpoint pollution potentials of watersheds, identify critical contributing areas, and initiate control strate-gies to target nonpoint source pollution of high pri-ority watersheds. The Feitsui Reservoir watershed, located in northern Taiwan, is the main source of potable water for Taipei city, Taiwan, and has suf-fered eutrophication in recent years. Thus this water-shed was the area studied for this paper. The meth-odological approach followed in this study may be applicable to other watersheds in Taiwan.
II. STUDY AREA
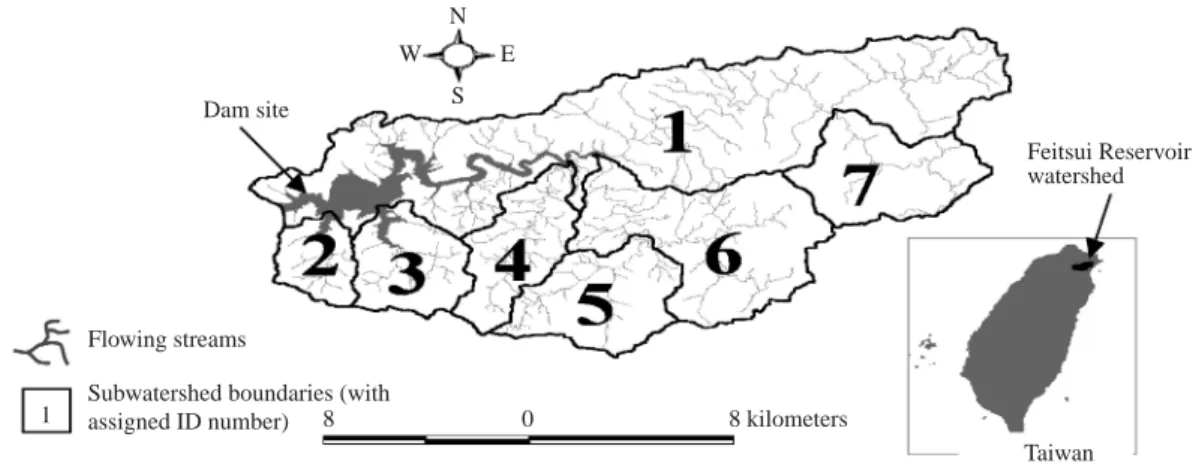
The Feitsui Reservoir was selected as the site of a case study, since it is a water body affected mainly by nonpoint source pollution, which is typi-cal for several reservoirs in Taiwan. The Feitsui Res-ervoir is located in Taipei County in northern Taiwan. This reservoir is around 30 km from Taipei city. The Feitsui Reservoir was completed in 1987, with a stor-age volume of 406 million cubic meters and a
watershed area of 303 Km2
. The major function of the reservoir is domestic water supply. The reser-voir watershed is segmented into seven subwatersheds (Fig.1). The reservoir’s main inflow is from the P e i s h i h C r e e k s u b w a t e r s h e d , d e s i g n a t e d a s subwatershed 1. Six other subwatersheds, called Hosaucha Creek, Hokuntze Creek, Kinkalau Creek, Kupolau Creek, Cheniche Creek, and Wantan Creek subwatersheds, contribute flow into the reservoir, and are designated by this study as subwatersheds two, three, four, five, six, and seven, respectively.
Excess pollutants and nutrients in the watershed come mainly from agricultural activities, including orchards, tea and vegetable farming. Additionally, a high quantity of sediment is transponted into the res-ervoir and becomes another source of nonpoint source pollution. Feitsui Reservoir has suffered from eutrophication due to a significant input of pollutants. Therefore, a nonpoint source pollution potential in-dex system must be developed for identifying criti-cal contributing subwatersheds. A lack of such in-formation can result in misdirected efforts, misspent funds, and, most importantly, continued nonpoint pollution.
III. DEVELOPMENT OF THE NONPOINT SOURCE POLLUTION INDEX (NPPI)
METHOD
An “increasing scale” for the pollution poten-tial index was adopted in this study. An index value, which increases with increasing pollution potential, is universally accepted. Thus, the “increasing scale” form was chosen for the developed potential index. Additionally, the contributing factors are defined as those factors responsible for the nonpoint source pol-lution of the watershed.
Calculating a nonpoint source pollution index involves two fundamental steps − first, calculation
Flowing streams Dam site
Subwatershed boundaries (with
assigned ID number) 8 0 E W S N Feitsui Reservoir watershed Taiwan 1 8 kilometers
of the subindices of the factors that contribute to the overall index, and secondly, aggregation of the subindices into an overall index, called the Nonpoint Source Pollution Potential Index (NPPI). A subindex
Ii ranges from zero to 100 in an “increasing” form. The subindex Ii for the ith contributing factor is de-termined using the subindex function fi(Xi), in which
Xi denotes observed or estimated value of the ith con-tributing factor.
Once the subindices are calculated, they are ag-gregated in a second mathematical step to generate the overall index. A weighted linear sum of the subindices is chosen as the aggregation function to eliminate the ambiguous region of the index (Ott, 1978). The weights (Wi) of the contributing factors are selected so that their sum is unity. The overall index is equal to the weighted linear sum of the subindices times a scaling factor (α). The scaling factor (α) is to accommodate the product to the NPPI classification for a given watershed. Accordingly, the overall index, which is also called NPPI, has the following form: NPPI =α
Σ
WiIi i = 1 n WiΣ
i = 1 n = 1.0 (1)where Ii = subindex of the ith contributing factor
n = number of contributing factors Wi= weight of the ith contributing factor
α = scaling factor
In the formulation of the NPPI ranking system, the contributing factors responsible for nonpoint pol-lution must be selected and their relative weights determined. Moreover, the subindex function must be developed. A formal procedure based on the Rand Corporation’s Delphi technique (Dale and English, 1999) was used to avoid subjective judgment. The method avoids the shortcomings of a group meeting by mailing questionnaire surveys to obtain the opin-ions of experts. A panel of 51 persons with expertise in watershed management was invited to participate in the study. The 51 persons included 24 university professors, 19 civil servants in environmental authorities, five consulting engineers, and three mem-bers of environmental action groups and conserva-tion organizaconserva-tions. In the Delphi exercise, the ques-tionnaire posed questions about the contributing fac-tors and the weight of each contributing factor under study. The anonymity of individuals providing re-sponses to the questionnaires was preserved. Itera-tions of the questionnaire survey were used to give individuals a chance to revise their previous answers based on the judgments of the others in the panel.
By using the Delphi technique, six contributing factors, including (1) runoff volume (RV); (2) spe-cific peak runoff rate (SPRR), (3) soluble N in the runoff (SN); (4) soluble P in the runoff (SP); (5) chemical oxygen demand (COD) in the runoff; and (6) specific sediment yield (SSY) were determined by a consensus of the experts. The weights (Wi) of each contributor to the nonpoint source pollution were 19.4% for RV (W1), 13.5% for SPRR (W2), 16.7% for
SN (W3), 16.2% for SP (W4), 12.4% for COD (W5)
and 21.8% for SSY (W6). The sum of the weights of
these six contributing factors is unity. A geographic information system (GIS) combined with the Agri-cultural Nonpoint Source (AGNPS) model was se-lected for a simulation to determine the numerical value for each contributing factor (Xi) in the Feitsui Reservoir watershed. AGNPS (Young et al., 1989) is a physically-based model developed for evaluat-ing upstream land erosion and water quality. It is a grid-based model for single storm event simulation. In applying AGNPS, each subwatershed was divided into grids of rectangular cells, and the input data for AGNPS required for computing these contributing factors were obtained from published reports of the Taipei Feitsui Reservoir Administration, Taiwan, and from available watershed records. Specific studies have been conducted to calibrate and verify the AGNPS model parameters for the Feitsui Reservoir watershed by the Taiwan Water Resources Bureau. These parameter values have then be taken to estab-lish a data bank, namely, AGNAUTO. This study re-trieved the parameter values of AGNPS from AGNAUTO. Moreover, a 25-year, one-hr, 98.3 mm storm was adopted to run the AGNPS model.
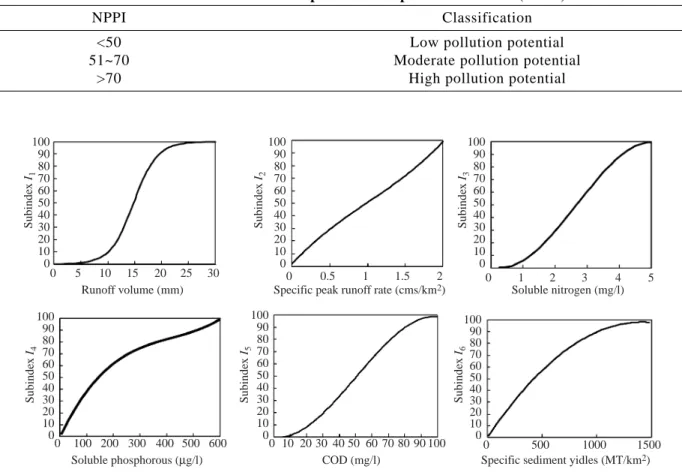
A set of rating curves − one for each contribut-ing factor (Xi), were first plotted accordcontribut-ing to the experts’ judgment, to derive the subindex functions
fi(Xi). Each curve represents the relationship between the variation of the subindex (Ii) and the variation in each contributing factor (Xi). Combining the experts’ curves yielded a set of average curves for the con-tributing factors, as shown in Fig. 2. Once these rat-ing curves were obtained, SPSS software was em-ployed to derive the subindex functions, Ii=fi(Xi), best fitted to these rating curves, by regression. These derived subindex functions are as follows.
I1= 100
1 + 999×e– 0.4568X1 (2)
where I1 = subindex for runoff volume
X1= runoff volume, mm
I2=8.0287X23−24.327X22+65.251X2+1.6759 (3)
X2= specific peak runoff rate, cms/km2 I3=-1.9703X33+15.769X32−10.109X3+2.1928
(4) where I3 = subindex for soluble N
X3= soluble N in the runoff, mg/L
I4=8×10−7X43−0.001X42+0.4808X4−1.141 (5)
where I4 = subindex for soluble P in the runoff X4= soluble P in the runoff, µg/L
I5=-0.0002X53+0.0302X52−0.0236X5+0.1136 (6)
where I5 = subindex for COD in the runoff X5= COD in the runoff, mg/L
I6=-5×10−5X62+0.1385X6+0.0041 (7)
where I6 = subindex for specific sediment yield X6= specific sediment yield, MT/km2
The R2
(coefficient of determination) results of
the regression analysis for Eqs. (2) to (7) carried out by SPSS software are all larger than 0.95 which meets the required regression criteria.
The nonpoint pollution potential of watersheds in Taiwan has not been officially classified by the environmental authorities. A classification of NPPI for watersheds was developed by expert opinion. This NPPI ranking system classifies the potential pollu-tion hazard of watersheds into three classes − low, moderate, and high, as shown in Table 1.
Table 1 displays the pollution potential indices in ascending order. Higher NPPI values indicate high nonpoint source pollution potential in a given geo-graphical region. The NPPI values computed by Eq. (1) using various α values, were compared with those assessed by the panel of experts to determine the scal-ing factor (α) of Eq. (1). Linear least-squares regres-sion of the NPPI, computed from Eq. (1) with a α value of 1.5, versus values of potential indices as-sessed by experts, for five selected subwatersheds in the Feitsui Reservoir and Paoshum Reservoir water-sheds in northern Taiwan, had a coefficient of determination, R2
, of 0.9. Consequently, for an α value of 1.5, the computed NPPI values showed a high correlation with the experts’ ratings, and were Fig. 2 Average rating curves for contributing factors
100 90 80 70 60 50 40 30 20 10 0 0 5 10 15 Runoff volume (mm) 20 25 30 Subinde x I1 100 90 80 70 60 50 40 30 20 10 0 0 100 200 300 Soluble phosphorous (µg/l) 400 500 600 Subinde x I4 100 90 80 70 60 50 40 30 20 10 0 0 10 20 30 40 50 COD (mg/l) 60708090100 Subinde x I5 100 90 80 70 60 50 40 30 20 10 0 0 500 1000 1500
Specific sediment yidles (MT/km2)
Subinde x I6 100 90 80 70 60 50 40 30 20 10 0 0 0.5 1
Specific peak runoff rate (cms/km2)
1.5 2 Subinde x I2 100 90 80 70 60 50 40 30 20 10 0 0 1 2 3 Soluble nitrogen (mg/l) 4 5 Subinde x I3
Table 1 Classification of nonpoint source potential indices (NPPI)
NPPI Classification
<50 Low pollution potential
51~70 Moderate pollution potential
adopted in this study. Based on the foregoing analysis, the resulting formula for NPPI used for the Feitsui Reservoir watershed is as follows:
NPPI = 1.5×
Σ
(Ii⋅Wi) i = 1 6 WiΣ
i = 1 6 = 1.0 (8)IV. RESULTS AND DISCUSSION
The NPPI values determined by Eq. (8) were applied to the Feitsui Reservoir watershed to pinpoint critical subwatersheds that contributed to the nonpoint source pollution. The AGNPS was used to estimate the values of contributing factors (Xi). The inputs for AGNPS include cell area, precipitation, land slope, field slope length, energy-intensity value, soil erodibility factor, cropping factor, practice factor, soil texture, fertilization level, point source indicator, and COD factor, etc. (Young et al., 1989). Based on a 25-year, one hour, 98.3 mm storm event in the Feitsui Reservoir watershed and outputs from the AGNPS model, Table 2 lists a summary of the numerical val-ues of Xi for seven subwatersheds. Table 2 lists the numerical values of the contributing factor (Xi), For e x a m p l e , t h e P e i s h i h C r e e k s u b w a t e r s h e d (subwatershed 1 in Fig. 1) produces a runoff volume
of 10.16 mm (X1), specific peak runoff rate of 0.41
cms/km2
(X2), soluble N of 2.66 mg/L (X3), soluble P
of 290 µg/L (X4), COD of 74 mg/L (X5), and specific
sediment yield of 344.96 MT/km2
(X6) in the runoff.
The subindex values(Ii) calculated by subindex func-tions of Eqs. (2), (3), (4), (5), (6) and (7), and the resulting NPPI values calculated by Eq. (8), were also based on a 25-year, one-hour storm event in the Feitsui Reservoir watershed. Table 2 reveals that the numerical NPPI values for the seven subwatersheds in the Feitsui Reservoir watershed, as determined by Eq. (8), varied from 21 to 85. According to the nonpoint pollution potential classification in Table 1, all subwatersheds had a low to high potential of nonpoint pollution. Table 2 shows that the Hosaucha Creek subwatershed, subwatershed 2 in Fig. 1, which h a s t h e h i g h e s t N P P I v a l u e a m o n g s e v e n subwatersheds(85), falls within the class of high nonpoint source pollution potential. The Peishih C r e e k a n d H o k u n t z e C r e e k s u b w a t e r s h e d s (subwatersheds 1 and 3 in Fig. 1) are classified under moderate pollution potential with NPPI values of 67 a n d 6 5 , r e s p e c t i v e l y . T h e H o s a u c h a C r e e k subwatershed can thus be identified as the most criti-cal area, with a high upland runoff volume (12.70 mm), high specific peak runoff rate (0.97 cms/km2
), steep slope (54.56%) and extensive agricultural activity, resulting in high concentrations of COD (81
Table 2 Nonpoint pollution potential indices (NPPI) and related values for seven subwatersheds in the Feitsui Reservoir Watershed
Subwatershed
1 2 3 4 5 6 7
ID number
Peishih Hosaucha Hokuntze Kinkalau Kupolau Cheniche Wantan Name
creek creek creek creek creek creek creek
Area (km2 ) 138.3 11.8 20.9 23.1 27.8 51.3 29.5 Percentage of 45.7 3.9 6.9 7.6 9.2 16.9 9.8 total area (%) X1(mm) 10.16 12.70 10.16 7.62 5.08 5.08 10.16 X2(cms/km2) 0.41 0.97 0.39 0.27 0.45 0.30 0.81 Values of X3(mg/L) 2.66 2.17 1.95 1.37 0.85 1.67 1.28 contributing X4(µg/L) 290 230 240 160 50 180 100 factors X5(mg/L) 74 81 79 42 20 47 27 X6(MT/km2) 344.96 772.79 456.95 125.44 170.24 143.36 253.12 I1 10.21 27.07 10.21 3.37 1.06 1.06 10.21 I2 24.77 49.48 23.83 17.47 27.04 19.37 42.85 Subindices of I3 49.79 34.38 27.83 12.87 3.78 20.11 10.96 contributing I4 73.70 66.28 67.71 43.46 20.50 57.67 37.74 factors I5 82.70 90.06 88.12 37.58 10.12 44.95 17.56 I6 41.83 77.18 52.85 16.59 22.13 18.83 31.86 NPPI 67 85 65 33 21 38 37
mg/L), soluble N (2.17 mg/L), and soluble P (230 µg/ L) in the runoff, as well as a high specific sediment y i e l d ( 7 7 2 . 7 9 M T / k m2
) . A f t e r t h e s e c r i t i c a l subwatersheds were identified, appropriate best man-agement practices (BMPs) were recommended to re-duce the problems of erosion and pollution.
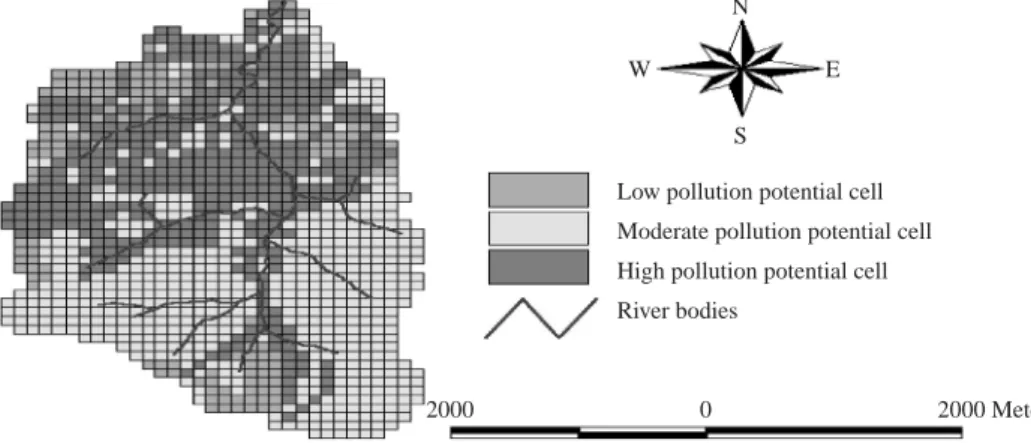
By using the GIS-based NPPI model developed in this study, subwatersheds were identified for those cells that contributed excessively large amounts of pollutants. With reference to the Hosaucha Creek subwatershed (land area = 11.8 km2
) described above, a cell size of 100 m × 100 m was used to screen the prioritized cells. Fig. 3 presents the resulting critical nonpoint source pollutant contributing cells in the Hosaucha Creek subwatershed, displayed using the GIS ArcView. Fig. 3 identifies those cells that bor-der the creek with high NPPI values, falling within the class of high nonpoint source pollution potential, that contribute excessively high quantities of sedi-ment and nutrients to the reservoir, and where reme-dial measures should be initiated to improve the wa-ter quality most efficiently. Cells on exposed high slopes are the principal sources of sediment. Furthermore, those cells that include many tea farms and orchards where excess fertilizer is used, were prioritized for further investigation.
The parametric approach, based on this NPPI model, can also be used to estimate the potential ben-efits of implementing BMPs, because inputs to the NPPI ranking system incorporating the GIS and AGNPS models can be modified to reflect the imple-mentation of recommended practices. In the Feitsui Reservoir watershed, the Peishih Creek subwatershed (subwatershed 1 in Fig. 1) with moderate pollution potential, produces high concentrations of soluble N (2.66 mg/L), soluble P (290 µg/L) and COD (74 mg/L) pollutants in the runoff (Table 2). Another 344.96 MT/km2
of specific sediment yield enters the reservoir and also produces a heavy sediment
load. Research conducted in the Peishih Creek subwatershed and the An-Kun farm of National Taiwan University has found that the detention ponds and grassed swales of BMPs exhibited high re-d u c t i o n e f f i c i e n c i e s f o r s e re-d i m e n t , n i t r o g e n , phosphorus, and COD (Kuo et al., 1997). Fig. 4 il-lustrates predicted NPPI values for the Peishih Creek subwatershed from a 25-year, one-hour storm before and after implementation of BMPs, including deten-tion ponds (called BMP1), grassed swales without
check dams (called BMP2), and grassed swales
with check dams (called BMP3), based on the above
test results obtained in the field. According to this figure, an NPPI value reduction, ranging from 31.3% to 50.8%, can be effected by applying BMPs. Therefore, the NPPI ranking system can be employed as a policy tool to evaluate the effects of applying alternative management practices.
Land use is recognized to be the main cause of nonpoint source pollution in a watershed. This NPPI value can be modified, increased or decreased, when applied to a specific land use scenario, resulting in a different pollution potential attributed to the change in land-use category. For example, there is a 50-ha
N
2000 0 2000 Meters
Low pollution potential cell Moderate pollution potential cell High pollution potential cell River bodies
S E W
Fig. 3 Class of pollution potential by “cells” in the Hosaucha Creek subwatershed (subwatershed 2)
Fig. 4 Change in NPPI values before and after implementation of BMPs in the Peishih Creek subwatershed (subwateshed 1) 100 80 60 40 20 0 BMP1 BMP2 Before BMP After BMP BMP3 NPPI 31.3% NPP reduction 32.8% NPP reduction 50.8% NPPI reduction
area near Yenshang Village in the Hokuntze Creek subwatershed (subwatershed 3 in Fig. 1). If the land-use category of this area was changed from forest-land to residential, the environmental impact of the land-use change could be assessed by considering the change in NPPI value. Presently, this subwatershed is classified as having a moderate pollution potential with an NPPI value of 65 (Table 2). However, the NPPI value would increase from 65 to 77 due to ac-tivity within this 50-ha residential area (about 2.4% of the total Hokuntze Creek subwatershed area). This 18.5% increase in the NPPI value changes the class of pollution potential from moderate to high. Accordingly, the increase in NPPI value is attributed to a different loading of pollutants governed by land-use category. For example, the concentrations of soluble N and soluble P in the runoff were increased from 1.95 mg/L to 2.77 mg/L, and from 240 to 450
µg/L, respectively, in this case study. The NPPI model can be used to manage the development of land.
V. CONCLUSION
The Feitsui Reservoir in northern Taiwan is the main source of potable water for Taipei City, Taiwan. This reservoir has been recently found to be in dan-ger of undergoing eutrophication. The NPPI ranking system, which aggregates a weighted linear sum of the subindices, proposed here, provides a means of identifying and ranking the critical contributing subwatersheds throughout the Feitsui Reservoir watershed. The NPPI is composed of six subindices (runoff volume, specific peak runoff rate, soluble N, P and COD in the runoff, and specific sediment yield), each appropriately weighted by importance. Output from the NPPI ranking system incorporated the GIS and AGNPS models, has implied that the critical nonpoint pollution source areas are the Hosaucha Creek subwatershed, the Peishih Creek subwatershed, and the Hokuntze Creek subwatershed in descending order of severity within the Feitsui Reservoir watershed. Remedial measures could be most effi-ciently initiated in these subwatersheds to improve water quality. After these critical areas were identi-fied and prioritized, appropriate BMPs were recom-mended to reduce the problems of erosion and pollu-tion. This NPPI system can also be used to evaluate the effects of applying alternative BMPs. Accord-ingly, the NPPI ranking system, which evaluates the potential for nonpoint source pollution hazards in watersheds, could be a useful tool in management and
policy decision-making. Moreover, the methodologi-cal approach proposed in this study may be applicable to other watersheds in Taiwan.
ACKNOWLEDGMENTS
The authors would like to thank the National Science Council of the Republic of China, Taiwan for financially supporting this research under Con-tract No. NSC 87-2211-E-002-014.
REFERENCES
Brenner, F. J., and Mondok, J. J., 1995, “Non-Point Source Pollution Potential in an Agricultural Watershed in Northwestern Pennsylvania,”
Wa-ter Resources Bulletin, Vol. 31, No. 6, pp.
1101-1112.
Dale, V. H., and English, M. J., 1999, Tools to Aid
Environmental Decision Making,
Springer-Verlag, New York, USA, pp. 205-207.
Hamlett, J. M., Miller, D. A., Day, R. L., Peterson, G. W., Baumer, G. M., and Russo, J., 1992, “Statewide GIS-based Ranking of Watersheds for Agricultural Pollution Prevention,” Journal of
Soil and Water Conservation, Vol. 47, No. 5, pp.
399-404.
Kuo, J. T., Yu, S. F., and Lin, J. T., 1997, “Develop-ment of a BMP Manual for Nonpoint Pollution Control and a Management Strategy for Reser-voir Watersheds,” Report No. 86EC2A0019, Hy-draulics Research Laboratory, National Taiwan University, Taipei, Taiwan, R.O.C.
Ott, W. R., 1978, Environmental indices: Theory and
Practice, Ann Arbor Science Publishers, Inc.,
Ann Arbor, MI, USA, pp. 66-71.
Trevisan, M., Padovani, L., and Capri, E., 2000, “Nonpoint-Source Agricultural Hazard Index: A Case Study of the Province of Cremona, Italy,”
Environmental Management, Vol. 26, No. 5, pp.
577-584.
Young, R. A., Onstad, C. A., Bosch, D. D., and Anderson, W. P., 1989, “AGNPS, Agricultural Non-Point Source Pollution Model,” Journal of
Soil and Water Conservation, Vol. 44, No. 2, pp.
168-173.
Manuscript Received: Apr. 22, 2002 Revision Received: Feb. 23, 2003 and Accepted: Jul. 03, 2003